February 6th – Wednesday Watchfulness
I’ve been mentioning that we could start to see some short term changes , possibly as soon as Wednesday of this week. Let’s take another look at the reasons on the charts…
.
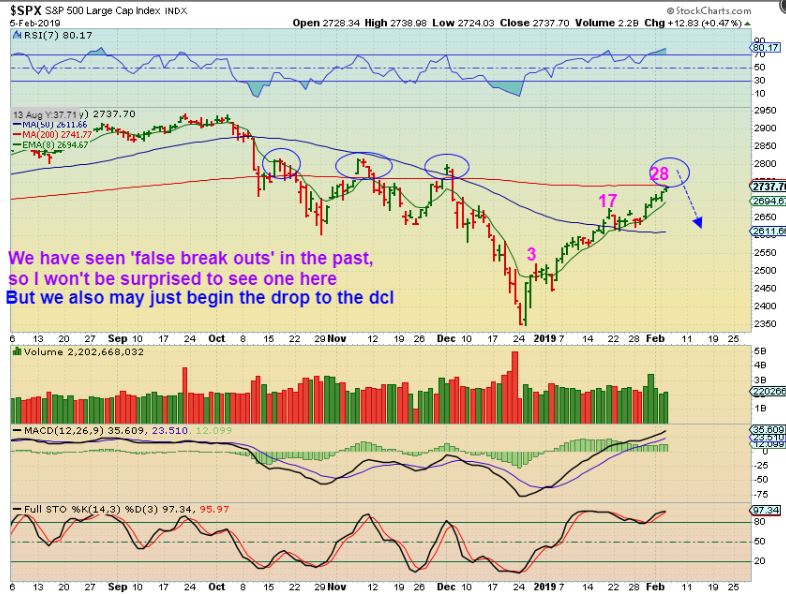
SPX – We are at resistance and within the timing that a dcl will come due. That said, we could still POP & then drop, but using a loose trailing stop under the 10 ema all the way higher has been pretty effective. The 8 ema (shown here) has been a nice guide. The first daily cycle has played out as expected.
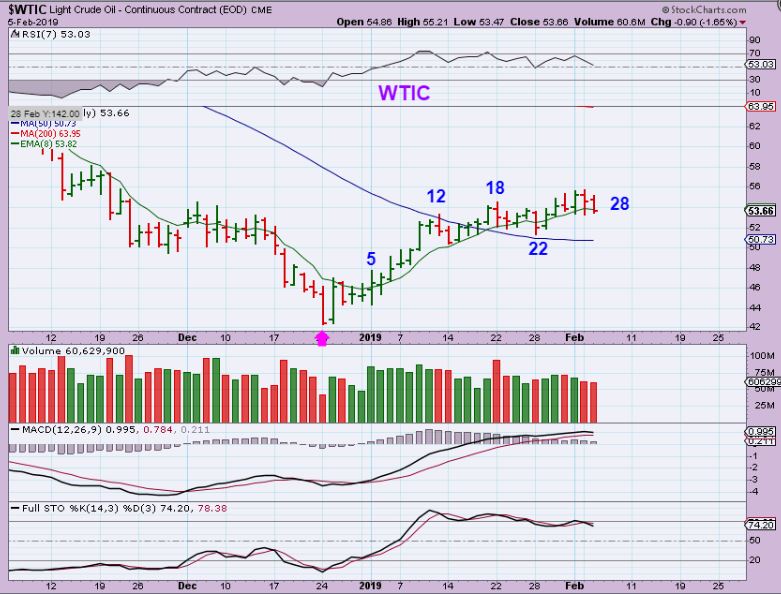
WTIC #1 – Oil has been churning sideways and unfortunately, that COULD continue. Oil has had 50 + days in a daily cycle in the past, so why not just take a look at what also COULD happen if Oil is to run higher before a dip down into a dcl.
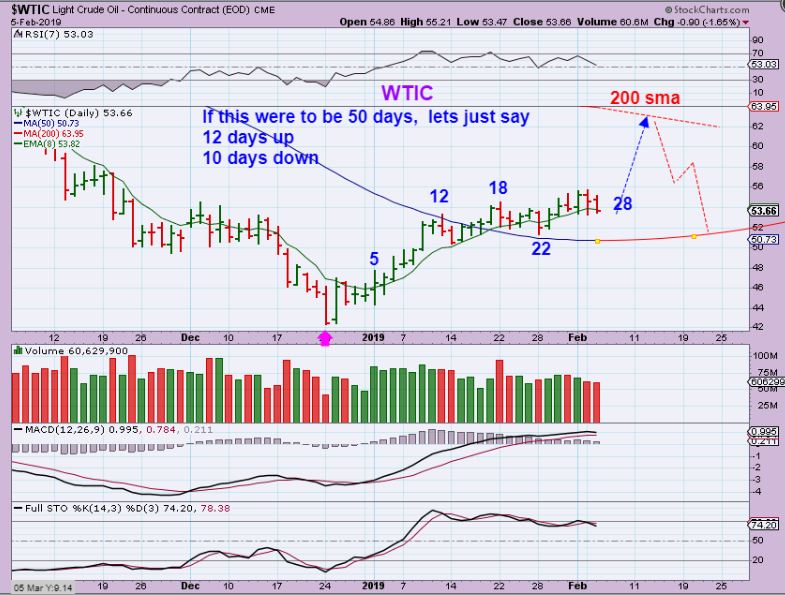
WTIC #2 – On day 28, a 50 day daily cycle would have 22 more days ( 4 weeks). First higher to the 200 sma, and then lower is what I have been saying is possible, as shown. So far it has been a slow crawl. I’d use the 50sma as a stop until we move higher though. The 8 ema is too tight.
.
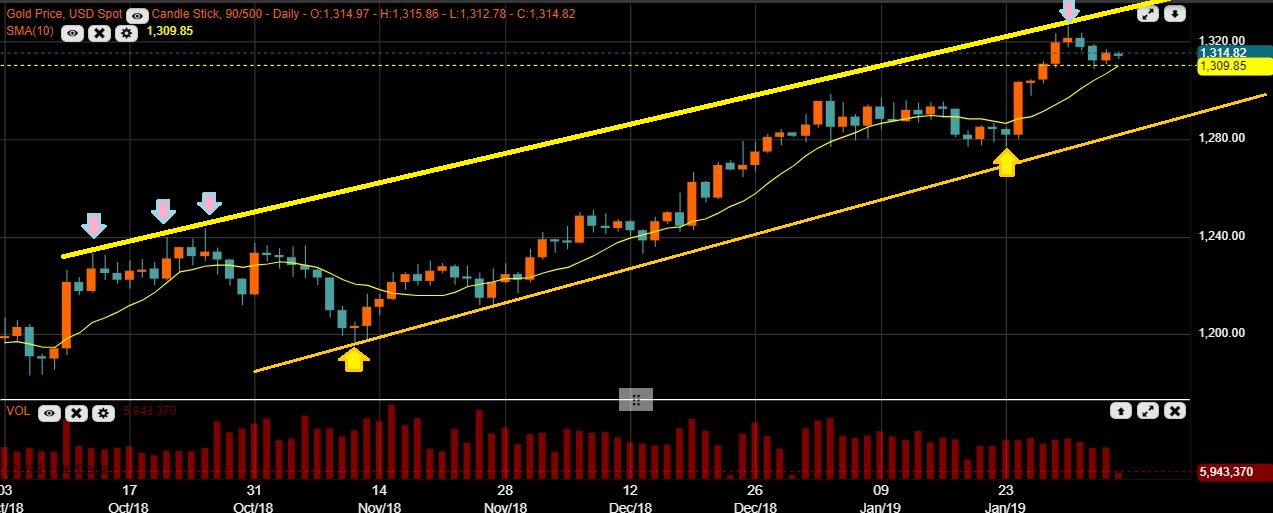
GOLD – Golds day 5 peak seems to match the 3 points in October that make up an upper channel line, and a bounce there again is not out of the question, so let’s zoom in….
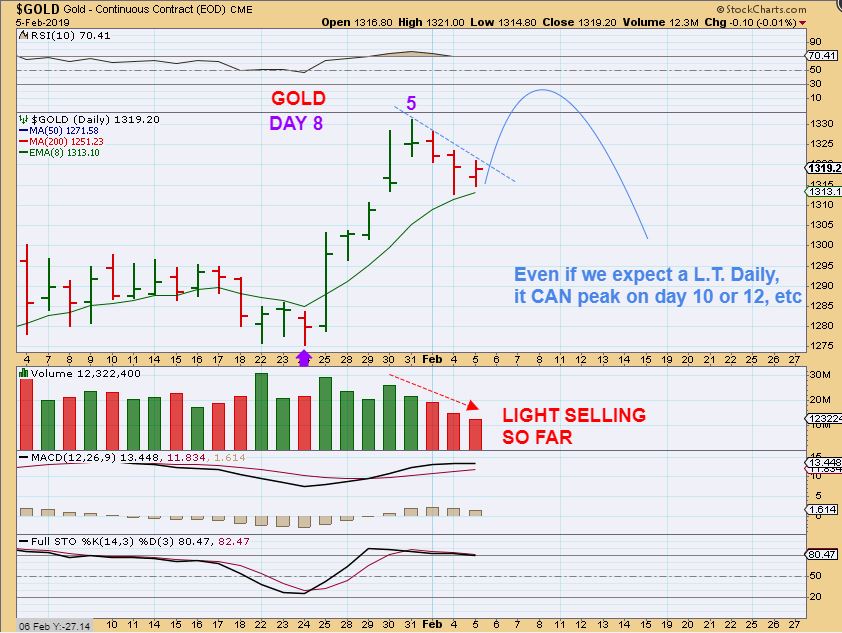
GOLD – Gold is on day 8 with a day 5 peak, and looks more bullish than bearish. In fact, it doesn’t look bearish at all at this point, it reversed on the 8 ema. It is only ‘Cycle count’ that adds caution.
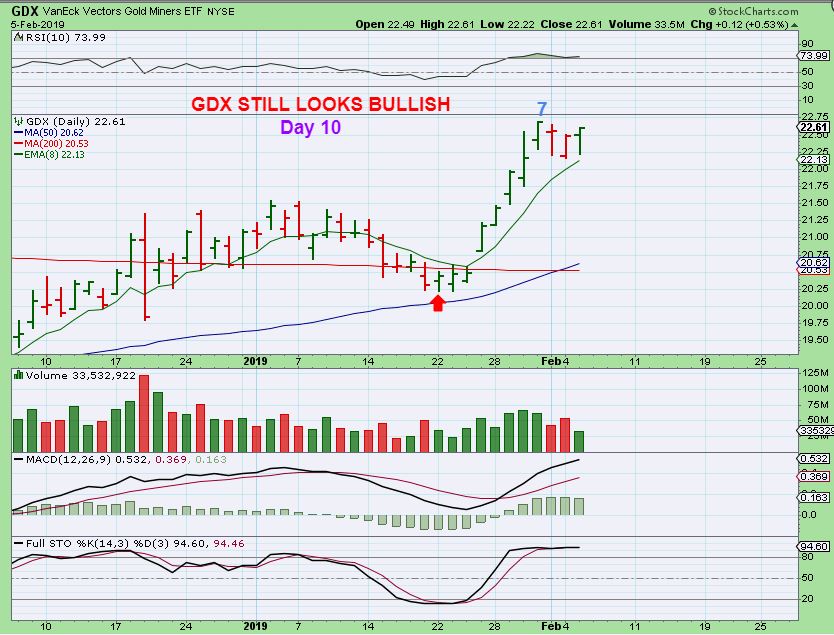
GDX – GDX sold off and put in a reversal at the 8 ema, also looking more Bullish than bearish too. Buying the dcl and riding with a trailing stop worked here so far.
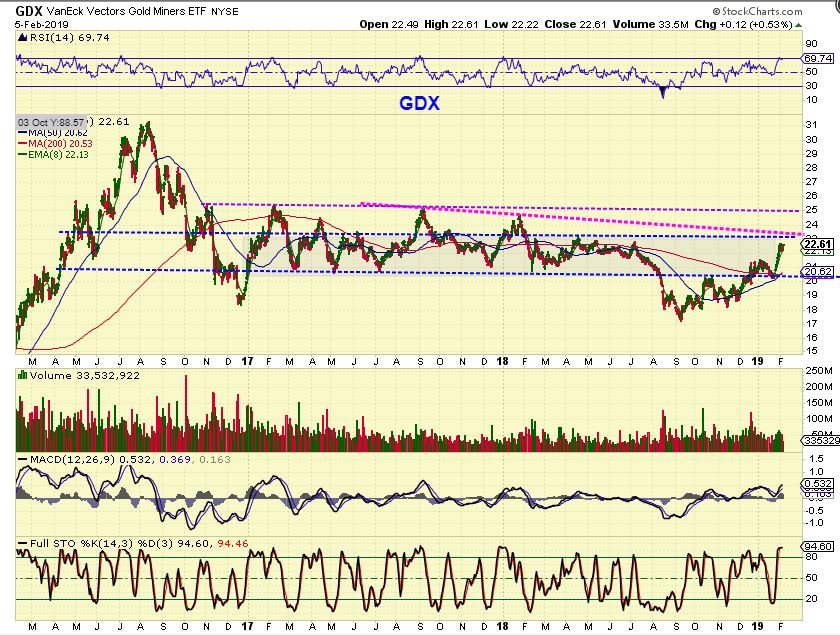
GDX – IF GDX moves higher, these are 3 close resistance points. A Blue & Magenta line are fairly close by around $23, and the Purple is near $25.
GDX / GOLD RATIO – This is something that I view as important, and it is breaking out ON A WEEKLY BASIS. It’s the weekly chart showing the Miners leading Gold. Notice the 2016 Break out. Miners were leading the way for a long time after that break out, SO MINERS could lead Gold here for Months. As we have seen…
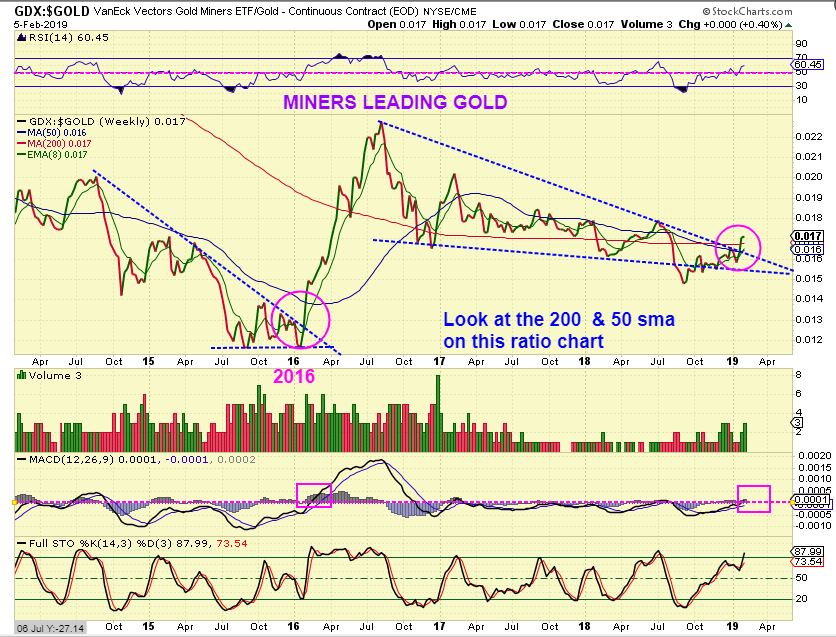
As we have seen, some Miners are definitely NOT following Gold. KL is at all time highs as Gold pulled back and stalled, and in the recent past other Miners ran to highs as Gold pulled back. This could be an indication that some Miners will act separately from Gold , and show strength despite Gold being down that day. I see that happening already.
.
These are the things that I will be watching going forward. Oil has the inventory release on Wednesdays too, so that could affect Oil. I want to include some charts below to share some ideas, but I don’t want to add a lot of new trade set ups right here. I do want to point out some interesting charts that can be useful in our future trading. We had some charts and discussions posted in the trading room/live chat area during the day too, so I will include some of those below too.
.
Enjoy your Wednesday trading!
.
~ALEX
.
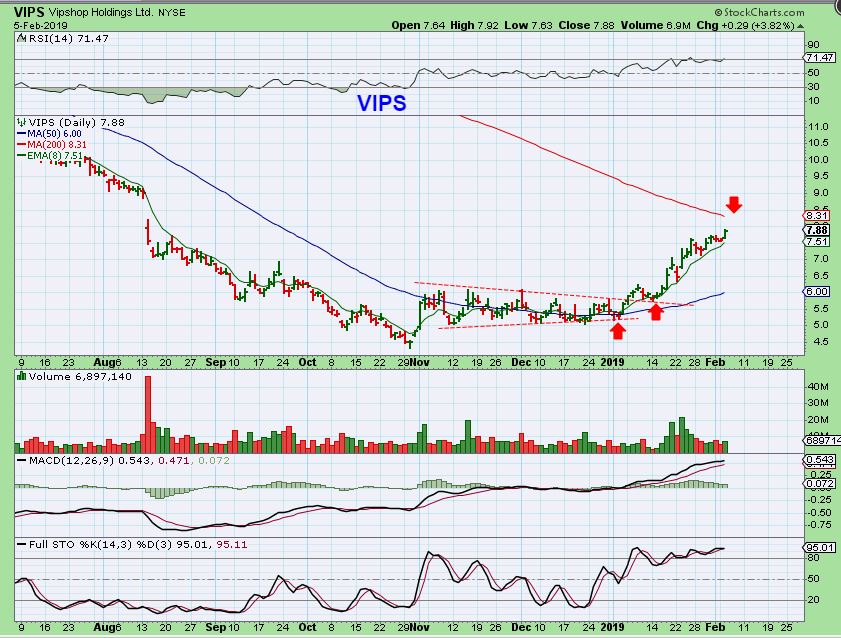
TRADES LIKE VIPS, ENPH, ETC are playing out nicely, but as mentioned recently, VIPS might be at an area that I would consider locking in gains ( All or 1/2) as it nears the 200sma. A great trade from the 2 buy points.
Note: If we get a dcl in the general Markets, trades like MU, SQ, etc may back test their 50sma .
.
WE SHOULD WATCH URANIUM GOING FORWARD
.
After years of choppiness and good trade set ups that never had long lasting follow through, that might be ready to change.
.
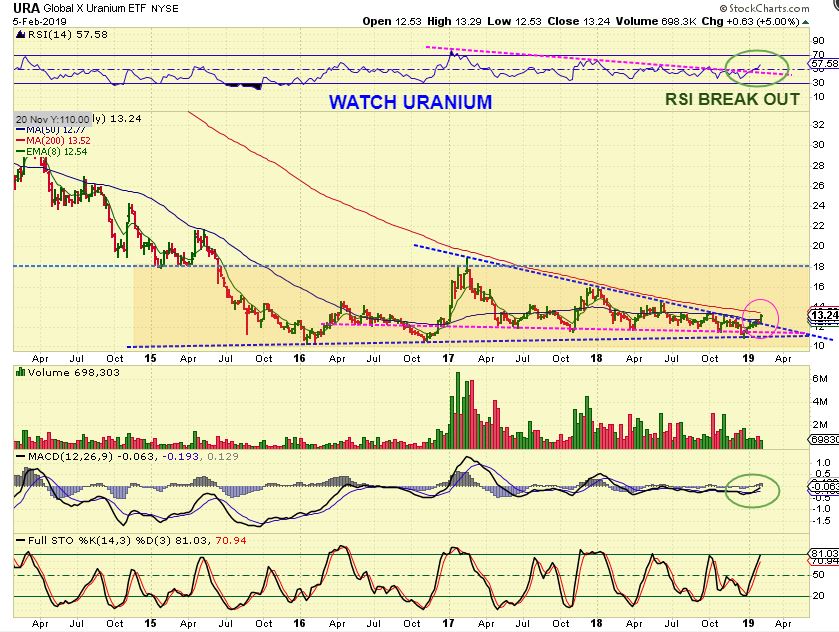
URA WEEKLY – I noticed that the Uranium Stocks were perking up, but stepping back, they look very bullish Long Term too. This is the Uranium ETF. This is a Multiyear Bull Wedge Base, and it is breaking out.
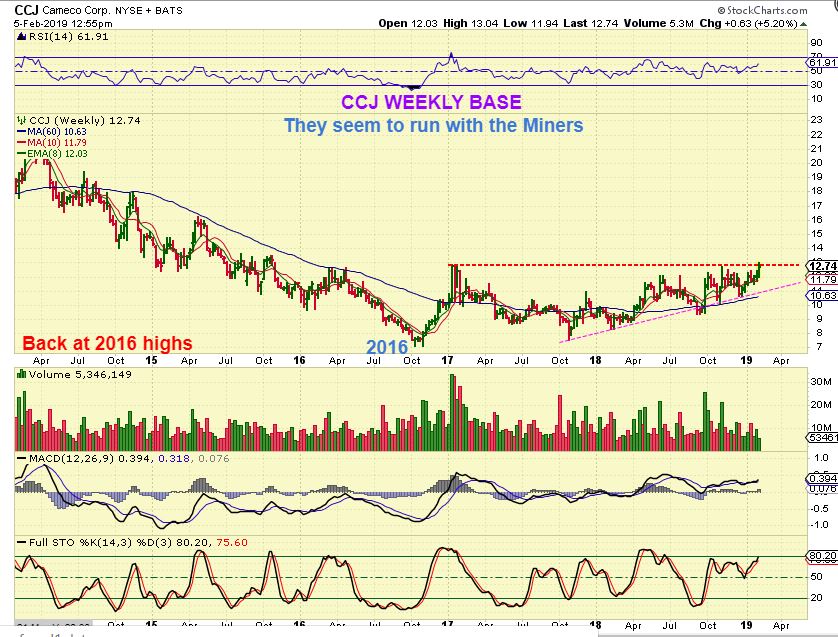
CCJ – Many Bullish Bases have formed and this is a base for CCJ. It has been a slow & steady climb (or actually rather choppy. The move has only been $8 to $13 in a year and a 1/2), but that can change. A break from the base can get this trending at a steeper angle.
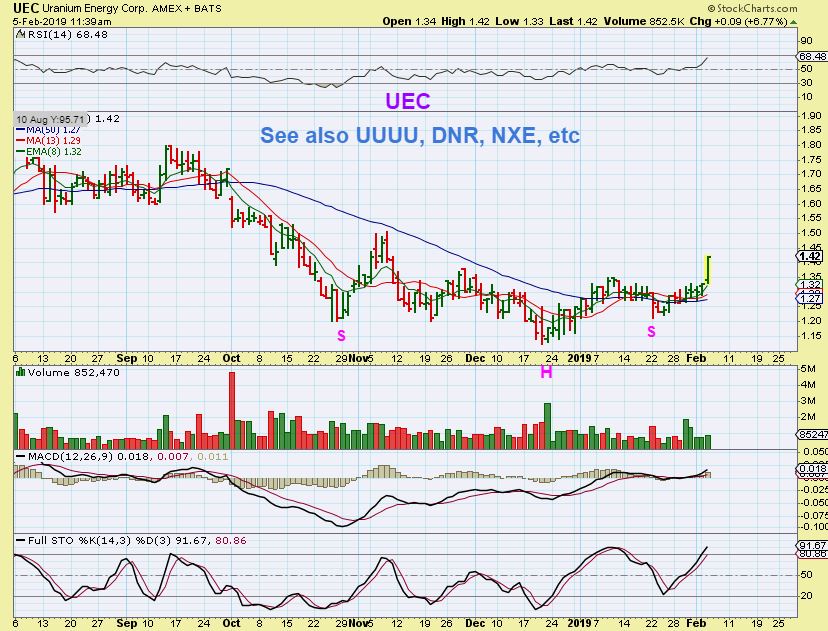
UEC – UEC broke higher from an inverse H&S Base Tuesday.
URG – URG broke higher, but I stepped back to look at another long base that has formed in this sector.
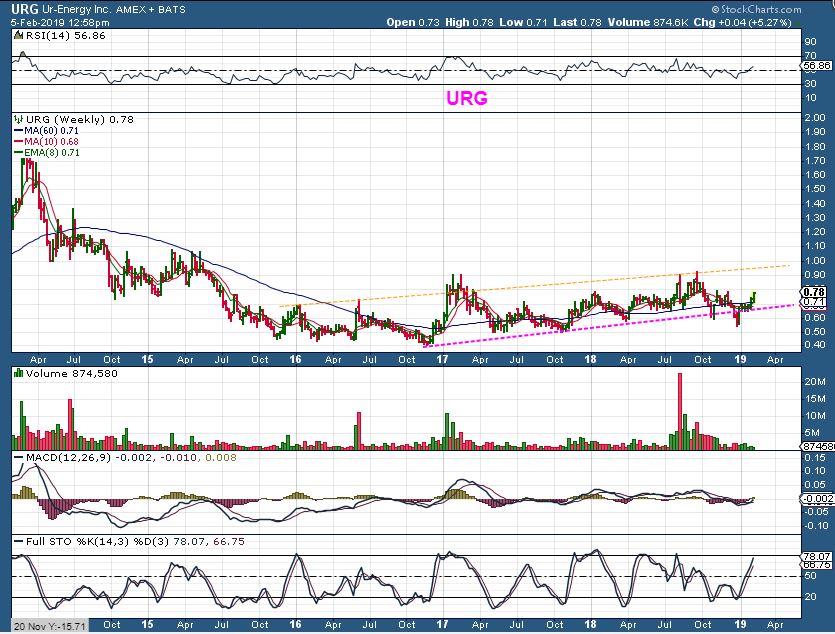
So I am thinking that these long bases forming in Uranium Stocks are ready to break out and run, at the same time as the Miners. That is what happened in 2016, so it could be a good ‘confirming’ sign for the Miners going forward too.
.
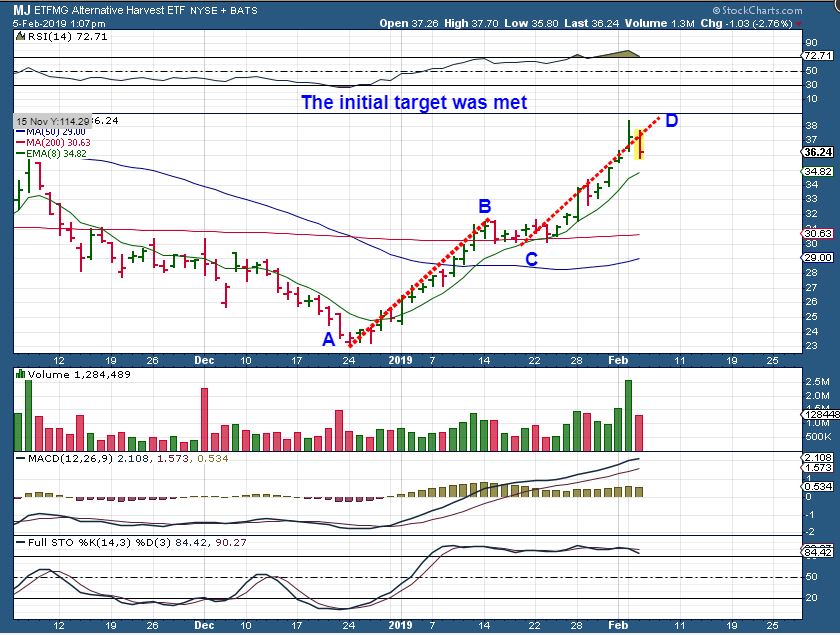
MJ – The MJ ETF did reach an A-B = C-D price projection, but they CAN extend further. A push higher makes this part of a 1-2-3 of 1-2-3-4-5- , so I don’t panic and sell, but I’d use stops. I am thinking that the 8 ema or 10 sma should hold as support if it is not ready for a more meaningful pull back. I would NOT ride this down to make a back test of the 200 sma if that happens next.
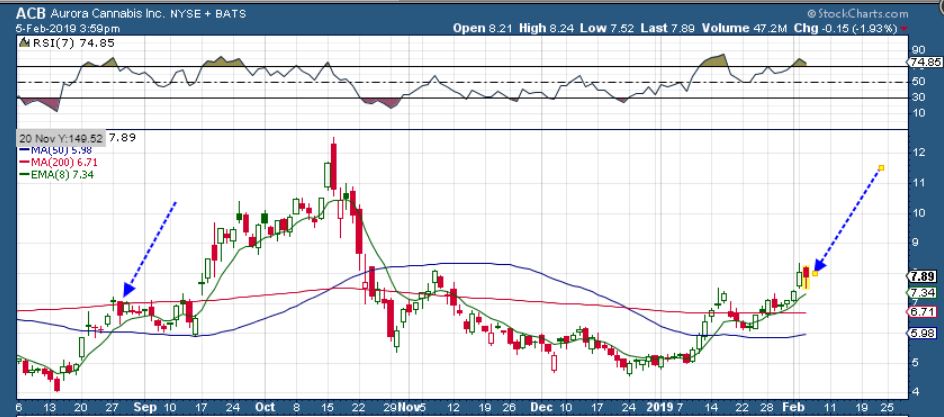
ACB – We did see a ‘hammer’ candle on ACB, but just like last August, it can just be a pause and not necessarily a top.
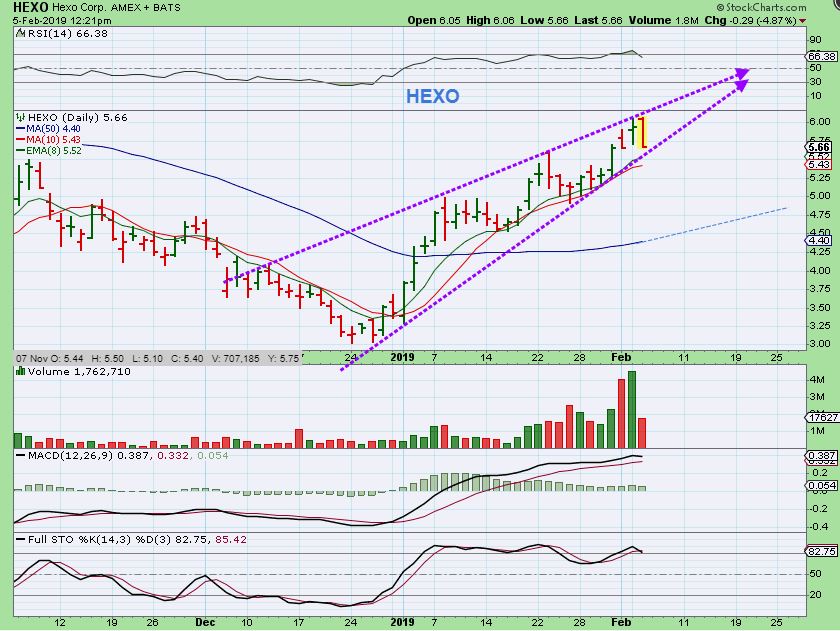
HEXO – I want to show you that HEXO ‘COULD’ break higher and finish forming a cup to October highs, HOWEVER…
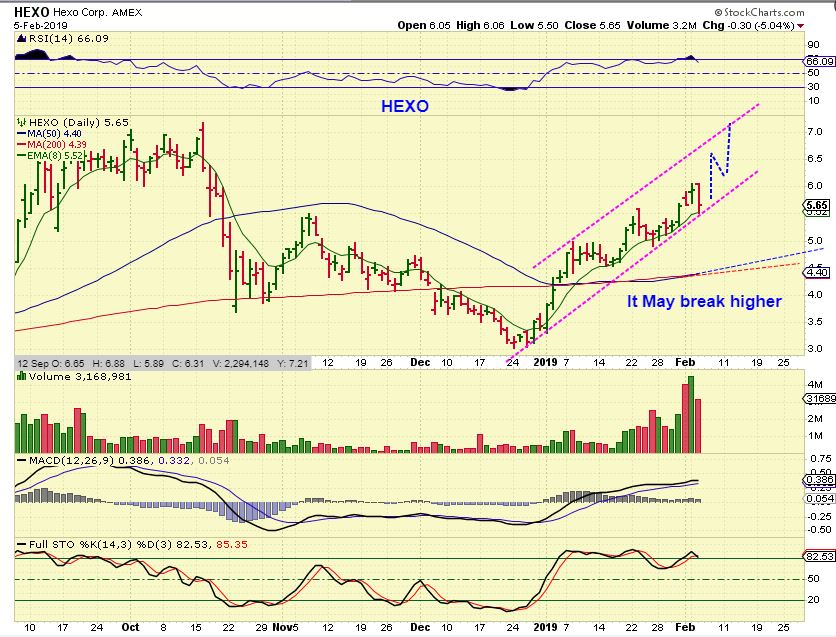
HEXO – If you have been with me for a while, then you have seen me point out rising wedges in the past, and you have seen them break down. It may only be short term bearish, but I am always cautious when I see a rising wedge ( Hexo). So it could be just ‘a temporary top’, but it needs to break higher soon. Why? HEXO never back tested the 50 & 200 sma, and that would be a $1 drop. I may use the 13 sma as a stop. The 10 sma has been slightly broken in the past.
,
SO ARE ALL OF THE MJ STOCKS NOW PULLING BACK? No…
.
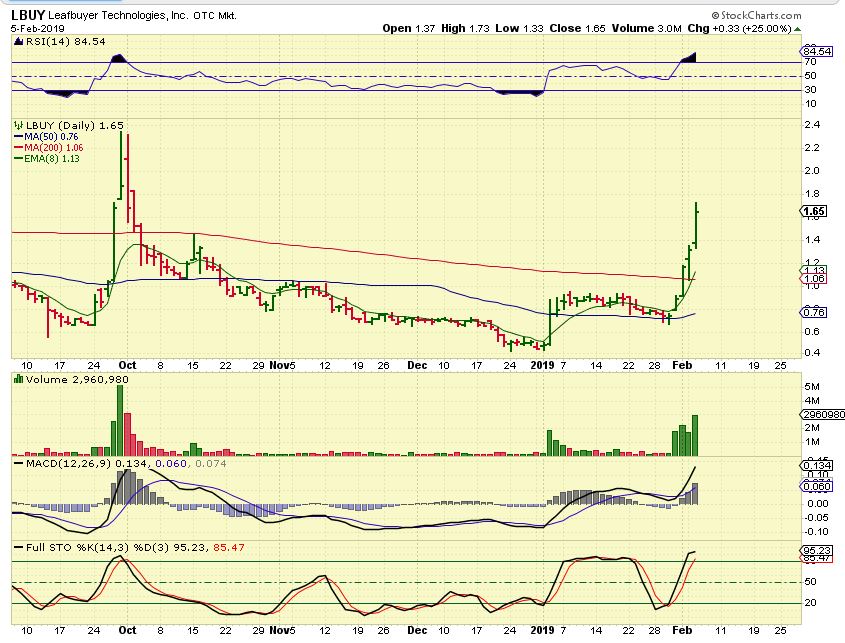
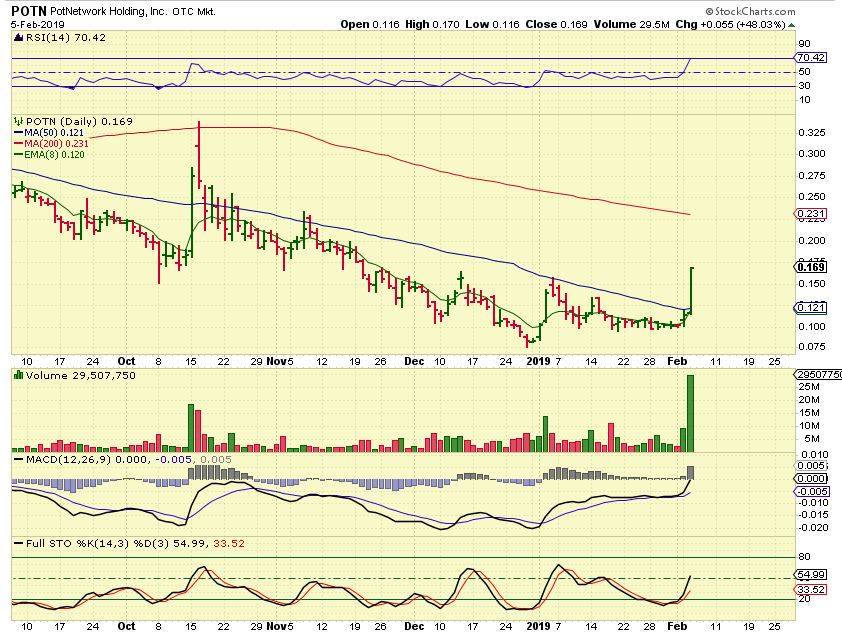
LBUY – I tried to buy this days ago as it bounced off of the 50sma. I figured that I’d just buy it the next day , but it toooook OFFFF!. POTN & LBUY are shown here to show that not all MJ stocks pulled back yesterday. Some set ups are still playing out upward.
POTN POP – LBUY yook off without me, so I jumped on POTN. I mentioned this in the live trading chat, since I planned on buying the wedge if it broke the 50sma. I posted this and mentioned that I bought it ( twice) and…
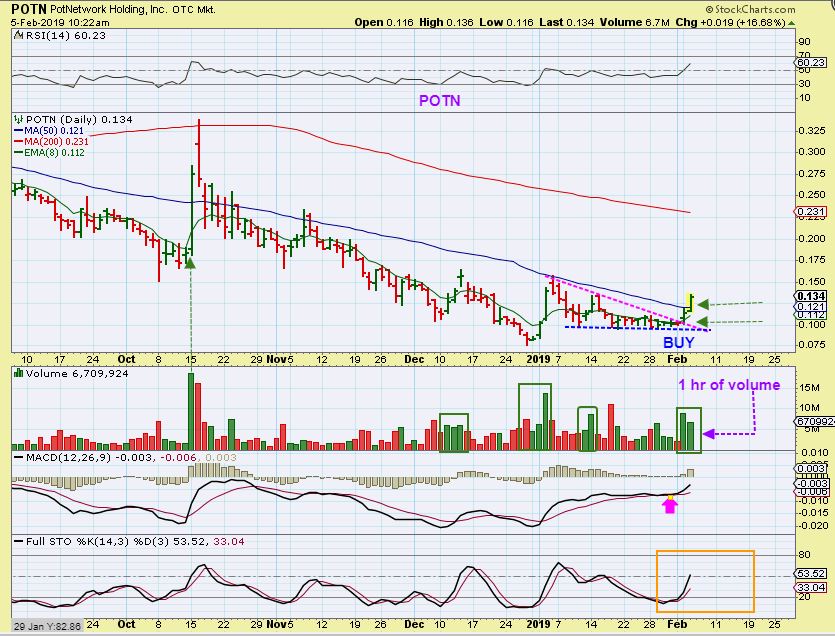
It then closed up almost 50%. Notice that it is still oversold, so I hope for more upside, like LBUY had.
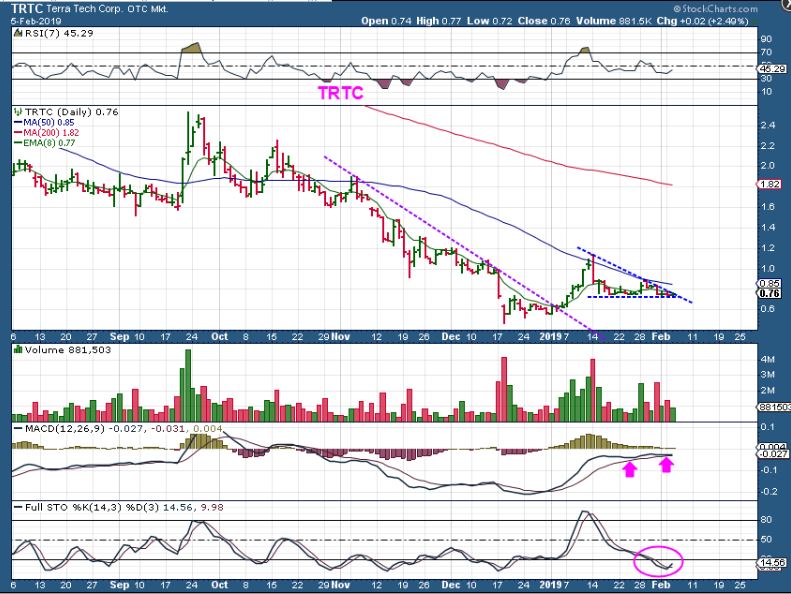
TRTC – TRTC has consolidated and crawled under the 50sma to form a bullish looking wedge. It looks ready to break out imminently, so I think that I will buy this is it breaks higher.
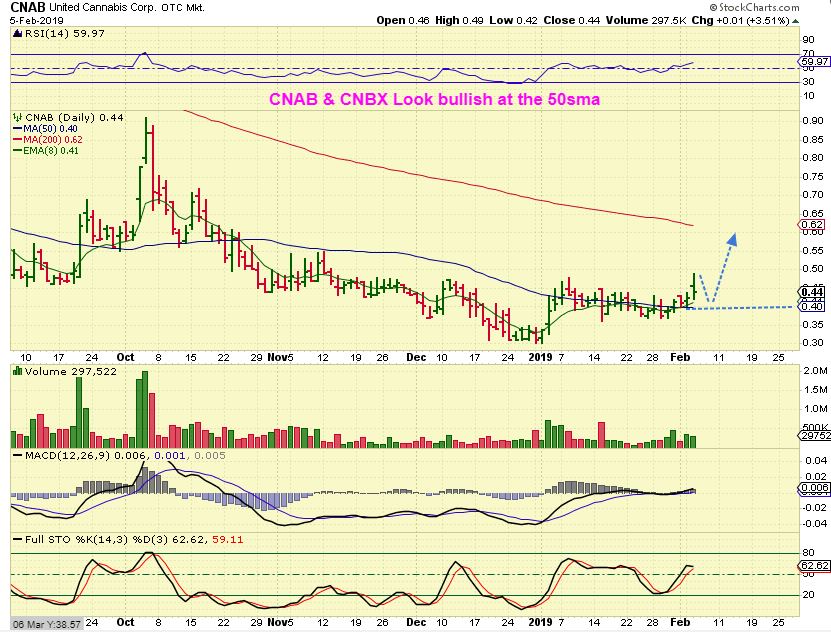
I ALSO LIKE CNAB & CNBX – If the MJ sector remains hot, these MJ stocks ( and others) are bullishly sitting on the 50sma so far, but also look ready to push higher.
.
WE DISCUSSED METALS RECENTLY
.
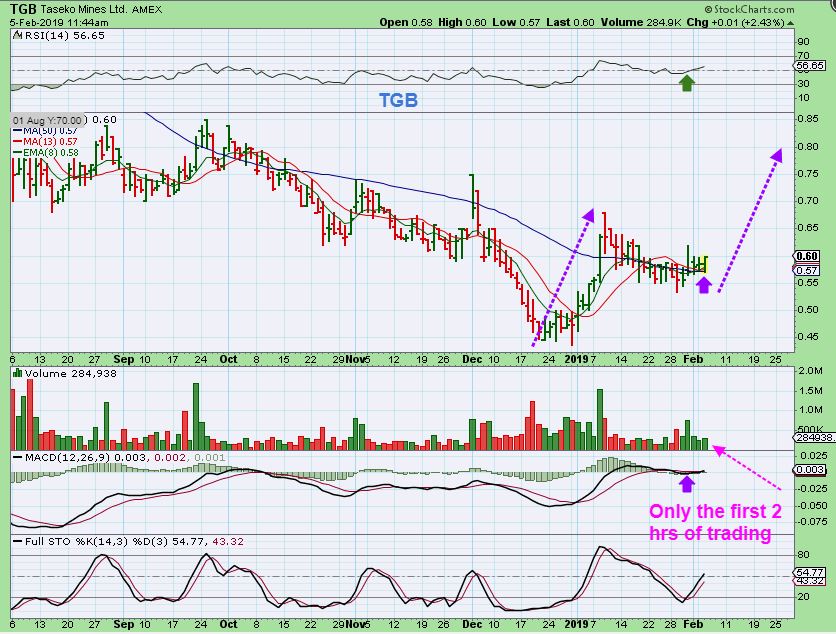
TGB – Several of the ‘Metals stocks’ highlighted recently continue to perform bullishly. TGB is crawling above the 50sma. We have TGB, WRN, AKS, X, HBM, etc acting correctly .
AKS – See also charts of WRN, CLF, X, HBM, etc. Again, this sector is also still acting bullishly after moving out of the lows.

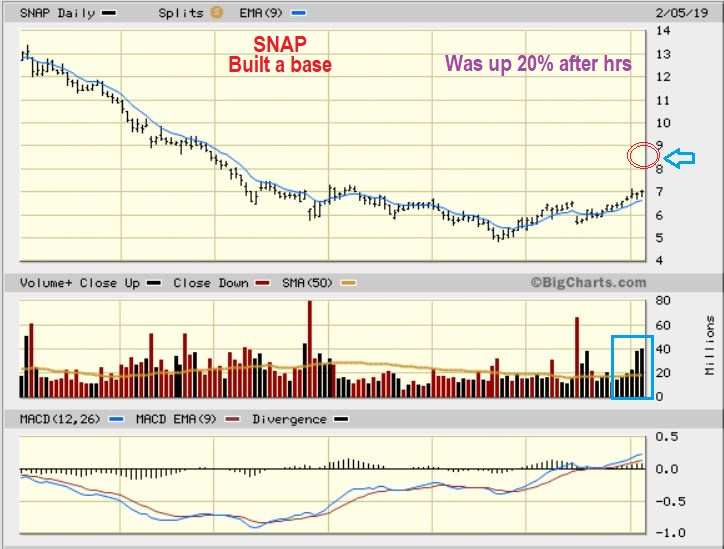
SNAP – Earnings SNAPPED Snap higher. I am expecting a general market pull back, so we’ll see how things go in the morning. Gap & Run? Gap Higher & then a Gap Fill ( Buy at the dcl?).
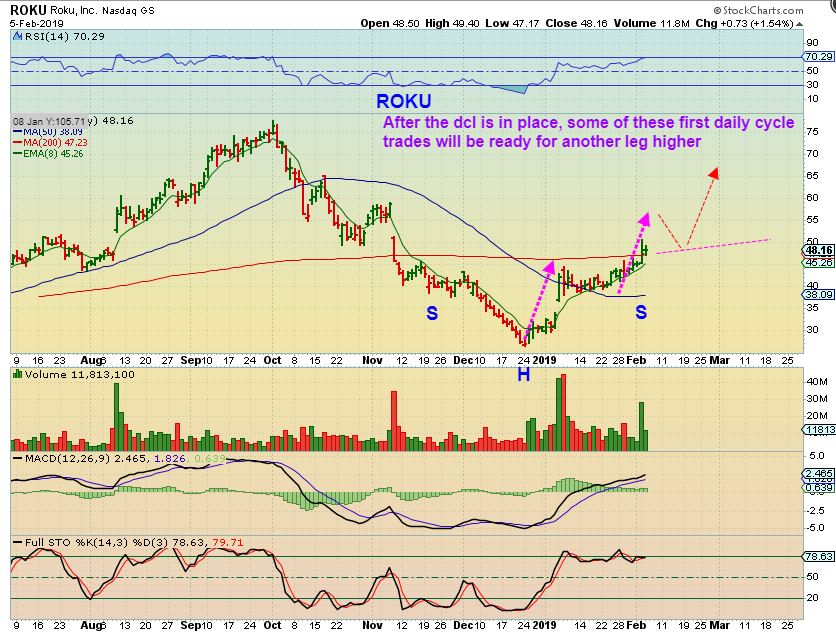
ROKU 2 CHARTS – After a pull back, many of these leaders will become ‘Buy’ Set ups for another leg up. These are just 2 ideas for ROKU to give you an idea of what we’ll be looking for. This is a pull back now to the 50sma, or…
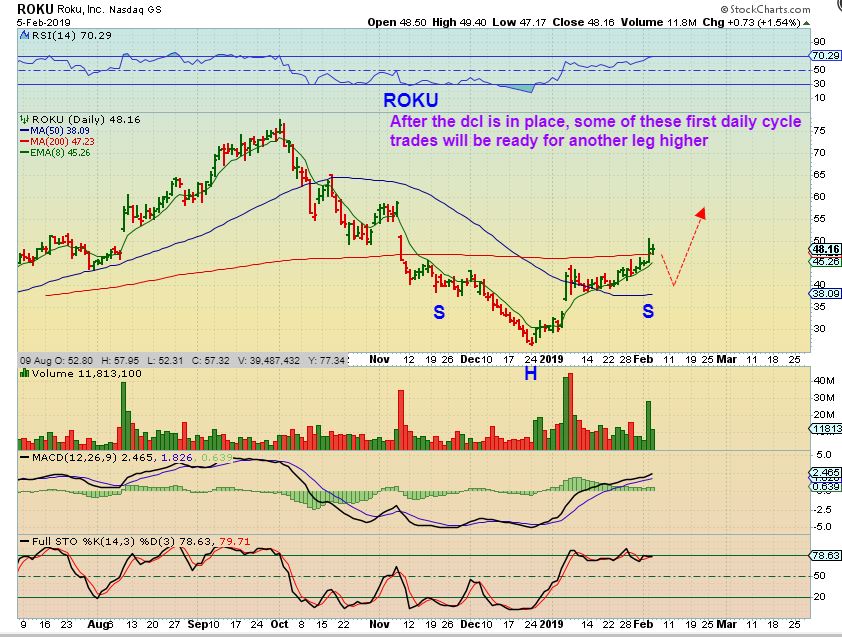
If it extends a bit further and pulls back tot he 200 sma.