Feb 5th – Time For A Change?
Nothing has really changed since the long weekend report, but I’m going to discuss why it might be time for a change. Let’s begin…
QQQ – This has honestly played out perfectly, but it may be “time for a change”. The first daily cycle is close to the timing that I would expect a ‘peak’ at day 28. We also have the 200 sma and Trump speaks on Tuesday night.
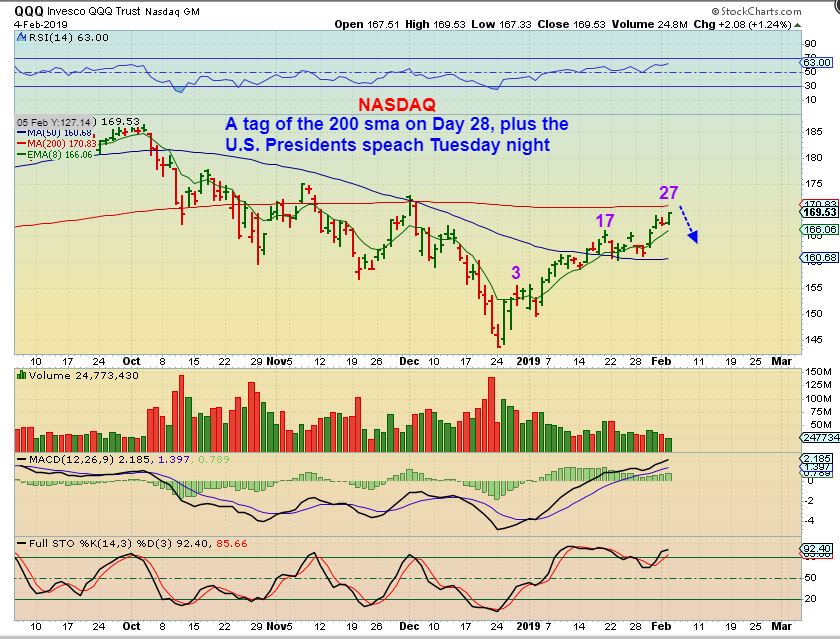
QQQ SAME CHART– At times, you get a false break out higher & then it rolls over ( see November 7 and Dec 1), so after the speech, Wed COULD gap over the 200sma, but we are due for a dcl, so we keep that in mind. I would sell if I owned TQQQ and buy the dcl. SQQQ MIGHT EVEN BE AN OPTION FOR THE EXPERIENCED TRADER THOUGH, ONCE WE GET A SWING HIGH IN PLACE 🙂
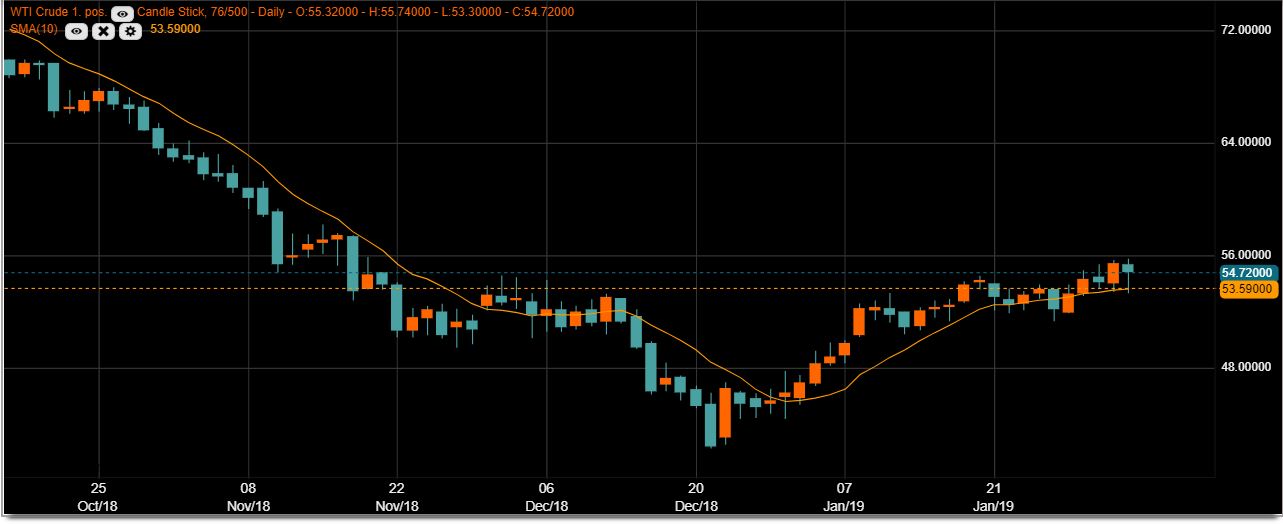
WTIC – Oil dropped at the open, but it bounced off of the 10sma and closed only slightly down. No change with Oil.
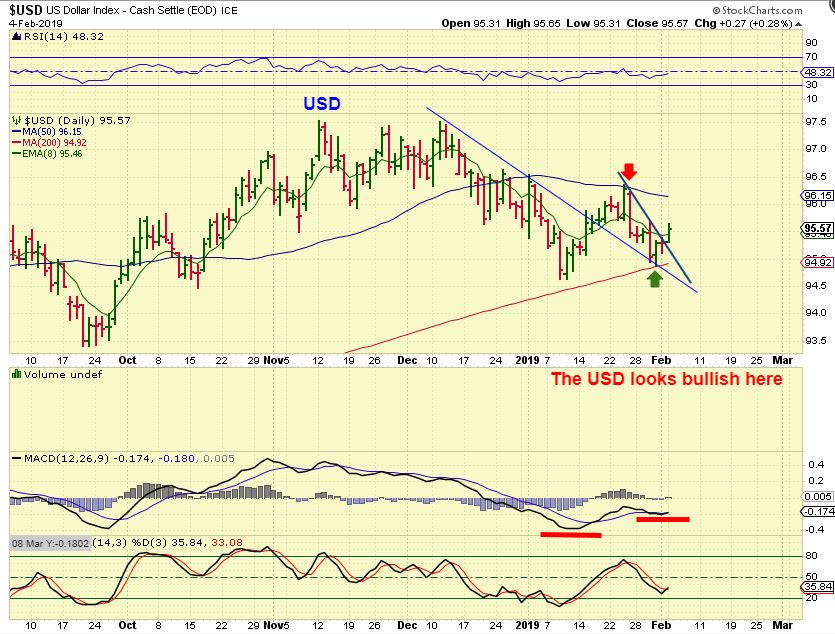
USD – The USD looks bullish after bouncing off of the 200sma. If it does run higher, Gold may continue lower, but the 50sma did stop it 2 weeks ago & may do that again.
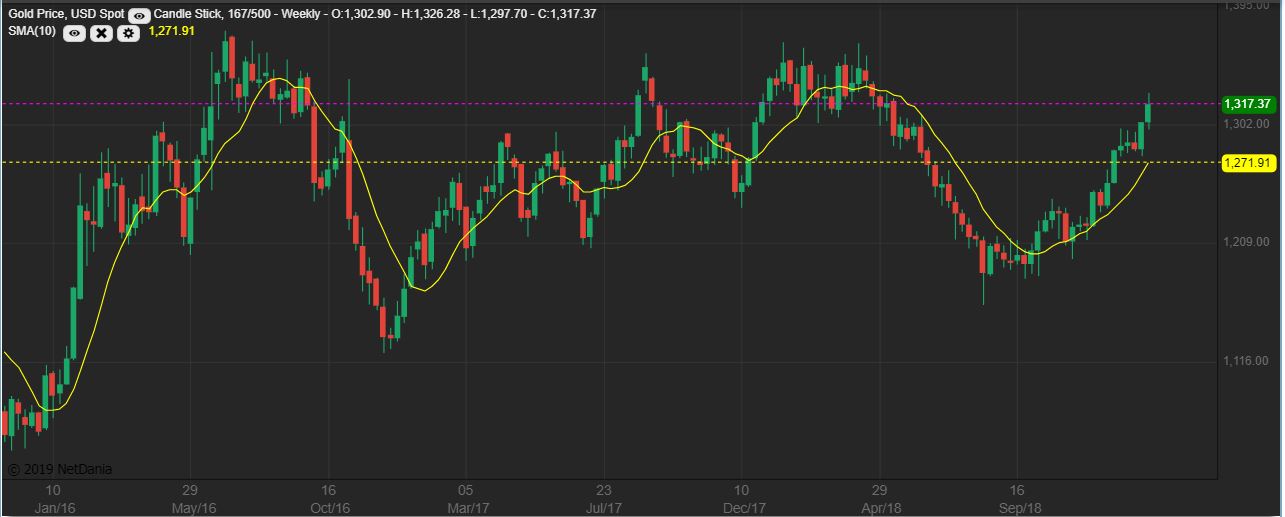
GOLD WEEKLY – This just shows that Gold is pushing against an area of congestion to the left ( or resistance).
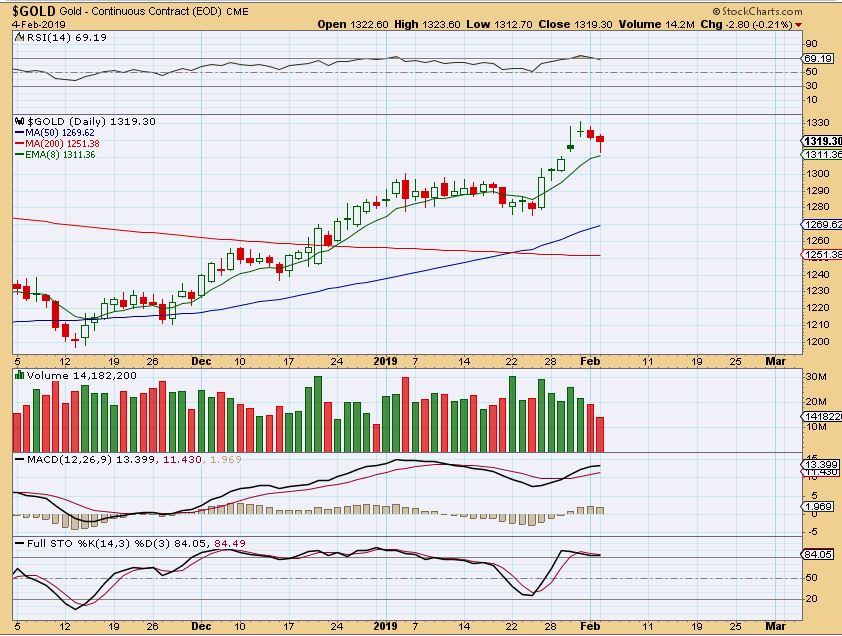
GOLD DAILY – Gold dropped on day 7 and recovered off of the 8 ema. It can go higher, even if it is to be a L.T. Daily Cycle.
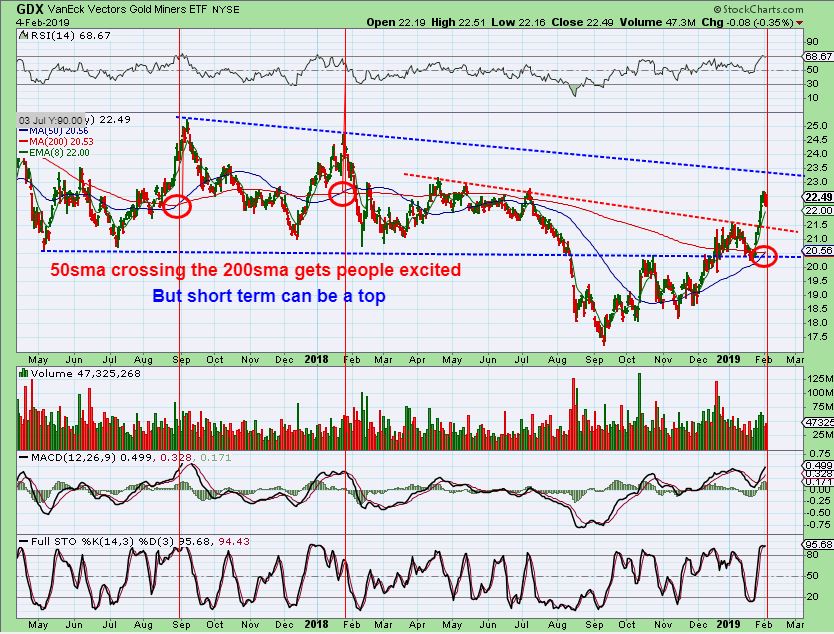
GDX – GDX dropped & reversed higher too. I was asked, “Did you know that the Golden Cross is taking place on Precious metals, isn’t that a Buy Signal? ” Golden Cross is the 50sma crossing above the 200sma. Yes, I did see that ‘crossover’ coming. And yes it is viewed as Bullish, I agree, but basically it means that things have been bullish & may be bullish long term too. That said, it is not a ‘short term Buy signal’. To be honest- I have seen Pull back Shortly after the 50 /200 cross more often than not . It is not a short term BUY signal.
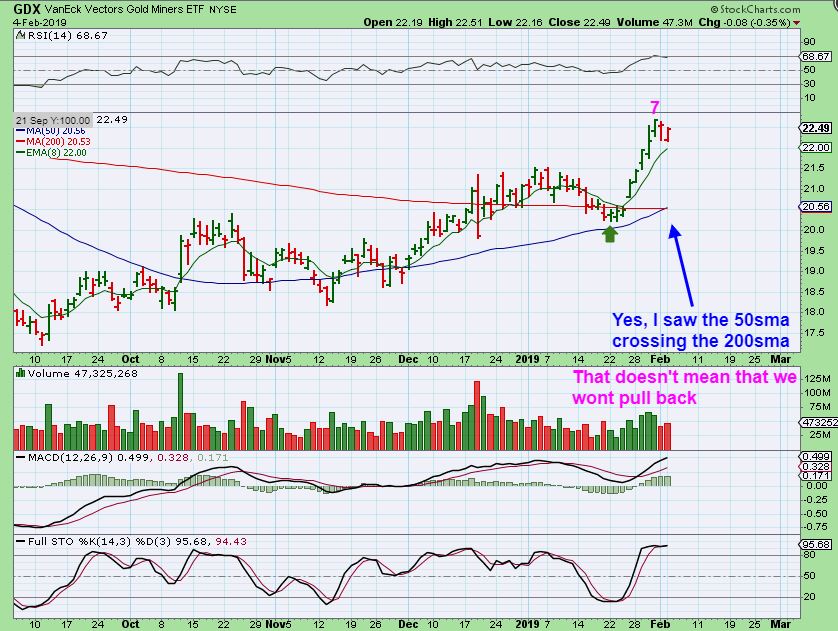
GDX – I said, “To be honest- I have seen a Pull back Shortly after the 50 /200 cross more often than not .” It is not a short term BUY signal. We have seen them each year and here they are seen on this chart. In 2017 & in 2018 , it was actually seen at The Peak of the Intermediate Cycle and we may be close to this ones peak too, if an ICL is due.
.
General Markets: So I think that ‘timing-wise’ and also since we near the 200 sma, the first daily cycle for the General Markets out of that ICL could peak at any time.
Oil has longer daily cycles, so I am less concerned there, and OIL remains above the 50 sma. I would expect that it should move higher to the 200 sma too.
I am bullish Precious Metals long term in 2019, and I explained in the weekend report that the way Miners came out of the last ICL was deceptively Bullish. They built a base and then after looking choppy and weak, ramped up out of that base to complete the right side. Are they done and ready for a pull back yet? While I think that everyone here knows that I am bullish long term, I still recommend using reasonable stops to lock in gains or protect profits , since we are also coming due for that ICL and it may be more of a drop than many think possible. I want to discuss a few trades below, and it will include some Miners that are still very interesting set ups.
.
Enjoy your Tuesday trading!
.
~ALEX
.
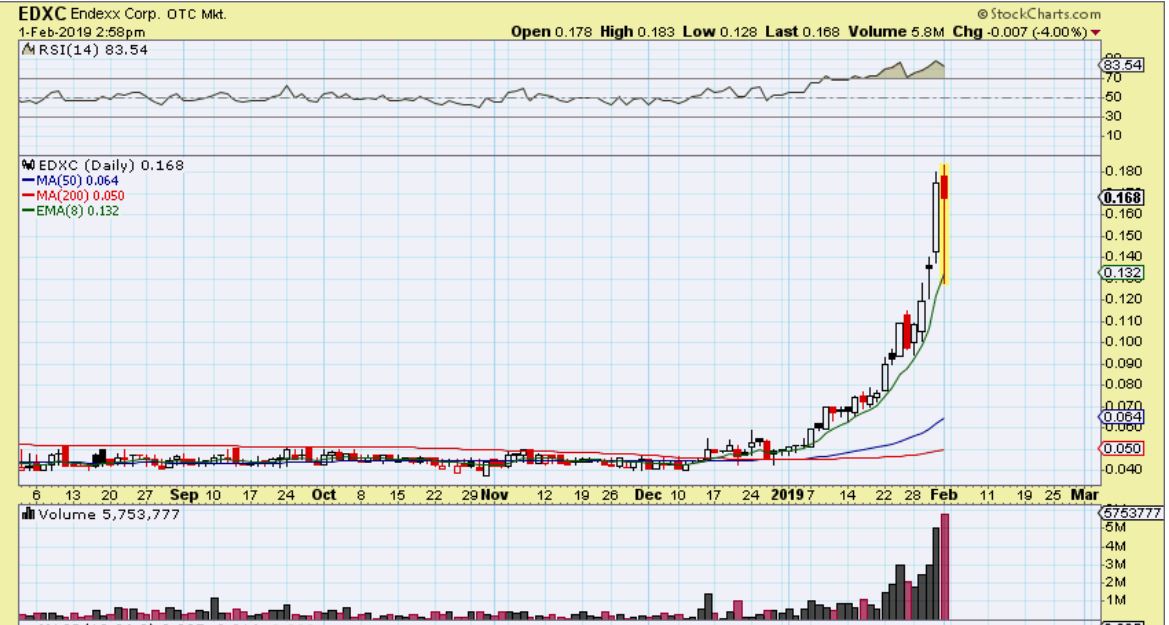
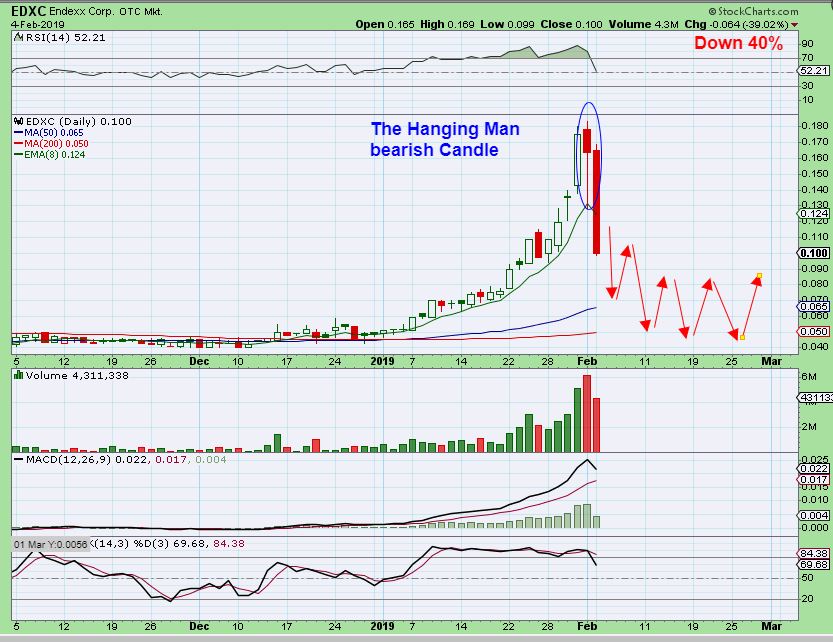
EDXC – I pointed out the ‘Hanging Man’ Candle as a sell , and showed an example where price falls after this recovery. This is usually a top and a ‘sell signal’. I sold more on Friday at the top and wrote in the comments that I sold yesterday morning too.
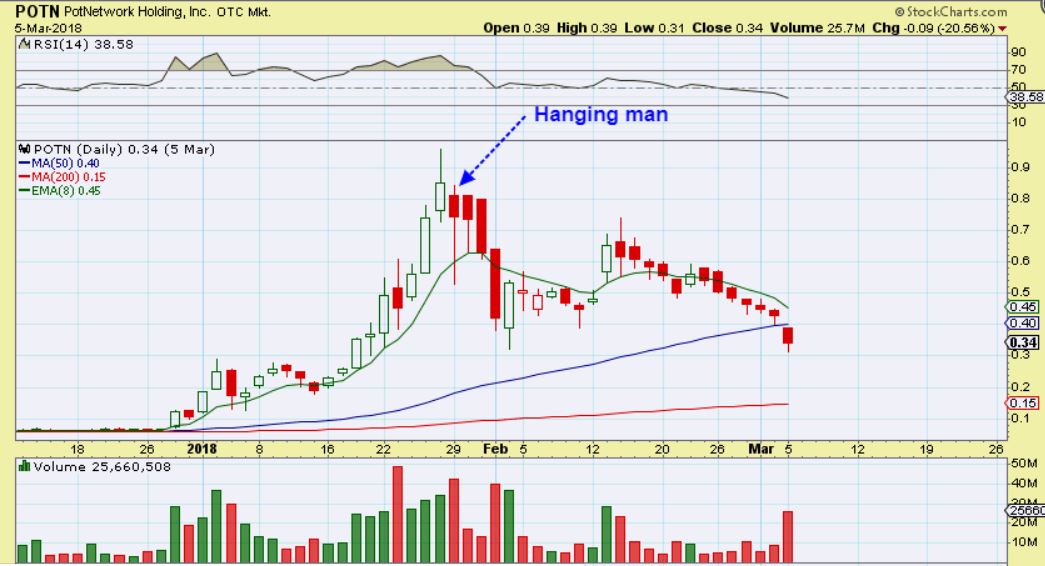
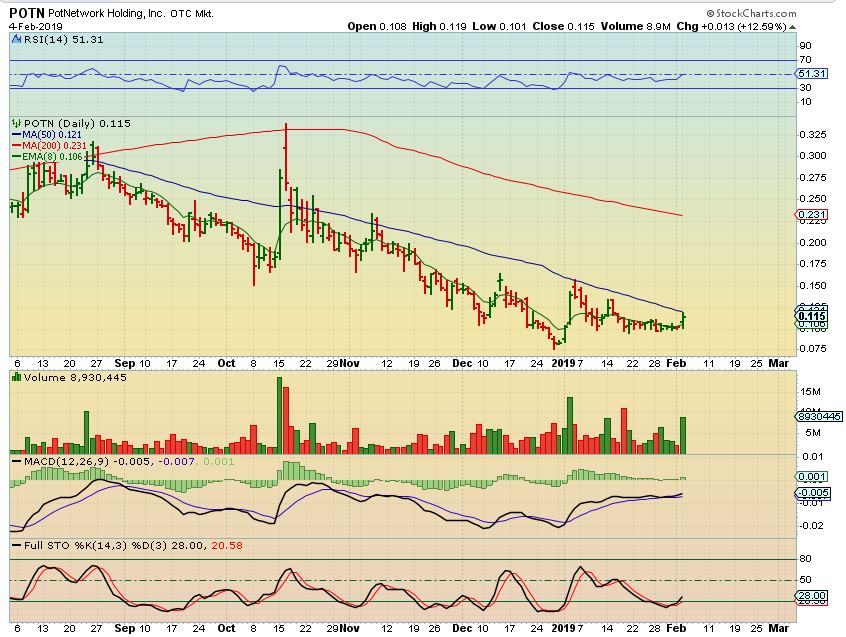
THIS IS ANOTHER EXAMPLE – POTN had a straight up run & then a hanging man. It then went from 80 cents to almost 30 cents in the next 4 days. It’s often a big haircut.
EDXC – EDXC dropped 40% yesterday after trading at the highs for a while. I do want to buy back in later, but it often takes a while for a broken parabola to consolidate & build itself back up. I’ll look for an entry in the future.
.
OTHERS ARE STILL SETTING UP AND RUNNING. IT IS AMAZING HOW MANY OF THESE ARE SETTING UP AND MOVING HIGHER.
.
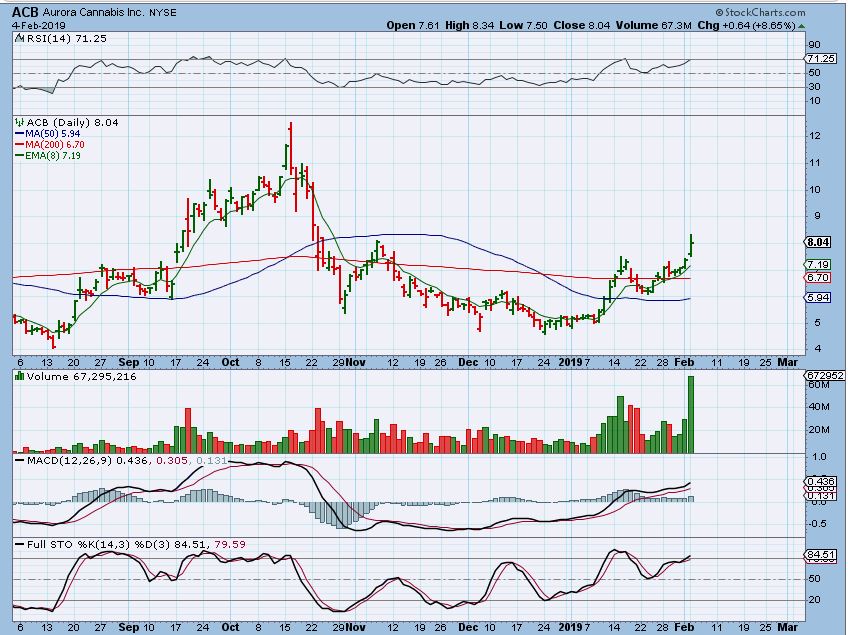
ACB – ACB broke out and I do expect it to continue to run, and it can run to Oct highs or even higher. That was excellent volume, so if you entered that trade, I recommend that you ride it.
.
POTN – For those that like the penny stocks, POTN is showing signs of life with a bullish wedge breaking higher with some nice volume pops. I’d buy it as it is breaking through the 50sma, if that happens .
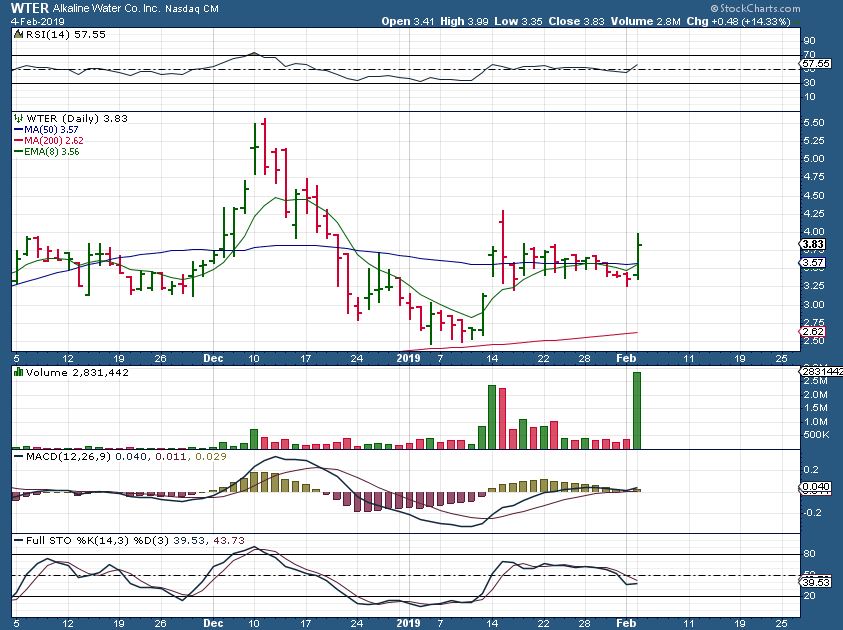
WTER & CNBX May be ready to run too. WTER lost the 50sm last week and suddenly jumps 14% with a sudden pop of volume & price. CNBX is riding the 50sma with volume popping.
Many MJ Stocks are still Bullish looking, setting up, or running wild ( CRON, CGC, HEXO, LBUY, NBEV, etc etc ).
.
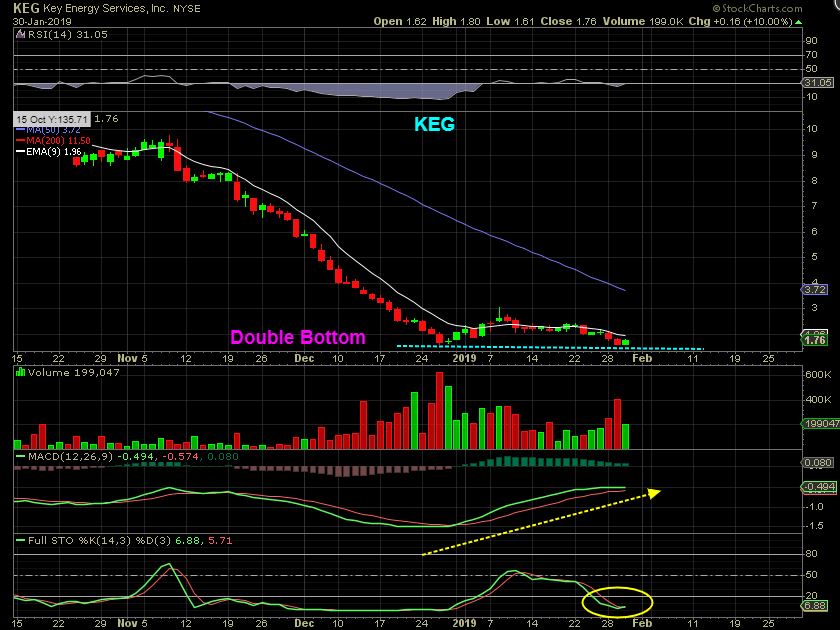
KEG On January 30th KEG formed a double bottom with BIG divergence , and I posted it as a buy at $1.76.
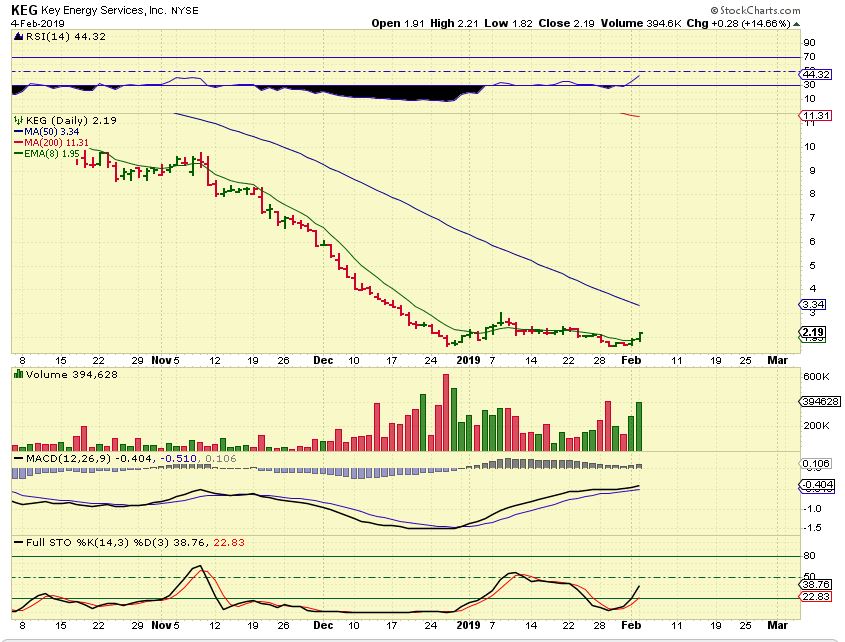
KEG – It is now climbing and suddenly popped 14% Monday. This looks very good, I would not sell it yet. A run to that 50 sma is big gains.
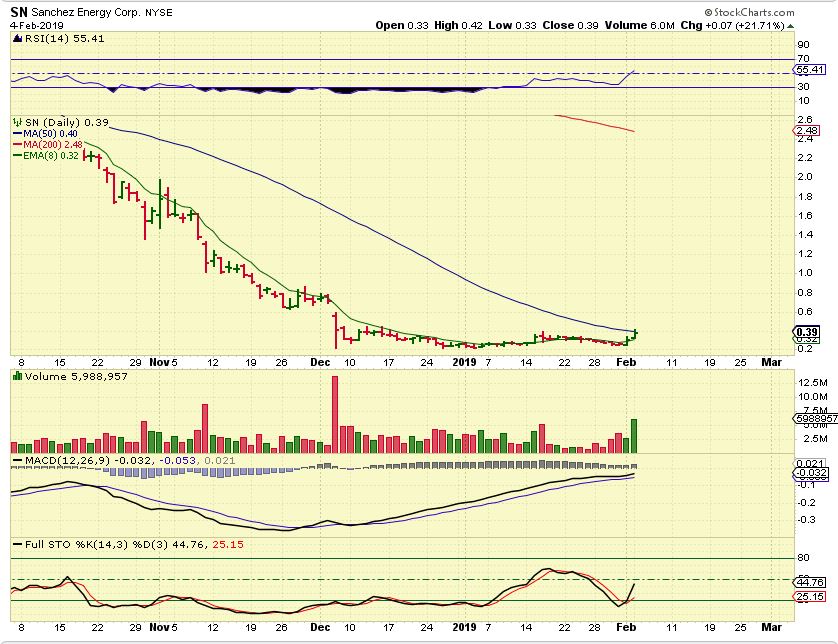
SN – JAN 23 I posted SN as a round base , but it slowly started to drop lower below the 8 ema. Friday it popped above that 8 ema again and…
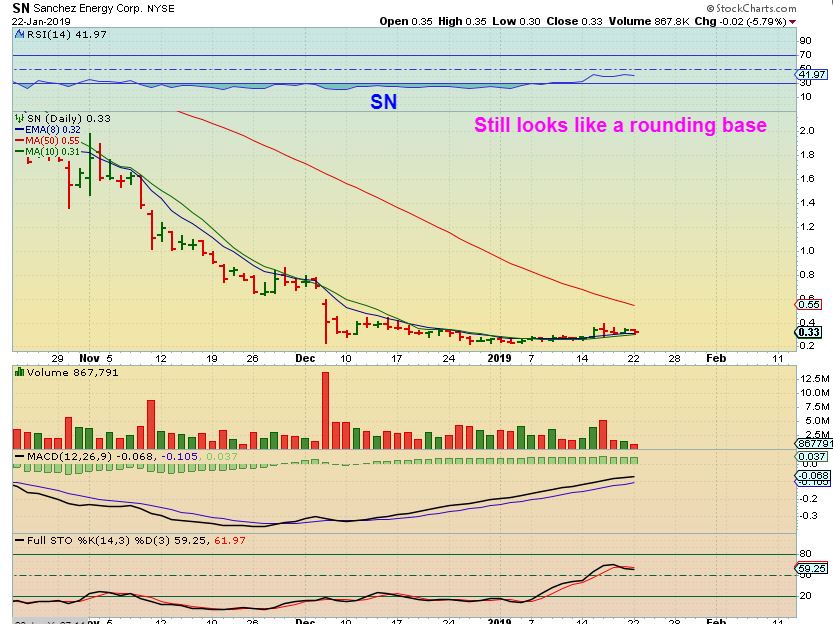
SN – Monday it popped 22%! The volume doubled and this looks ready to break right through the 50sma . THAT is a buy for ‘traders’ and could lead to explosive %- Gains in the short term. This is a buy for traders.
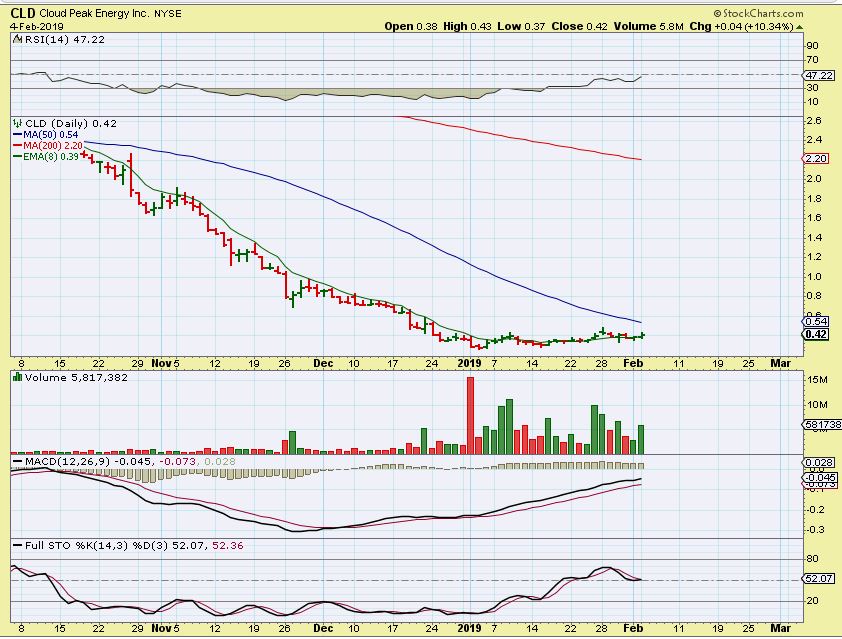
CLD – Here is one for the watch list, but it really looks like it could break out higher at any time. Look at the volume pattern as it bases out.
.
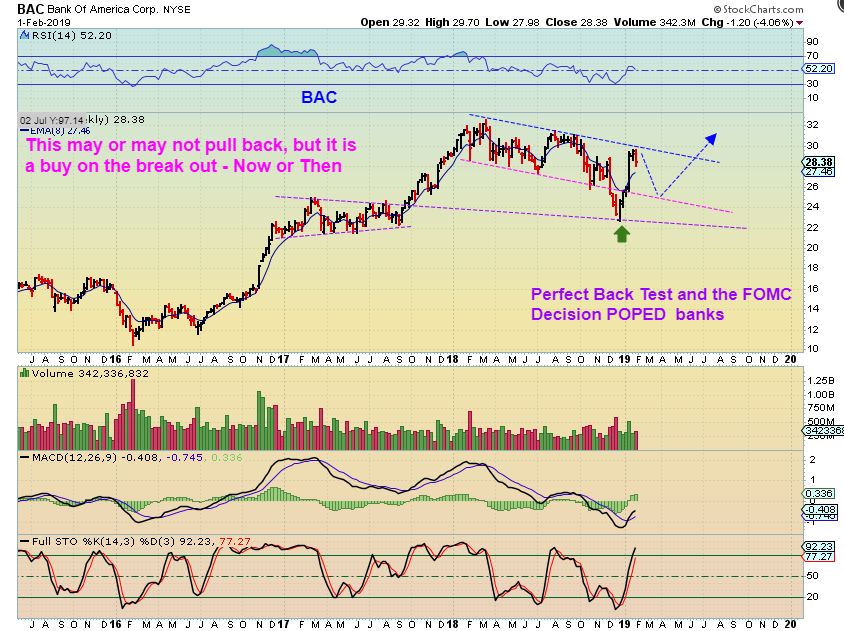
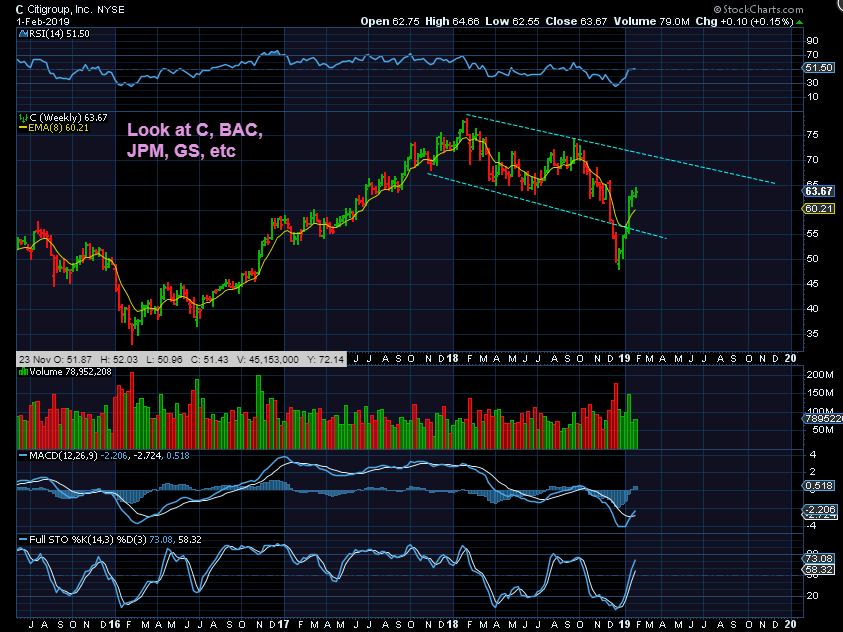
BANKS BANKS BANKS- Look at BAC, C, JPM, GS, etc
.
BAC – BANK OF AMERICA & BANKS in general are acting bullishly, even after the FEDS NO RATE HIKE DECISION. I thought that rate hikes would be bullish for banks, but BAC dropped and back tested the 2017 break out, and rallied higher quickly. Let’s look at more…
C – This is a V-Bottom recovery in the makings here too. This was with the first daily cycle of the general markets, so these could pull back with the Markets and then RALLY AGAIN. This may be a good ‘buy that dip’.
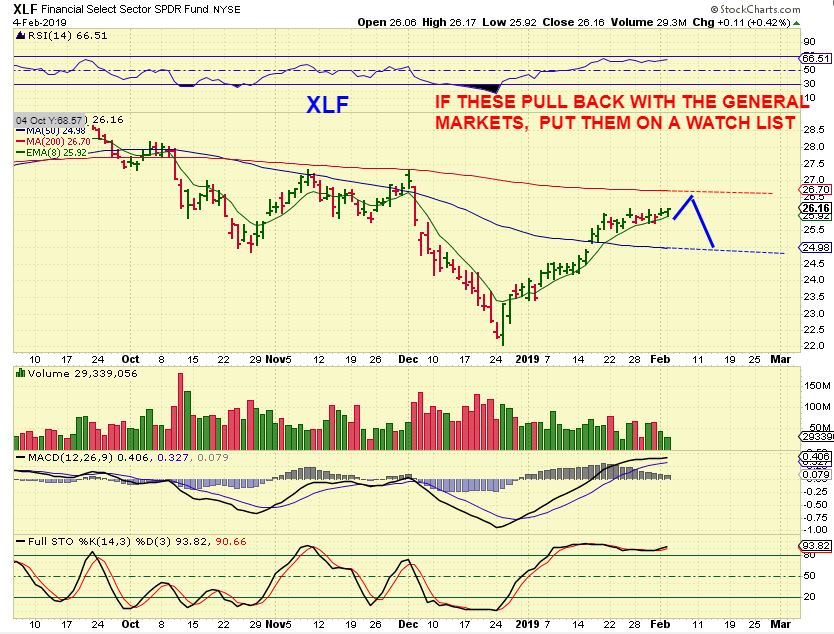
XLF – The Financial sector has performed similarly, so…
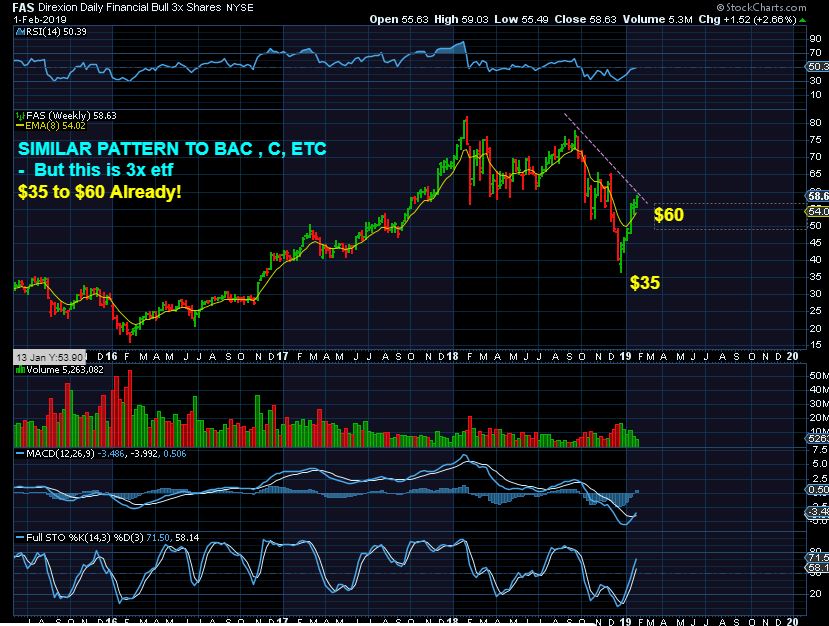
FAS – The 3x Financial Bull etf may be worth watching too, if a pull back takes place. Look at that rally, $35 to $60. When the General Markets dip, this could drop to $45 or $50 and then make another run.
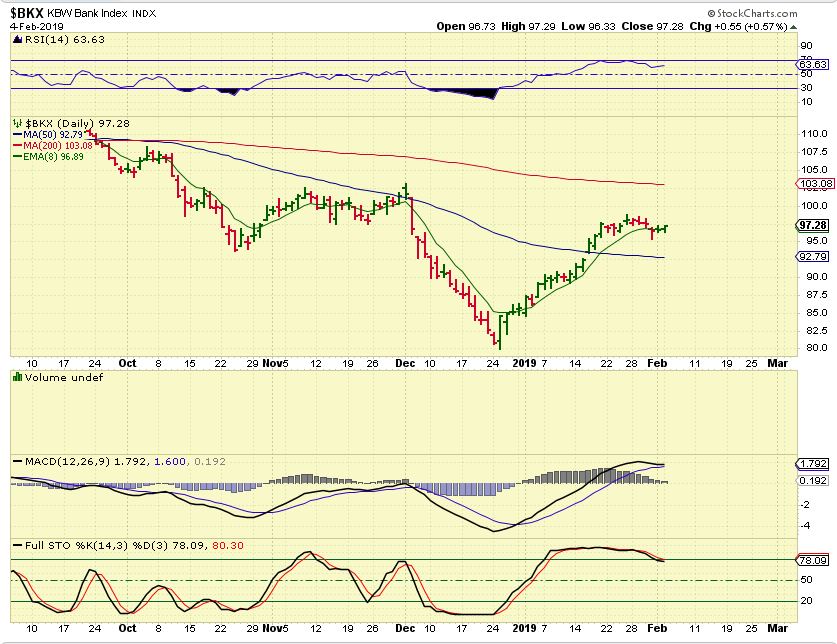
BKX – BANKS V-Bottomed and moved from $80 to almost $100 so far.
.
TWO MORE MINERS TO TAKE A LOOK AT: I GRABBED 2 CHARTS OF MINERS ON SUNDAY, SO THE FIRST ONE OF EACH DOES NOT INCLUDE MONDAYS TRADING, BUT I WANTED TO POINT OUT SOMETHING, MUCH LIKE I DID WITH THE BIG PICTURE CHARTS OF AG & CDE IN THE WEEKEND REPORT.
.
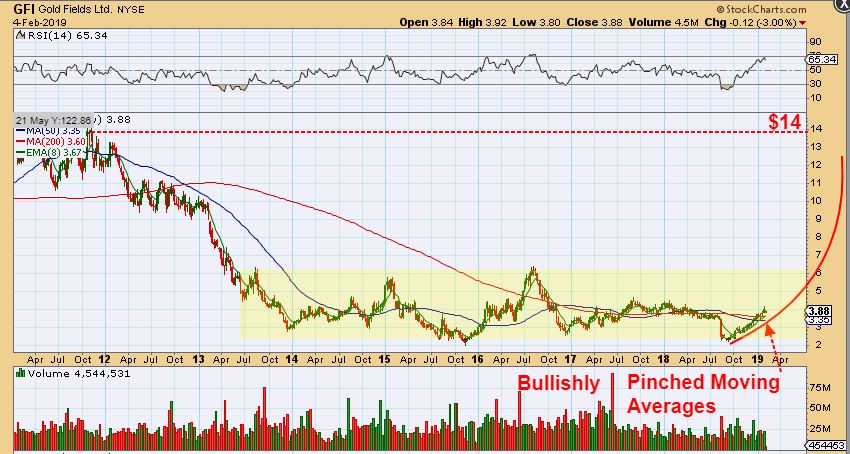
GFI – GFI broke the downtrend weeks ago and has almost doubled out of the lows from September. A 50% pull back or a back test would be a GREAT opportunity if we get one. GFI reached resistance so I’d watch for 1 of 2 things. A pull back to buy or a break out from this giant base. Building the right side of this ‘w’ pattern still offers great gains, but …
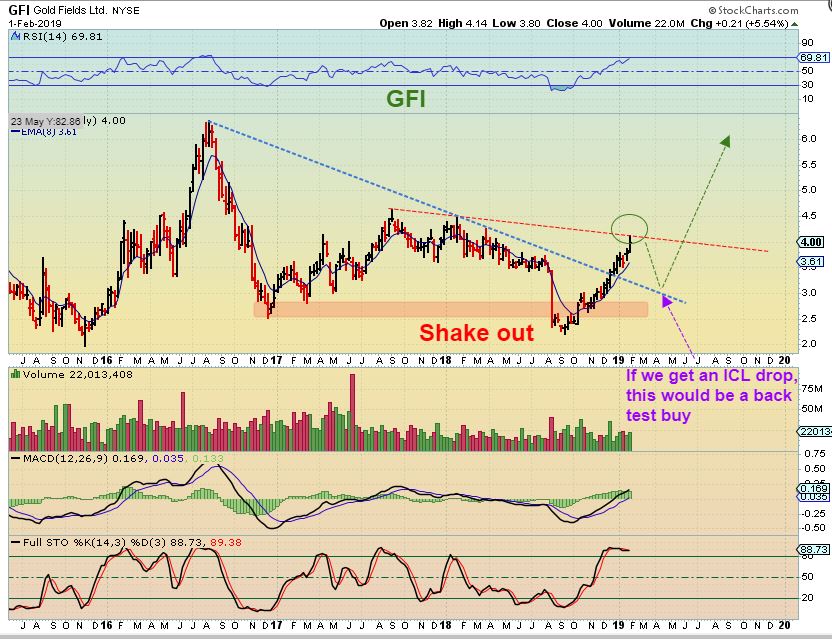
GFI – That has just been the beginning of the possibilities in this sector.
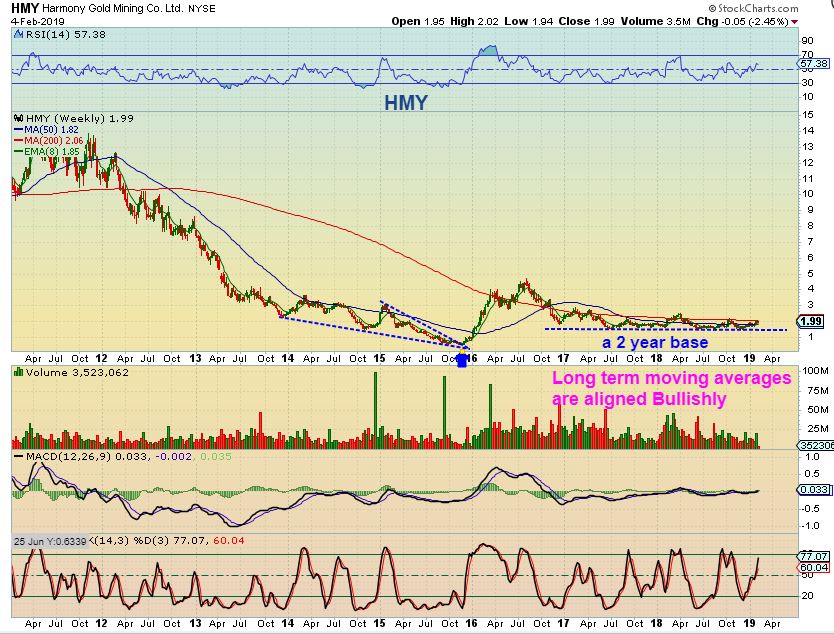
HMY – I really liked the way HMY looked in this big picture chart, and it did run from $1.50 to $2 recently, so I grabbed it this weekend, but…
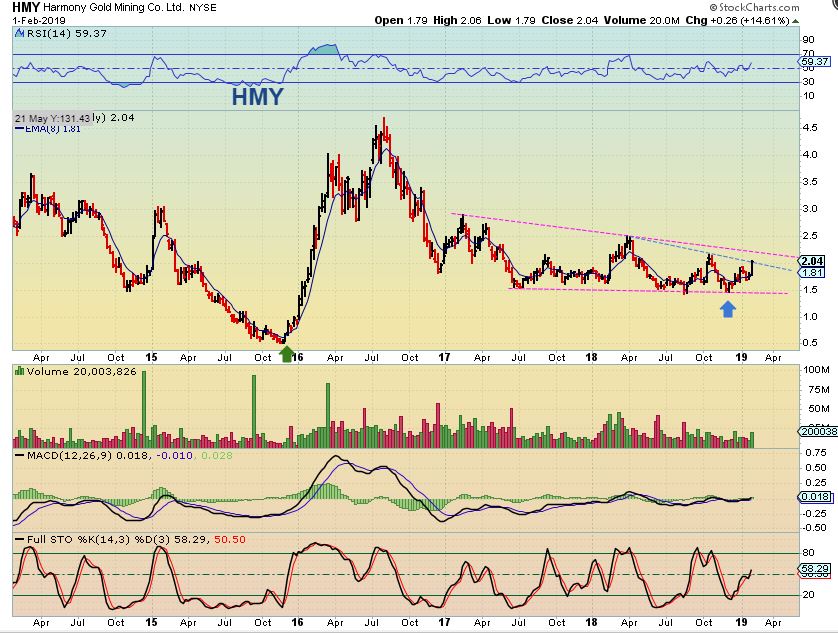
HMY BIGGER PICTURE – Isn’t this even better? It has not ‘broken down’ in 2 years, instead it has held up and formed a very long base. The potential in the Mining Sector is great. I can see this doubling, tripling, etc.