
Feb 16th Weekend Wrap
We have a lot to discuss, and I have a special section on the Precious Metals that should interest everyone here, so let’s get right into it …
.
SPX WEEKLY – The market continues to rise out of its V-Bottom. It has now broken out over the 200sma on a daily, and that means that it is above the 50 week ma. I am using red arrows to show other slam down ICLs and their recoveries.
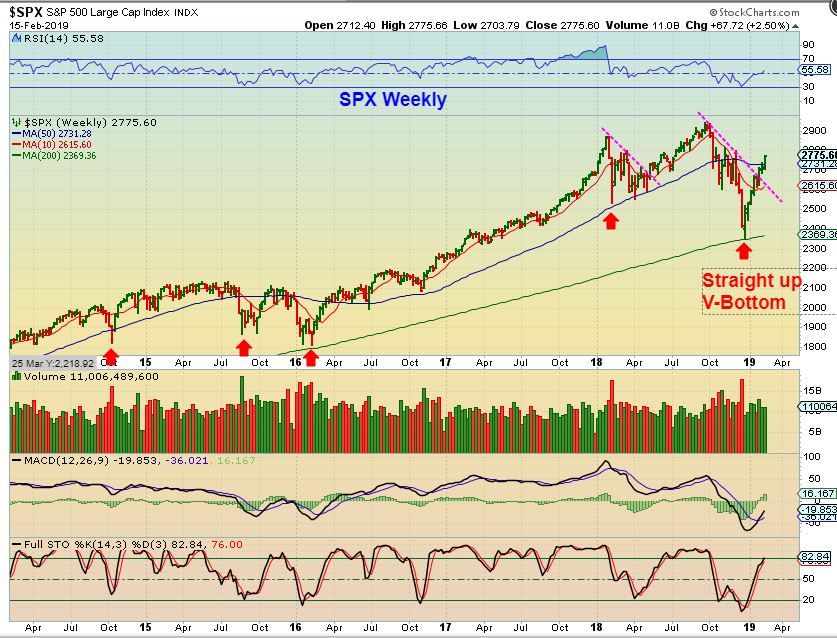
SPX WEEKLY SAME CHART – I am looking at the other recoveries and the first one on this chart is also a V-Bottom. What I simply want to point out is that even though that one just ran straight up , even to new highs, It then went sideways / choppy for a whole year and then dropped to the next ICL. Notice that all of these ICL rallies were strong out of their ICL, but then they slowed down & got choppy.
So I just want to remind everyone that I have said that we will watch the first 2 daily cycles out of the low, and then look for clues. Those rallied out of an ICL are usually very Bullish & they change sentiment from that dreadful bearish sell off negativity, to now making everyone Bullish again . This is still the first daily cycle.
.
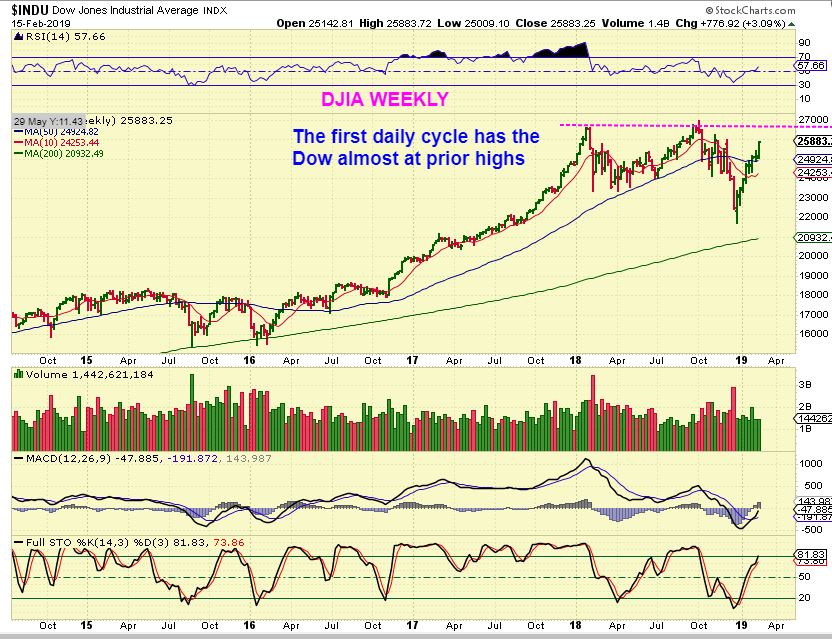
DJIA WEEKLY– This is interesting. The DOW is almost back at the highs. It could get there as soon as next week if the next week was as big as this past week ( We are missing Monday trading in the US, due to a holiday though). Again though, notice that prior rallies out of the ICL ran to the top also and went sideways. The first 2 daily cycles out of an ICL can be very bullish, then we will look for clues. AND…
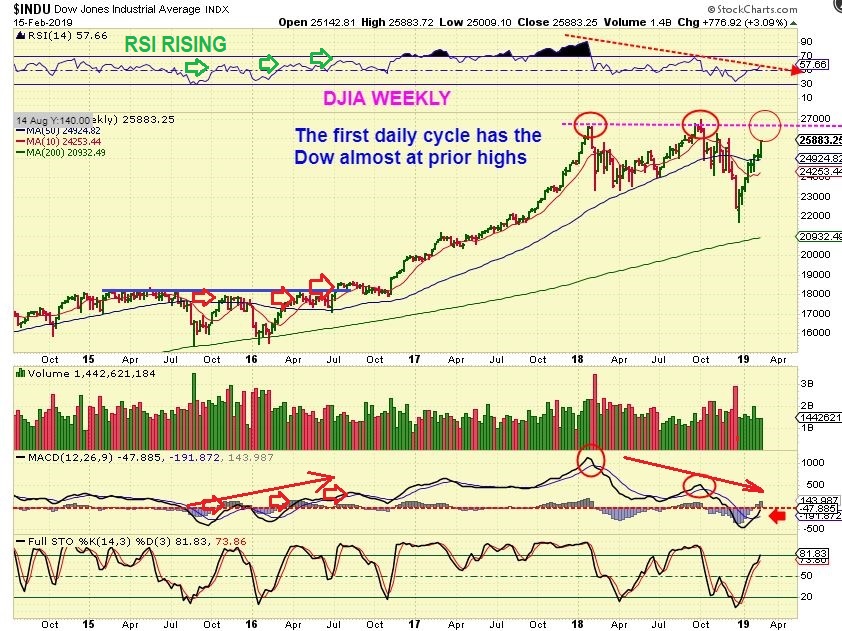
DJIA WEEKLY – As we get to the prior ‘peaks’, look at the RSI. The ICLs of 2015 & 2016 showed relative Strength on each push higher. This recent run shows ‘relative weakness’. I hear the Bulls screaming that the “BULL IS BACK BABY! ALL IN “- That RSI seems weak for such a massive run. We will look for more clues at time goes forward.
.
I have been fairly focused on Oil / Energy for a while, discussing GUSH, OILU, XLE, XOP, PDS, OAS, WTI, DNR , and other energy plays, since Oil bottomed in December. It then got choppy at the 50sma, lets take a look…
.
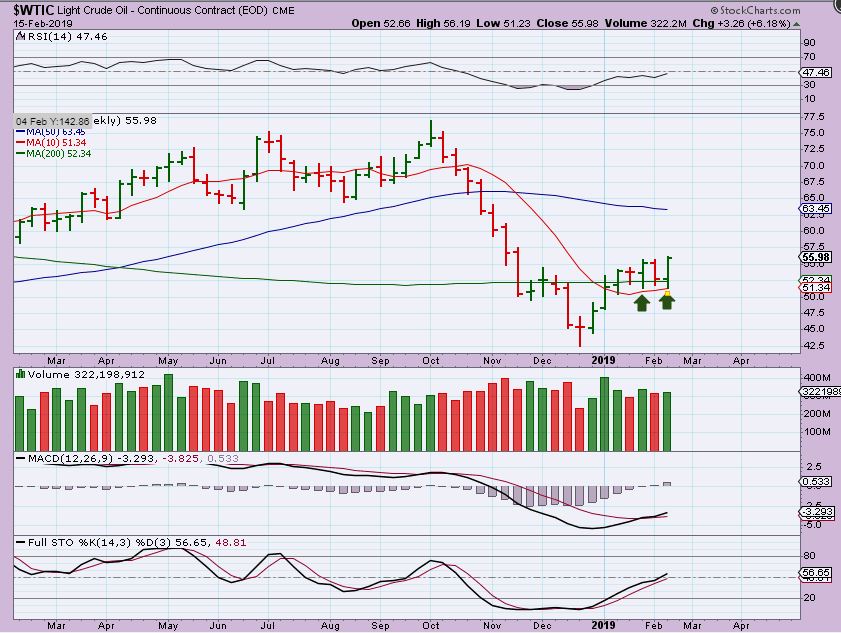
WTIC DAILY – First we had our rally out of the ICL, then it got choppy at the 50 sma, and after a back test, I started thinking that instead of being at a 1/2 cycle low ( with a 50 day Daily cycle coming our way), we may have a dcl here after 30+ days. Oil Moved higher by almost 3% Friday. We may be coming out of a dcl as day 4 here. Even if it was a 1/2 cycle low, I said that you can ‘Buy” either one, I expect a tag of the 200sma as likely.
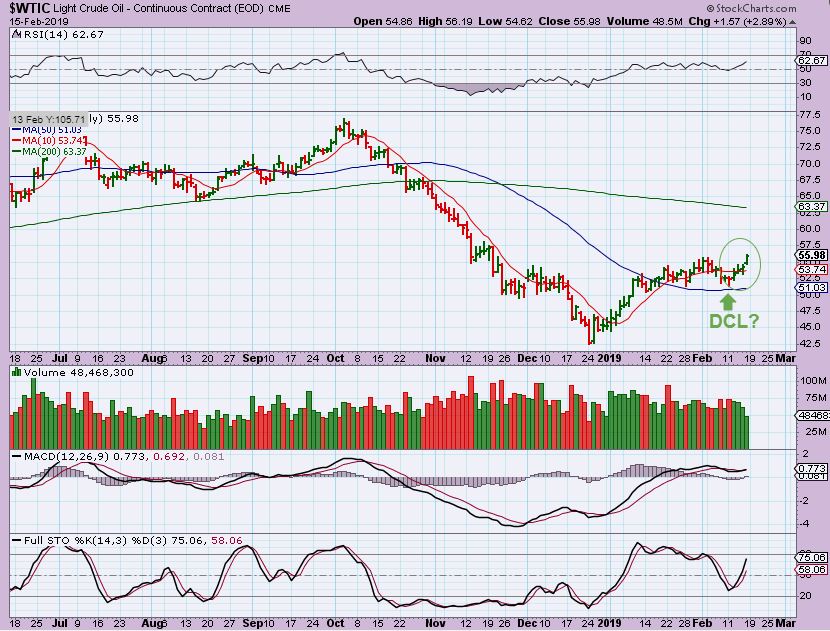
WTIC WEEKLY – The weekly chart actually now looks even more bullish after this weeks push higher. It reversed right on the 10 weekly ma, and energy stocks are starting to run again now too.
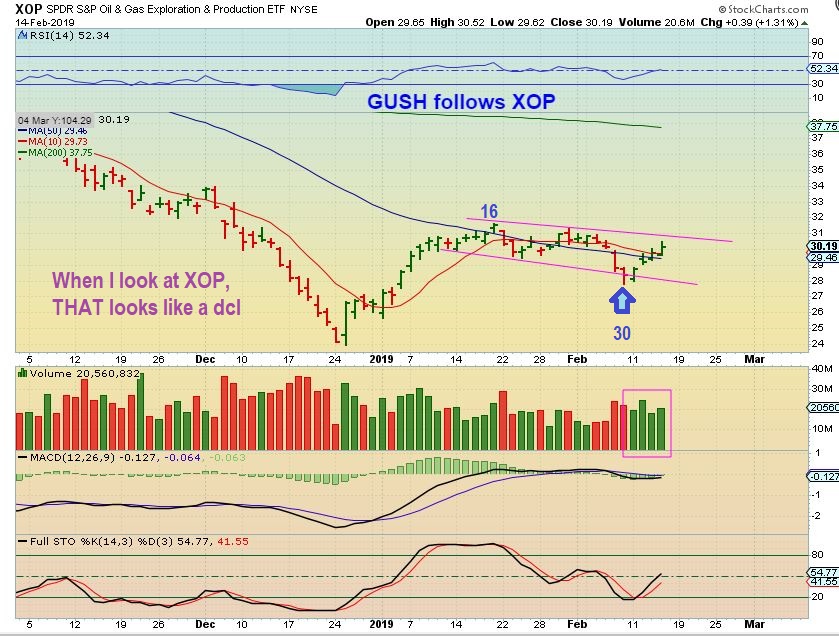
XOP – I put this chart in Fridays report , showing that the XOP looked like a DCL.
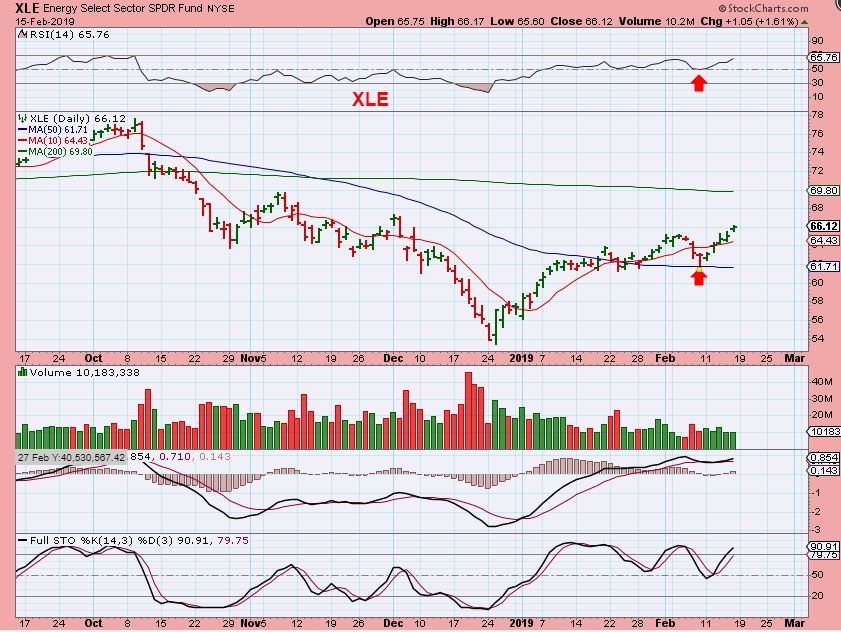
XLE DAILY – The Oil & Energy sector moved steadily higher this week.
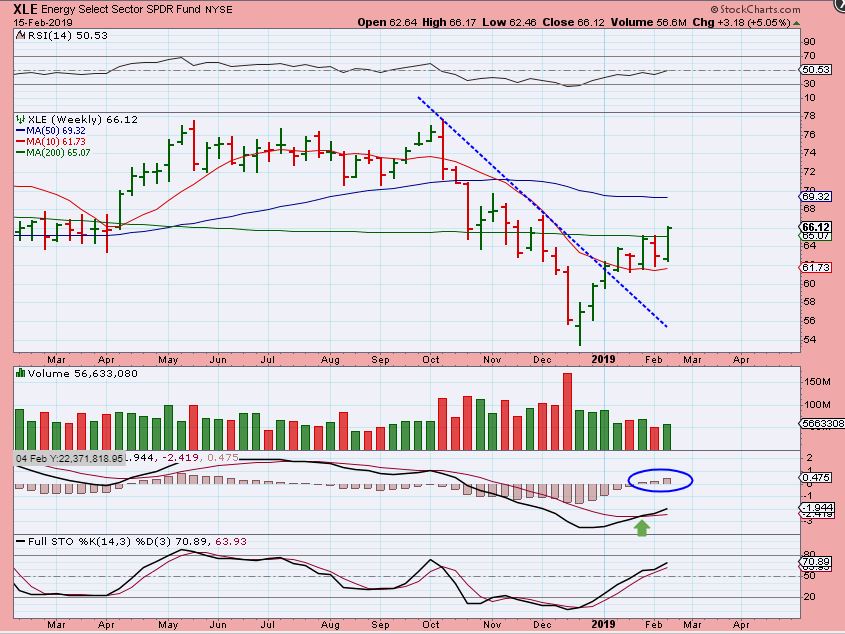
XLE WEEKLY – The XLE reversed off of the 10 week MA and broke above the 200 week ma, which was resistance for 2 weeks. The chart is Bullish.
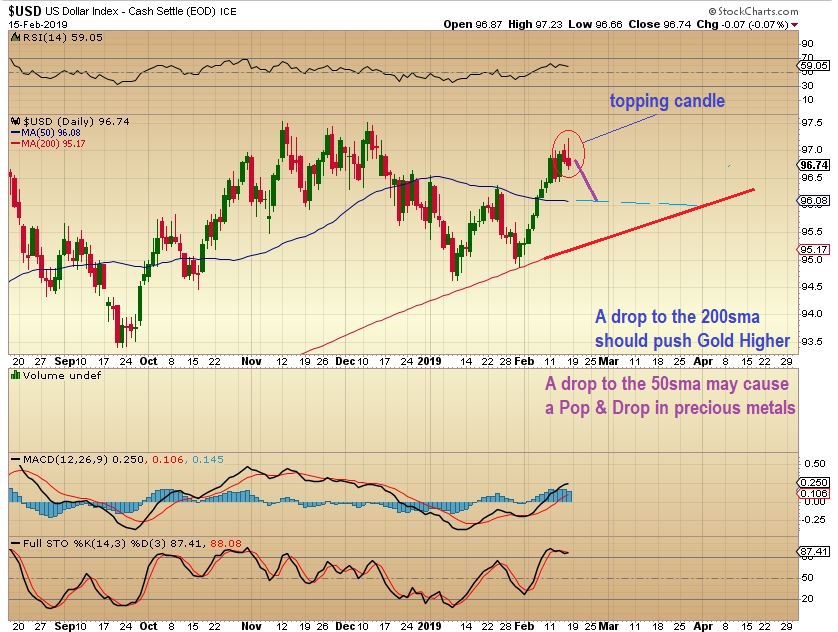
USD DAILY – If the USD has a daily topping candle and drops to the 50 or 200sma, that often gives the Precious Metals a push higher. Read the chart.
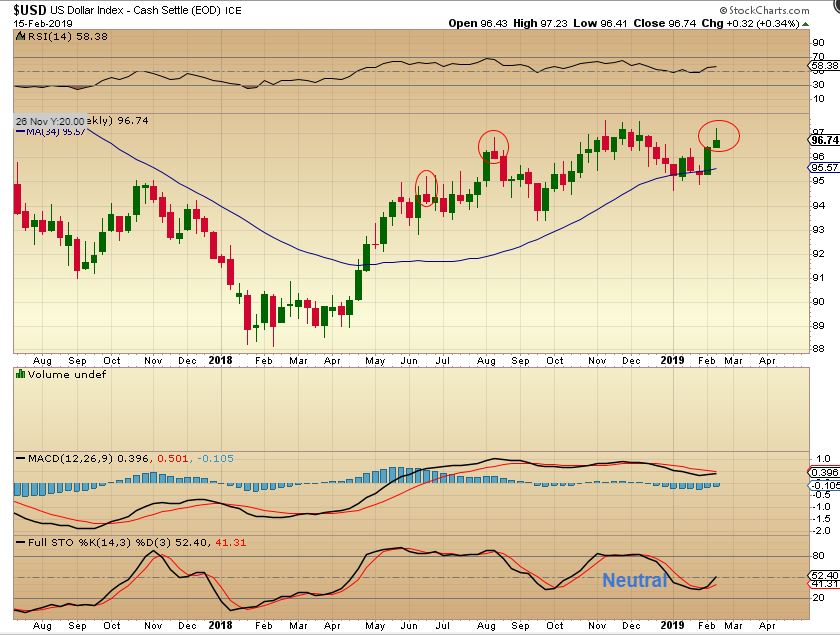
USD WEEKLY – A weekly reversal candle appeared too. Precious Metals turned higher Friday and I exited my small starter position ‘short’. I will explain that trade later, and additional thoughts on the precious metals.
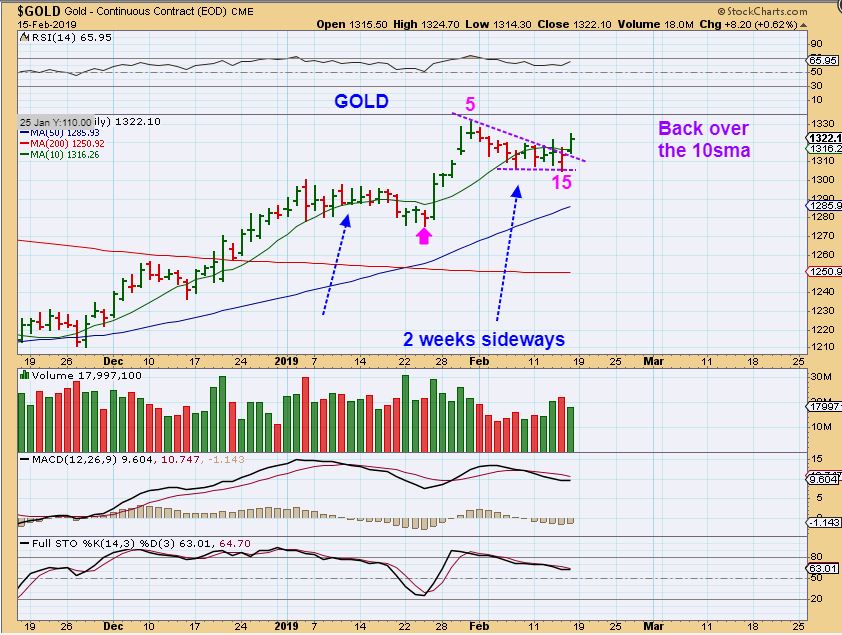
GOLD DAILY – And here GOLD, which basically went sideways & dropped for the past 2 weeks broke the daily downtrend & closed above the 10sma. That is viewed as bullish.
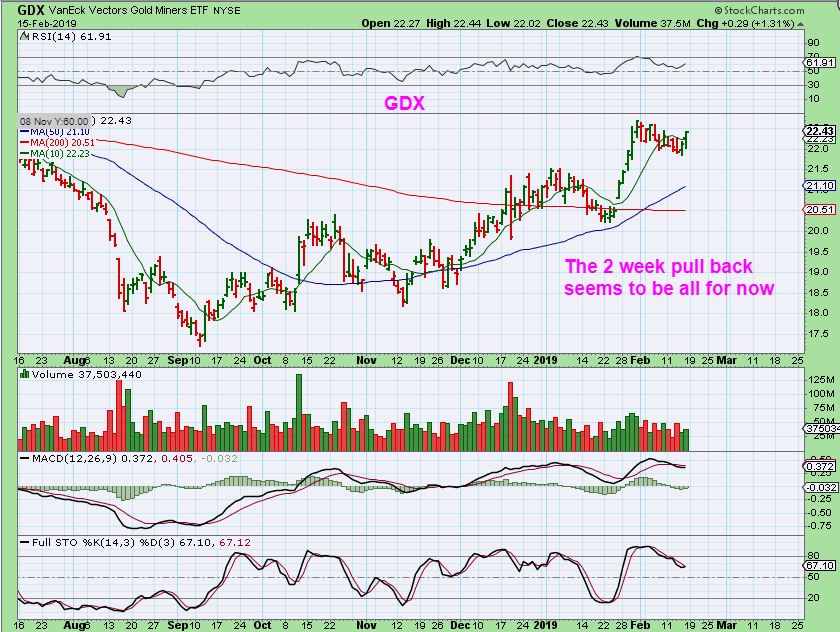
GDX DAILY – GDX slowly dropped for 2 weeks. I started a small short position in GDX / GDXJ when price closed 3 times under the 10sma. It flipped above the 10sma, so that stops my short out, BECAUSE GDX has been overall bullish. This can just run higher and with the USD looking short term toppy. You can actually quickly flip from SHORT to LONG after this consolidation too.
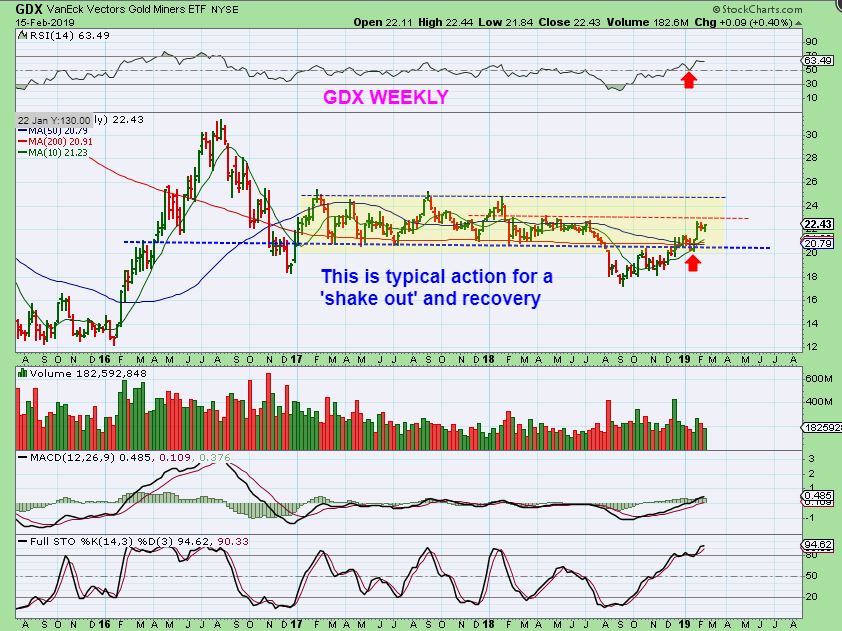
GDX WEEKLY BIG PICTURE – I have mentioned that this is a very bullish chart. We COULD run to the upper yellow area now, and then drop down from there. As I have said in each weekend big picture report, overall this looks very bullish for MINERS in 2019. This was a ‘shake out’ & recovery. Technical traders see that and buy the dips. This current 2 week drop was just a bull flag as seen here. If you ‘buy the dip’, that 2 week mini drop appears to be it for now.
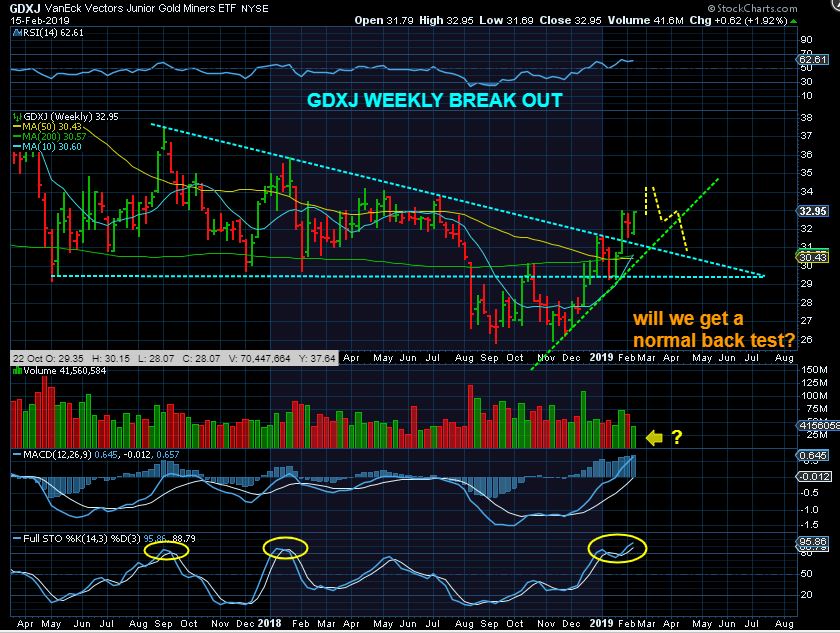
GDXJ WEEKLY – I do see volume lower than I would expect, but the chart looks Very Bullish long term.
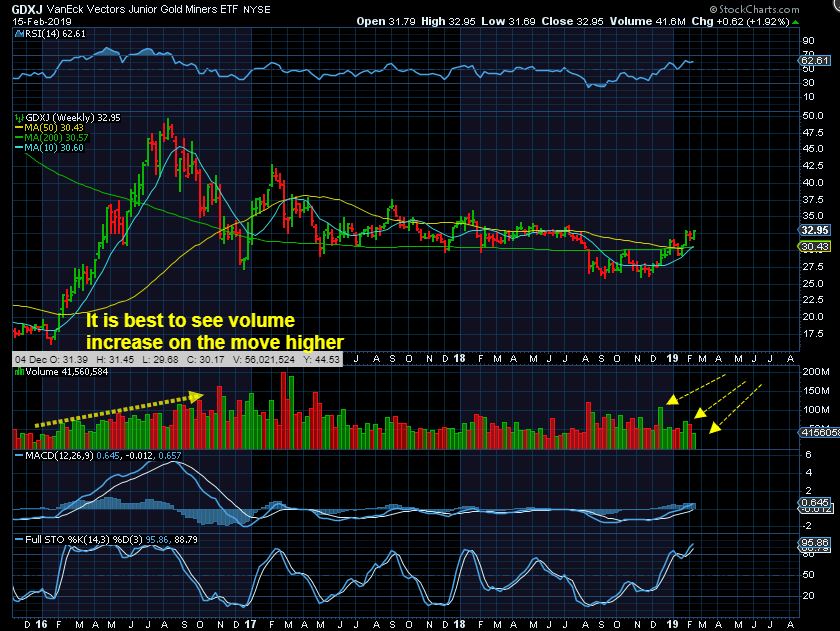
GDXJ WEEKLY – If an ICL is coming due, and Buying volume stays light, we could see a drop as a ‘back test’, and then a flood of buying may come in at that point.
THAT SAID, I have said 2 things repeatedly and it is worth repeating:
1. ” With this bull market, it is advisable to at least own some Miners, because several of these Miners have already shown us that they will do their own thing and run on their own bullishness.” And,
2. “ Start a small position to hold as a core and build on it over time. Buy them low as they consolidate or break from a base, and add on the dips to a DCL, and go heavier at an ICL.”
I also have been showing charts of AU, KL, AEM, BTG, and recently I added KGC, SBGL & even TRX as newer possible leaders that have been holding up well. When holding a core position, I still would use reasonable stops.
.
Let me quickly explain my short trade last week, an why I am now out
.
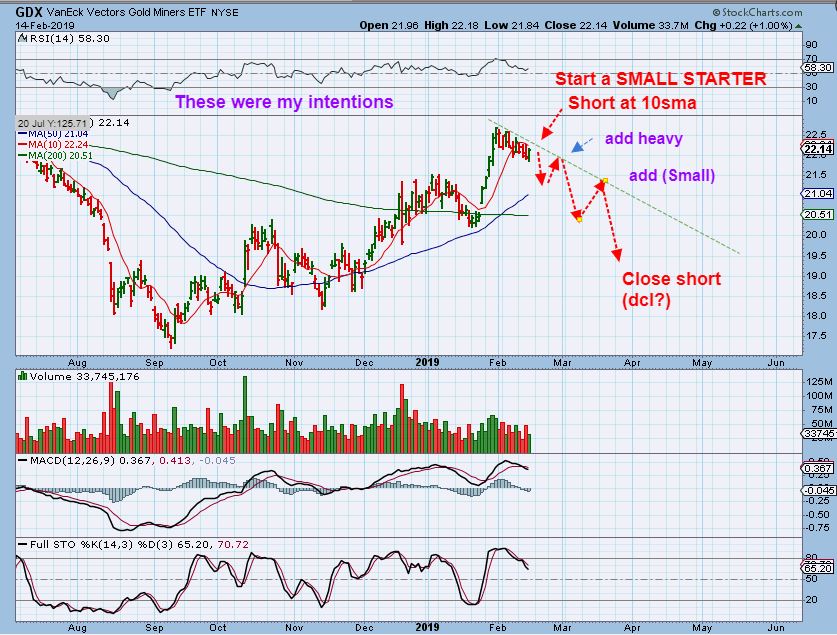
THE GDX SHORT – Expecting that this daily cycle was left translated and had ‘peaked’ on day 6, I saw GDX struggle under the 10sma. It could NOT get back above, it closed under the 10sma day after day around day 16. AS A TRADER, I took the ‘short’ with the 10sma as my stop, expecting a drop to a dcl. I said that I started a SMALL STARTER position to be safe. Below is a chart of how I would build on it as it proved itself if the drop continued. See the chart, this was the plan. And then…
.
THEN SUDDENLY HE SHOWS UP AGAIN , AND KICKS ME OFF. Well, that happens when I try to short a bull, even under what look to be ‘weakening’ conditions. They say, “Never short a Bull Market”, for a reason, don’t they? 🙂
.
If price trapped under the 10 sma got me into the trade, a bullish move above the 10 sma knocks me out. A nimble trader will actually flip Long and see if this continues higher.
.
I will discuss a few more things below in a lengthy Precious Metals Special, enjoy your ( 3 day in the US) Weekend !
.
~ALEX
.
PRECIOUS METALS UPDATE: NOTHING HAS CHANGED IN THE BIG PICTURE VIEW- PRECIOUS METALS REMAIN BULLISH LOOKING, BUT COULD THINGS ACCELERATE GOING FORWARD? LET’S DISCUSS WHY I THINK THAT THEY COULD. I WANT TO SHARE AN IDEA THAT I MENTIONED IN THE PAST, WITH UPDATED INFORMATION
.
From this chart it is easy to see that THIS CURRENT CHOPPY MOVE HIGHER since The September lows is nothing like the STRAIGHT UP RUN in 2016, right? It has chopped sideways and higher. Look at the run in 2016, and then look at this one. HOWEVER, I AM THINKING OF SOMETHING IMPORTANT THAT I WANT TO SHARE …
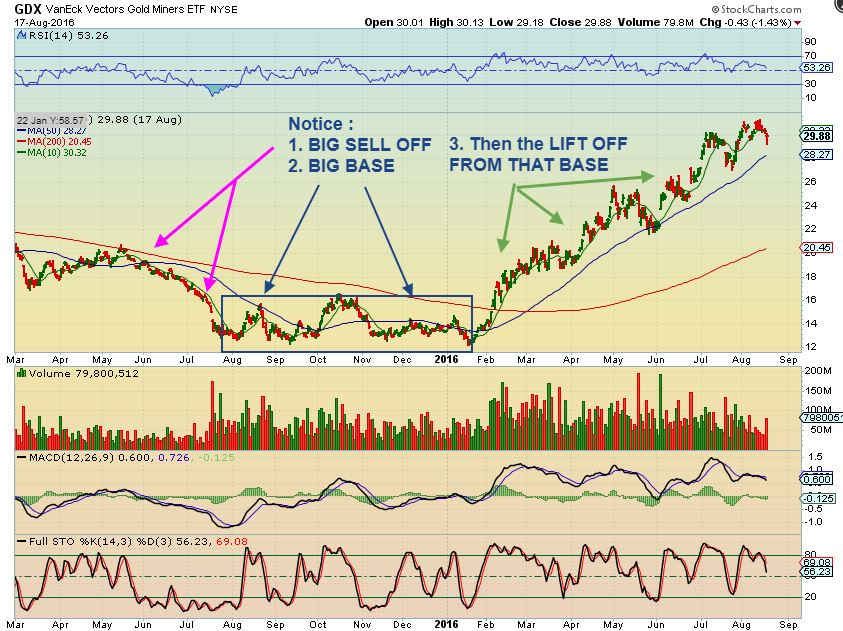
#1 – GOING BACK TO 2016 in MINERS: I mentioned this before in past reports. We had the sharp sharp sell off, a long multi-month Base, and then the Miners just ramped up higher.
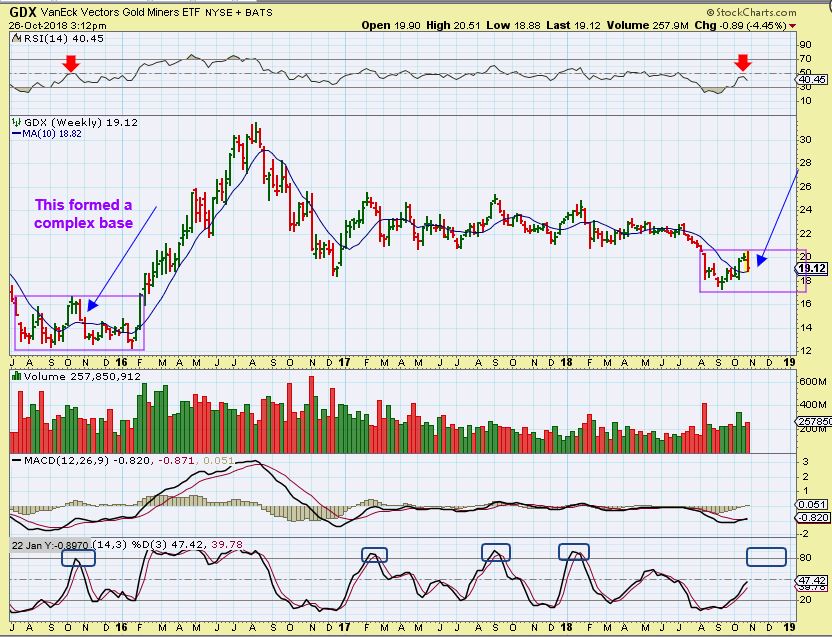
#2 – IN OCTOBER 2018 I COMPARED THE GDX 2016 BASE WITH THE CURRENT ONE THAT WAS FORMING: You may recall that I was watching for a drop and similar ‘complex base formation‘ as 2016 & then we may look for a ramp up.
#3 – GDX CURRENTLY VS 2016: What I am thinking of now is this current observation. We DO have a BASE formation, only this one is slightly different. Do You See It? The SAME result could come from the exit of this base, which seems to have started. My thinking is still that this is very Bullish. Read the Chart for the Sell Off, Base, and Ramp Up similarity…
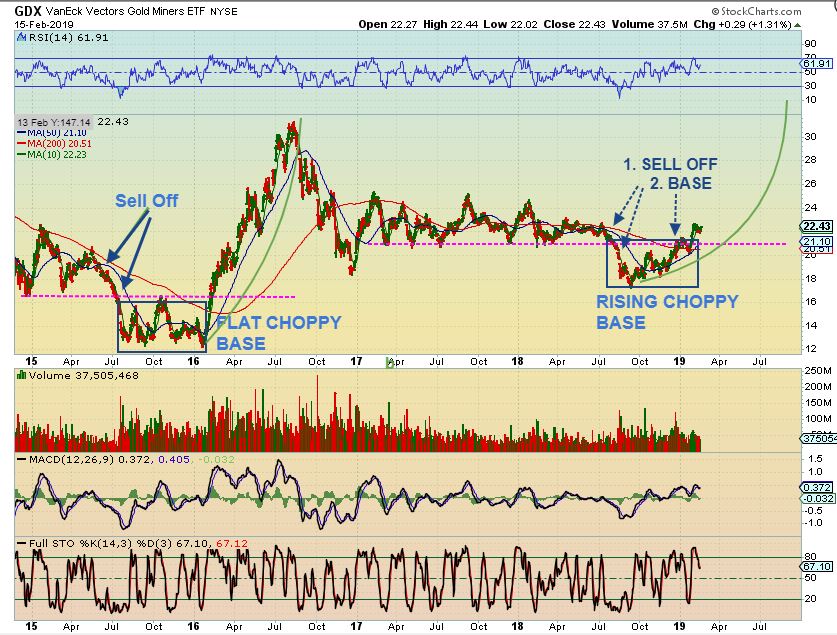
#4 – It was after Price broke from the Base in 2016, that it started that extreme ramp up (Green Line) . We just broke from the recent base. If we were to get that kind of a move going forward, I feel that it may help to examine 2016 a little closer. What were daily cycles like then? I will do that after 1 more chart.
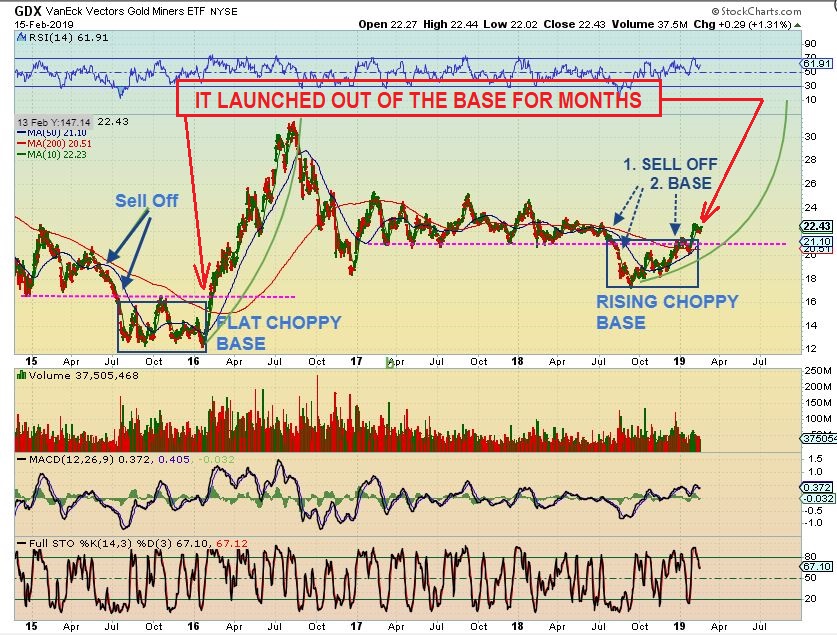
#5 – Recently I mentioned that in Technical Analysis, when you see a “Shake out & Recovery”, the recovery usually doesn’t fail again, so I wondered if a dip to a dcl or ICL would be more sideways & choppy / lower. It does currently feel that BUYERS of the dips are waiting and accumulating. Could this still turn into that 2016 straight up kind of a run? Maybe. We just can’t know that for sure, but right now the GDX is trudging along higher since September and several Miners are doing even better. GDX POPPED from that base when the shake out recovered 2 weeks ago, so …
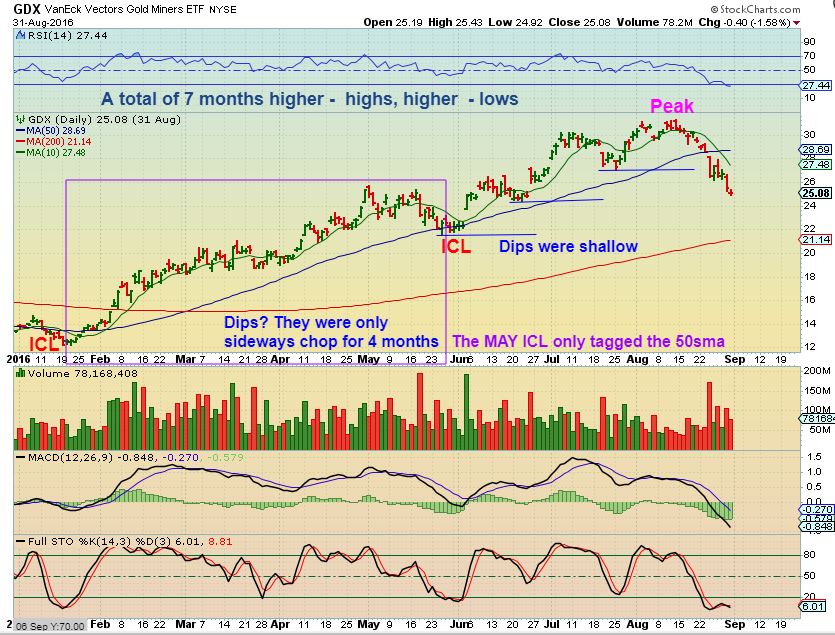
#6 – I want to take a moment to show you how DCLs and ICLs looked in that Super Bullish 2016 Run.
Where are the deep dips? I barely see the dips in Jan through the peak in April, it was more or less choppy & higher. We even got a rather shallow ICL in May ( It did break the uptrend for sure, which is what ICLs do), and then it ran to that 2nd Intermediate Cycles peak 2.5 months later in August. Conclusion? …
.
Conclusion? NOTHING HAS CHANGED IN THE BIG PICTURE, BUT THINGS COULD ACCELERATE NOW OR AFTER A BACK TEST ( AN ICL COULD BE THAT BACK TEST) , SO WE REMAIN WATCHFUL. CAN WE STILL GET AN ICL DROP IN MARCH? YES. But in 2016, the dips were shallow for months. The dips may be shallow and things may be choppy, but you really might want to consider at least starting a core position if you find yourself without Miners and wanting to own some. I will discuss some Miners below again, to possibly help in that area, and will discuss them along the way in future reports too. AGAIN, COULD WE STILL GET A DEEPER TYPE ICL IN MARCH AFTER A BRIEF RUN HIGHER NOW? Yes, and I drew this chart as a real possibility, so hold a comfortable basket just in case and use stops on extended Miners, add on dips.
.
.
SO LET’s DISCUSS A FEW MINERS AGAIN AS AN UPDATE
.
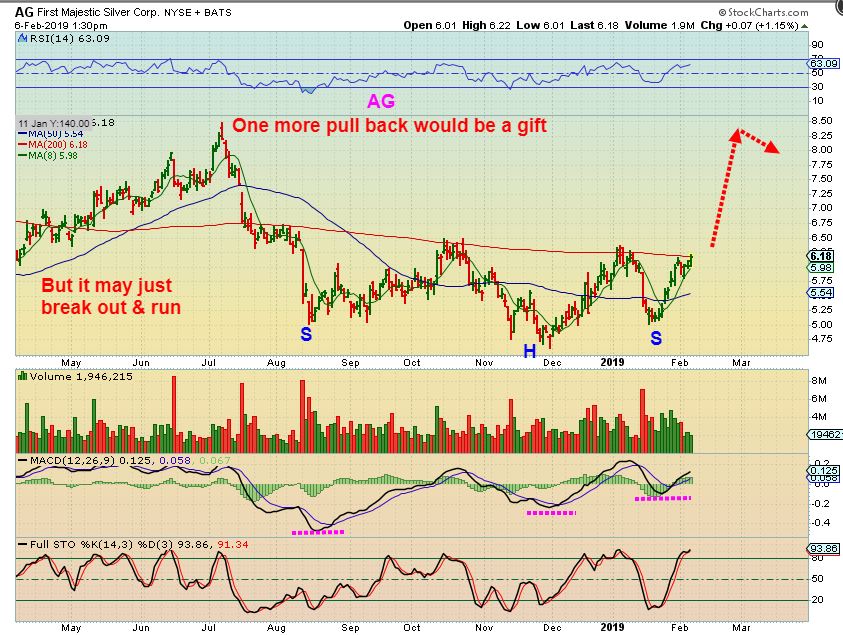
AG -On Feb 6 I drew this & a similar chart of CDE for you. Buy the break out if it goes higher, but a pull back would be a gift.
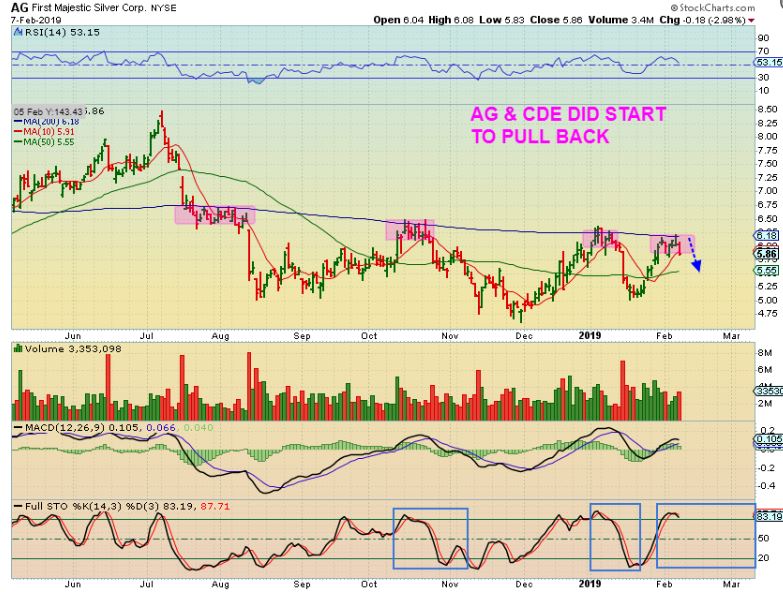
AG – Then it started pulling back the next day, and I thought that we could be heading for the dcl, so I drew this.
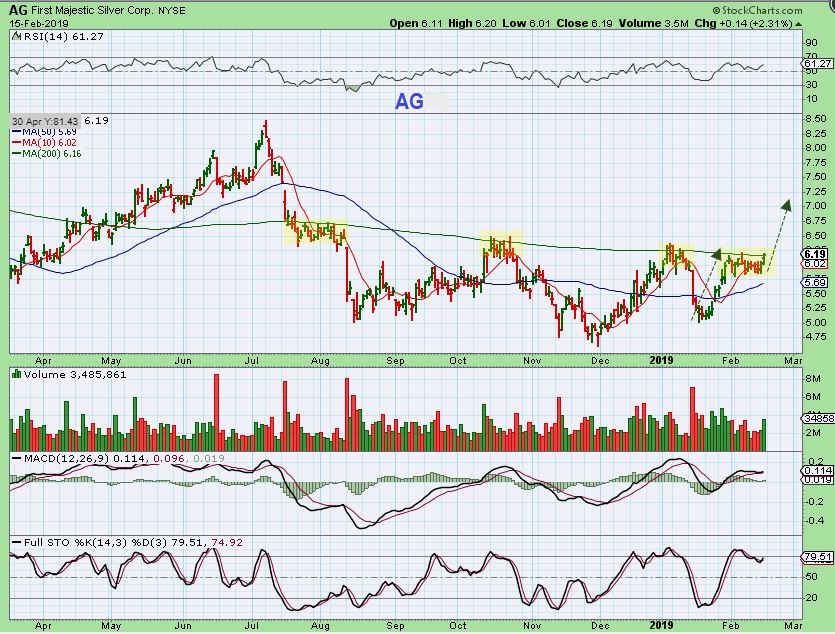
AG NOW – It has gone sideways for 2 weeks. Is it time to break out now? Based on what I wrote above about GDX, we want to keep an eye on many of these beautiful Silver Stock Set ups. MAG & AXU have also begun to run. I actually own a core position in AG during this sideways move, but it is not the full position that I hoped to own at the next dcl or after earnings release next week. I was going to re-post this as a BUY at that time, but it may be breaking out now.
AG – And don’t forget this chart from JANUARY 31, right? I said that I want to own AG, and in light of what I just said above about GDX now vs the 2016 Run, this becomes an important chart.
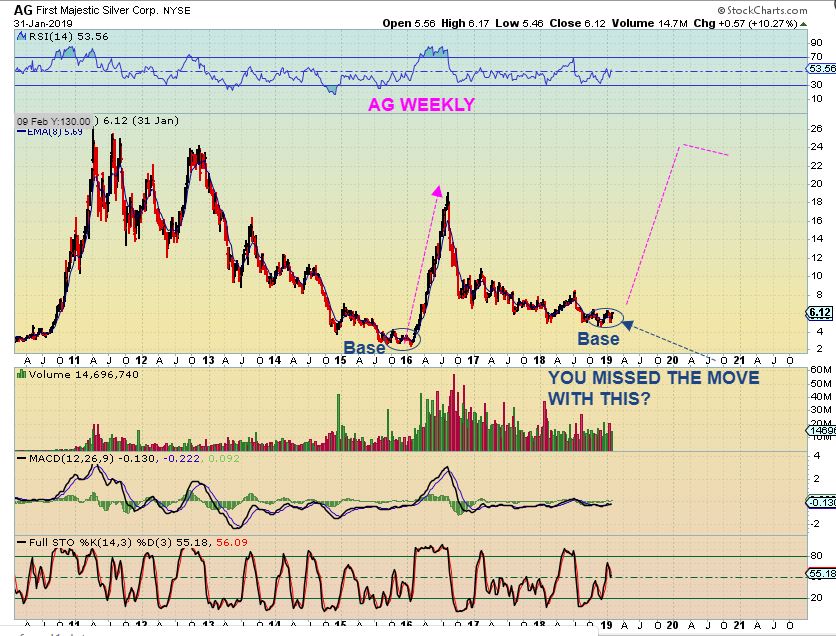
Note: The Company’s fourth quarter and full year 2018 financial results are scheduled to be released on February 25, 2019. Buy now or wait, that is up to you. Add now or wait for earnings? I haven’t decided what I want to do, but it is a coin toss and not any special insights if I do.
.
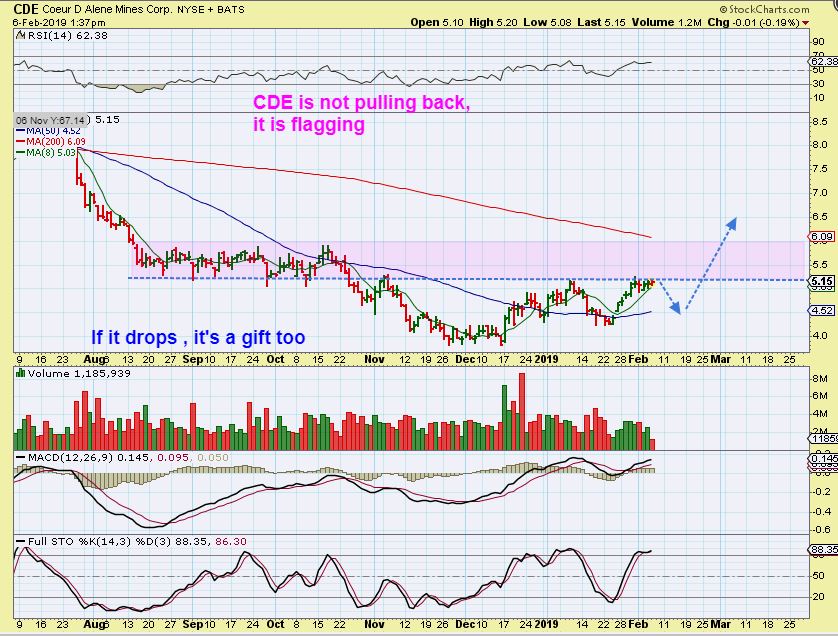
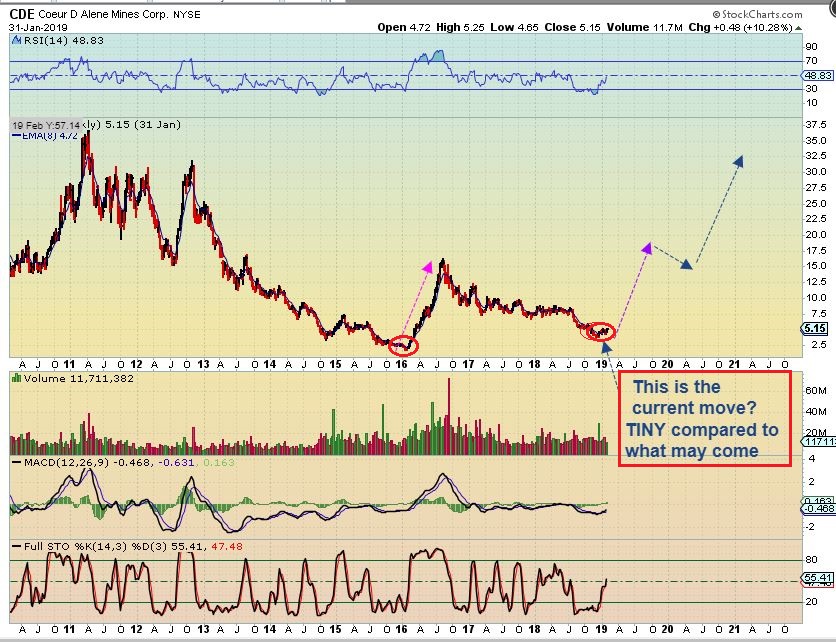
CDE – I posted this Feb 6 chart showing the same idea. I said that if this dropped into a dcl, I wanted to own it. I did not buy this one yet…
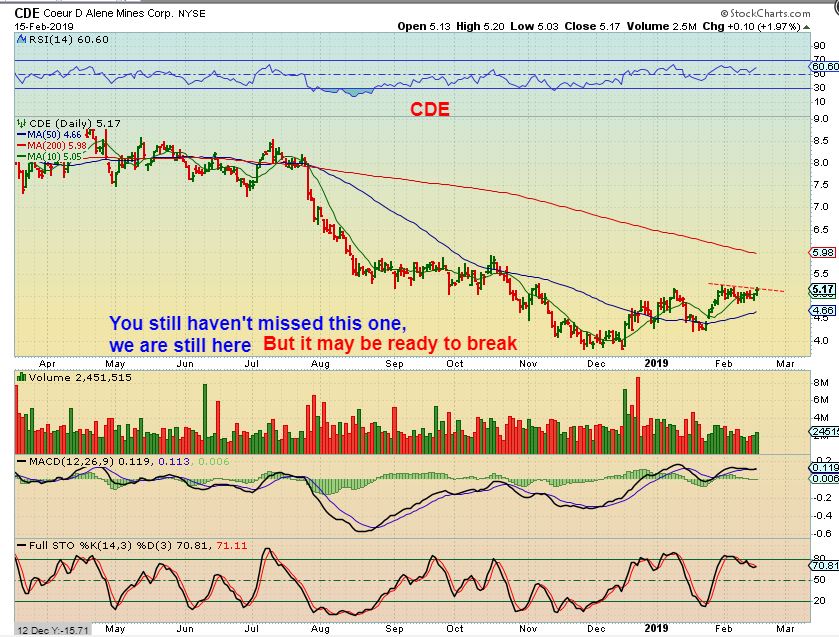
CDE – This is CDE now, and it looks ready to break out. MAG & AXU broke out, so if this breaks out here next week, I would view it as a buy. It could run tot he 200 sma, and MAYBE back test the 50sma as a dcl later, but in 2016- these just ran in a strong manner.
CDE – And my JAN 31 chart. Do you own AG or CDE yet? Look at the 2016 run. Buying here in the base was worth it then despite the wiggles, and if we are about to get a nice bull Run in Silver, it will be worth it again. A starter position is at least something to think about (BE AWARE OF EARNINGS THOUGH).
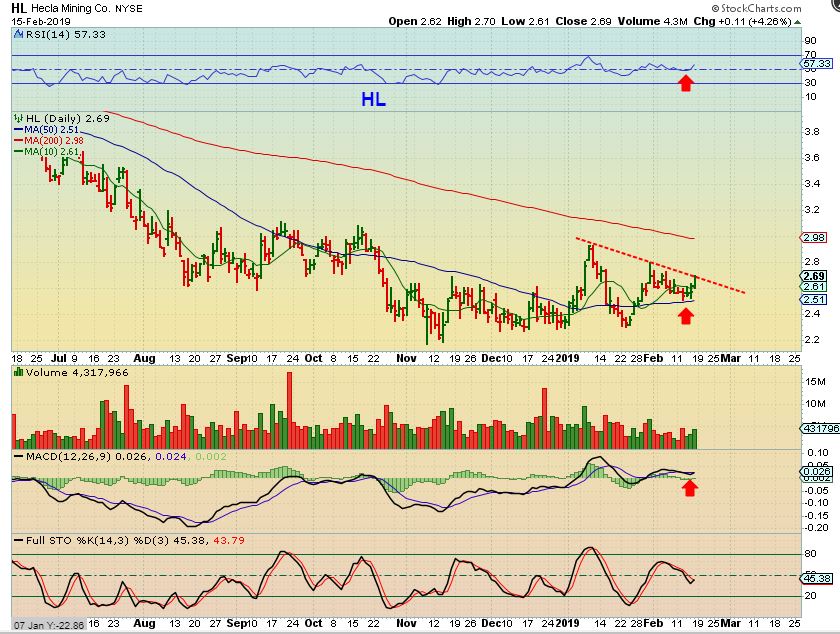
HL – HL held the 50sma and looks like it could break out too.
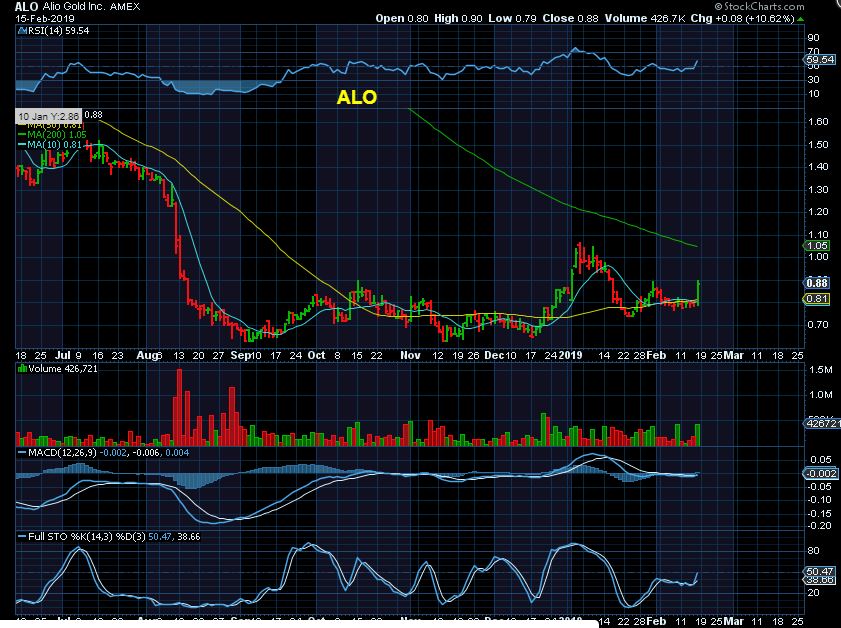
ALO – I didn’t see any news, but ALO popped over 10% Friday from a base-like bottom.
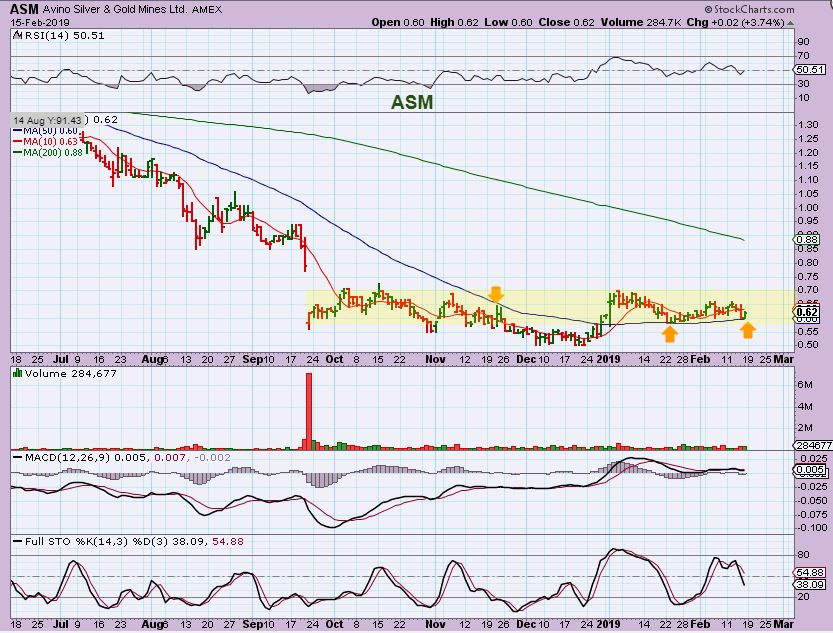
ASM – A long flat base. ASM reversed at the 50sma again. This one lacks solid buying for an upside run, but that could change at anytime. The last earnings release was Nov 7, so I expected a Feb 7 release, but that hasn’t happened.
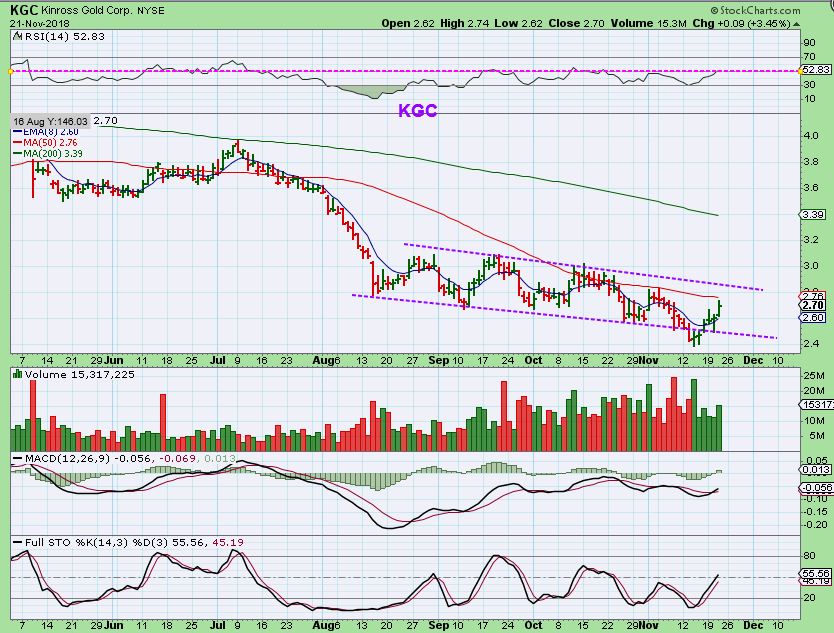
KGC – KGC was a buy way back in November when Volume started to swell off of the lows. I was thinking that it could run to the 200sma.
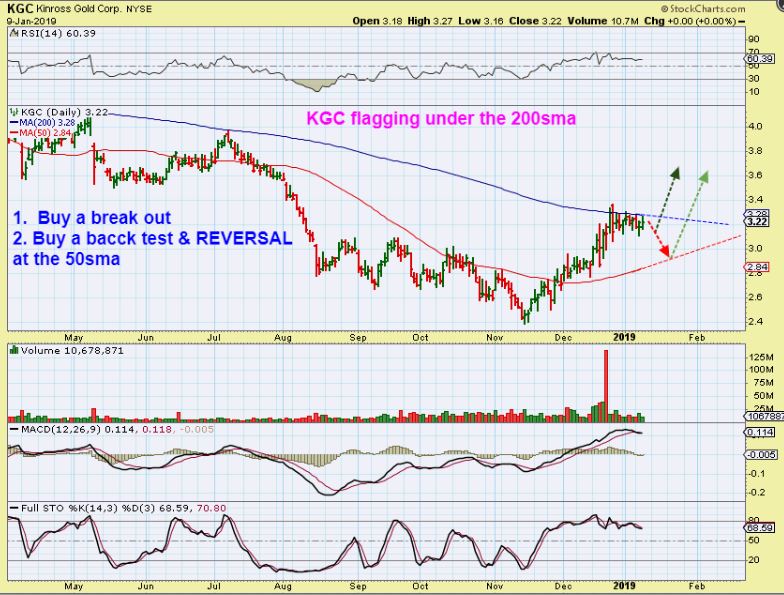
KGC- Last Month I mentioned that you could put this on your watchlist. Read the chart, Buy #1 or Buy #2 .
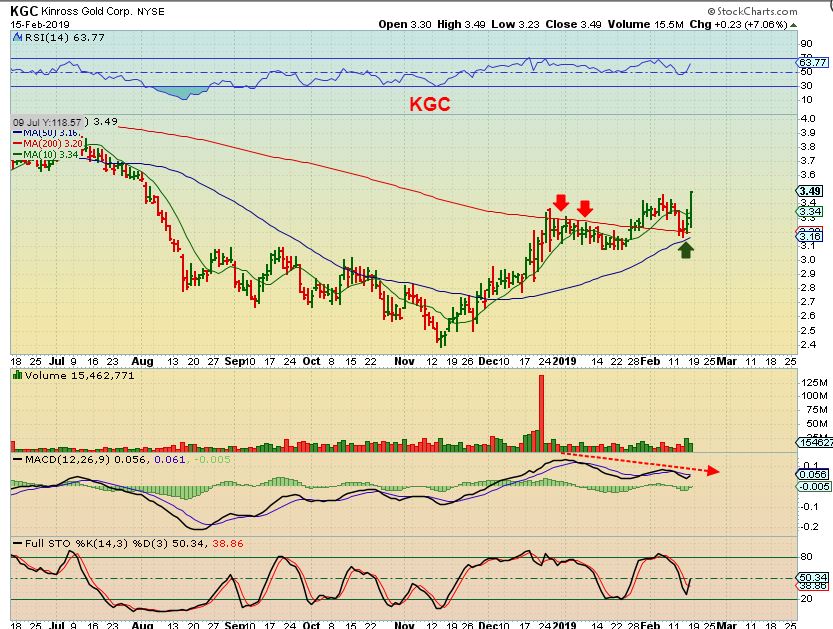
KGC – That was a boring month, BUT it did break out, it has now even back tested that 50sma & the 200sma, and that was the BUY. It is not too late to grab it here and I think it will run sooner or later, but it has been a choppy one.
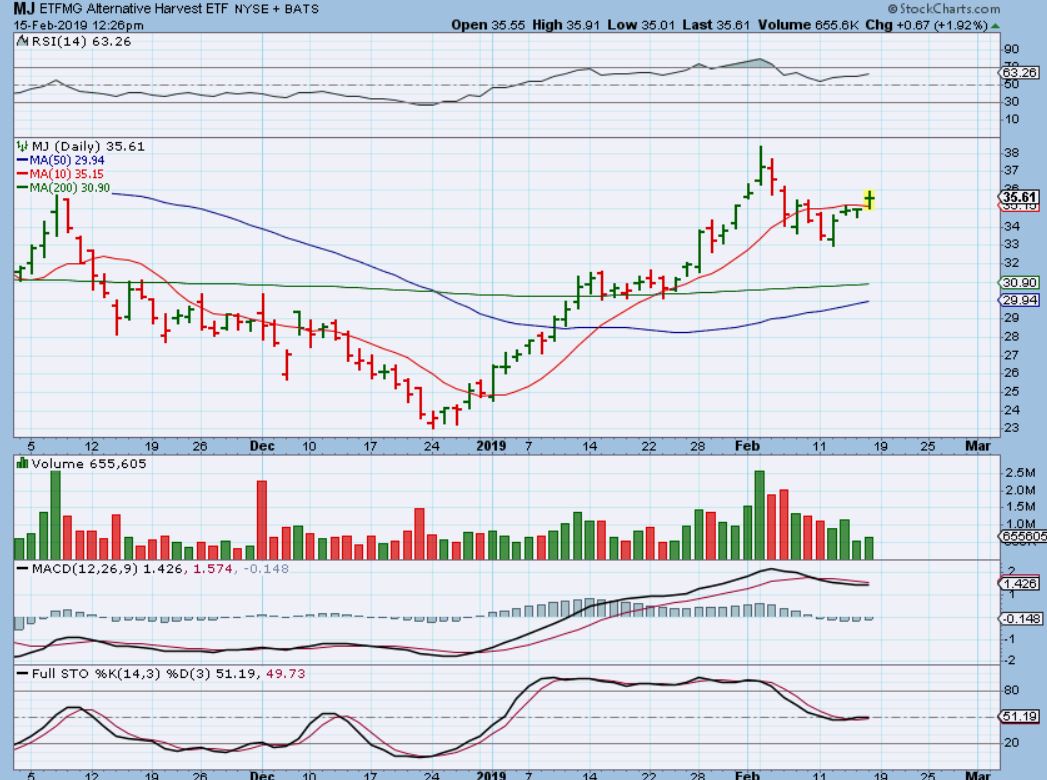
MJ – I captured this midday Friday and posted it in the live trading chat area. The MJ ETF recovered the 50sma, and it did close above it, so I am thinking that we may have another run in this sector coming our way too.
.
AND A MINI-LESSON: For newer readers here. Others may read it as a review.
.
I have also discussed this MANY times before, but I want to point it out again for newer readers here. When we Look at a BULL RUN in a stock in hindsight, it looks so easy to BUY & HOLD. It wasn’t always easy to ride a strong stock , even one like AU. Why? There will always be pull backs that raise doubt, and we have kind of seen that with AU lately. If you just rode AU from September, it looks great, but there were 2 & 3 week periods of Chop and uneasiness often too. In Jan it dropped from $13.5 to $12. In Feb it just dropped from $14.25 to $13. That sounds like no big deal, but when you are holding (say 2000 shares), and it goes from $14 to $12 , you lose $4000.
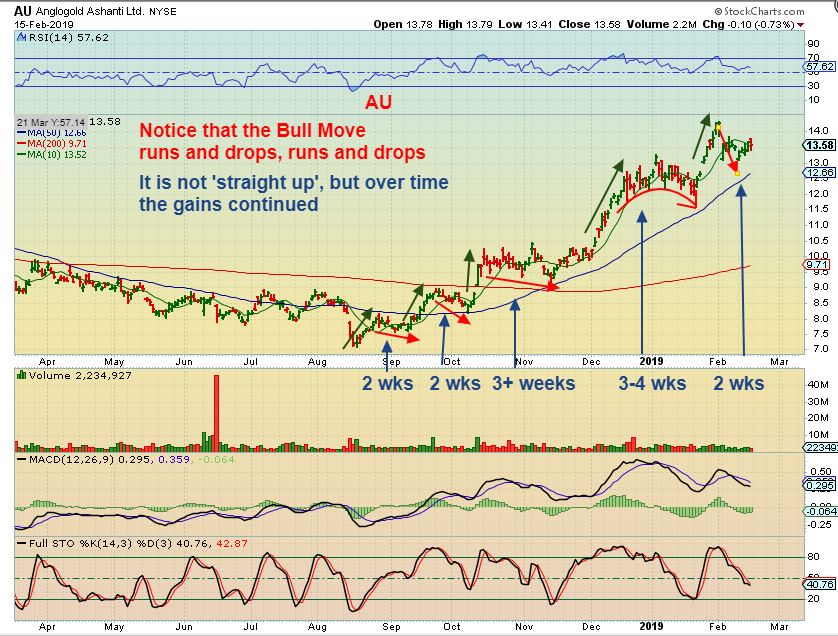
SO LET ME DO THIS AS A REMINDER:
SAME CHART: Those mini dips sound like no big deal in hindsight, right? We look at AU and say, “It doubled in 6 months. That was easy”. But when you are holding (say 2000 shares), and it goes from $14 to $12 , you lose $4000. If you are holding 2000 shares of 3 different Miners and they all do that at the same time (in to a dcl)? You watch $12,000 leave your account and it has a whole new feeling of doubt to it! 🙂 But if it is a Bull Run, you’ll make it back and more. If that is too difficult, then you have to buy that Dip at a reversal, and sell some on the rip (which is what you often see me do). Buy the next dip, sell some on the next rip, repeat, repeat. So look at the chart and we see that even the most bullish ones can get choppy. They may not be straight up, but in a bull run, it remained progressively bullish.

