2-28-2019 – Thursdays Check Up
.
Time to give the markets a little check up…
VIX – When the VIX pops, the markets usually drop. If the VIX breaks out , the markets get volatile and often drop. I expect a drop, so I have been watching the VIX for clues. Wednesday the VIX POPPED to resistance & dropped, IF IT DROPS FURTHER, THE MARKETS CAN MOVE HIGHER. If this breaks out, Markets drop. So…
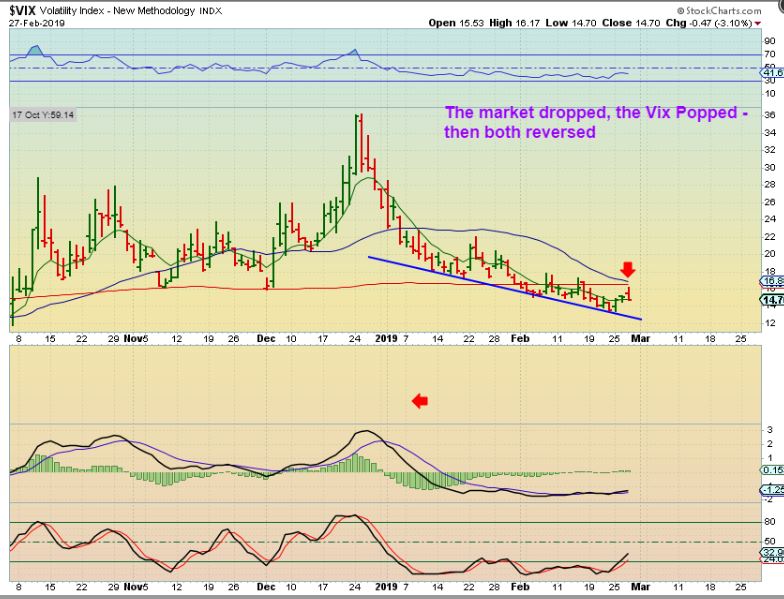
MY question was…Did the MARKETS put in a day 31 DCL, when OIL put in a day 31 DCL? If so, these markets can continue higher…
.
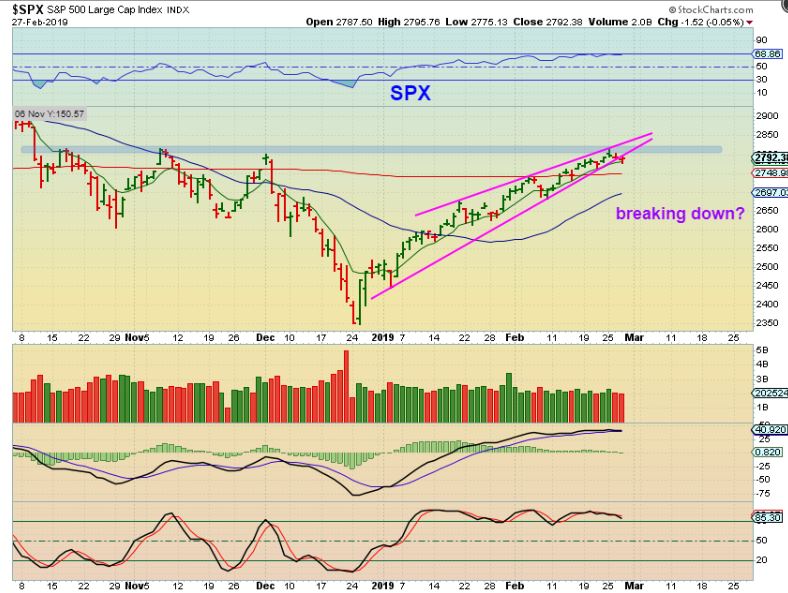
SPX – The Market did do the opposite of the VIX on Wednesday. SPX Dropped and reversed when the vix did too. I expected a pull back from this wedge unless it cab break strongly higher. So far the markets have resisted selling and they have LOW VOLATILITY. I’m just letting this play out. If I was long, I’d have a stop under the 200sma by now to be safe. Breaking that lower uptrend line is often bearish, unless it recovers.
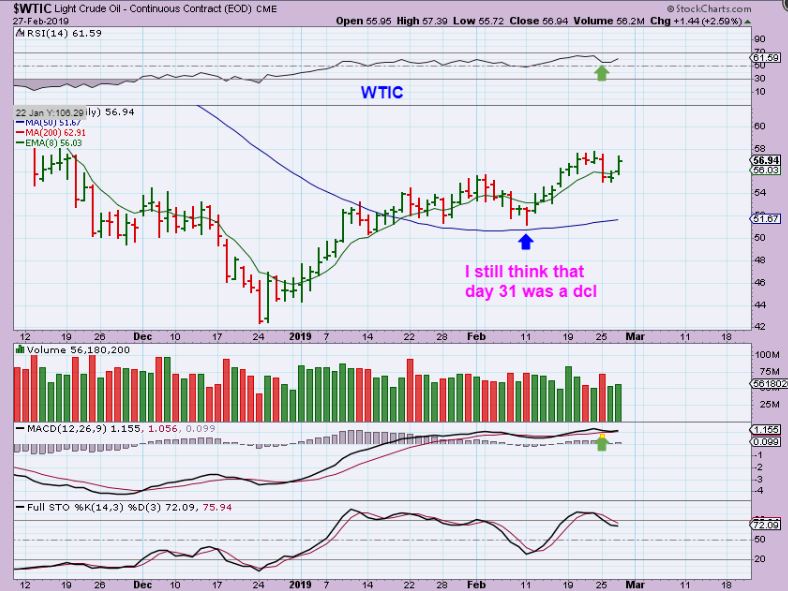
WTIC – Speaking of volatility, Oil was looking fine until it had that 1 surprise down day. Oils drop has now reversed higher and this does still look like a day 31 DCL as I had it labelled. The OIL drop was confusing because THE XLE did not follow Oil down. Oil should continue higher now.
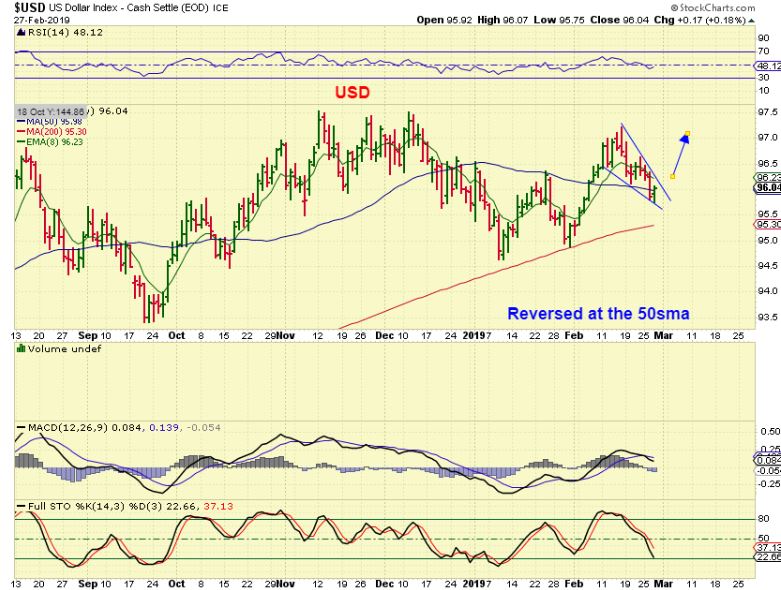
USD – The USD reversed higher after losing the 50sma Wednesday, and Gold dropped. This is a descending wedge, so if it breaks higher and runs, GOLD would continue to drop. If this drops to the 200sma, Gold can get choppy.
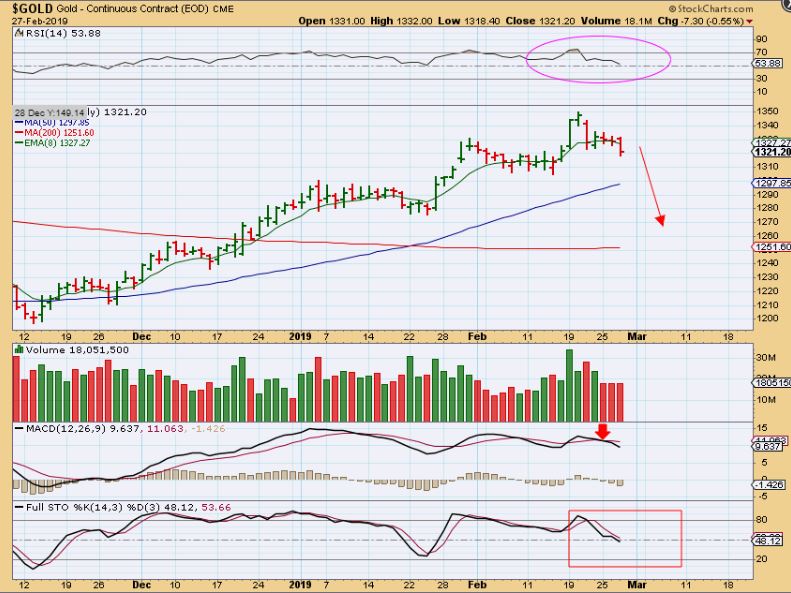
GOLD – Gold lost the 8 ema ( and the 10 sma at $1328.36) and I have been expecting a pull back. Yesterday I pointed out the weakening MACD on each new peak. Gold looks choppy & toppy , but has resisted a big sell off so far. I’m watching $1328.36 – the 10 sma.
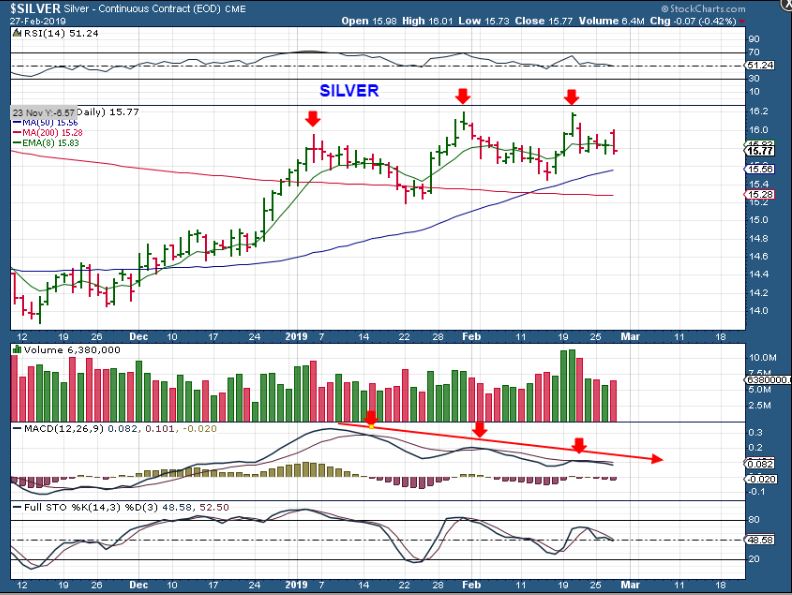
SILVER – The MACD for Silver has been weakening & Silver has been choppy too.
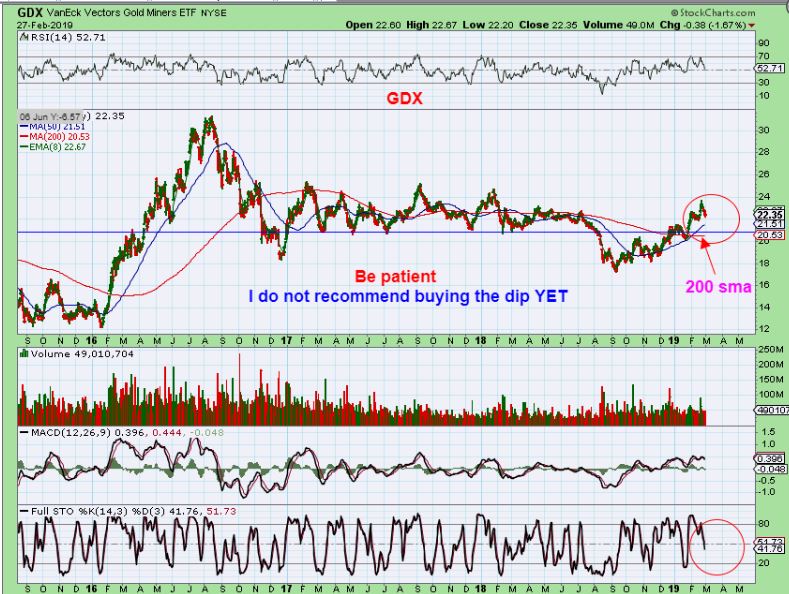
GDX – I want to put the idea out there that the GDX could bounce off of the 50sma and draw in buyers, thinking that the BULL MARKET is working (Buy the dips). Due to cycle timing, I am still expecting a deeper drop even if it bounces ( see the chart). If you decide to Buy a reversal in case this just takes off, that is fine, just be sure to USE A STOP.
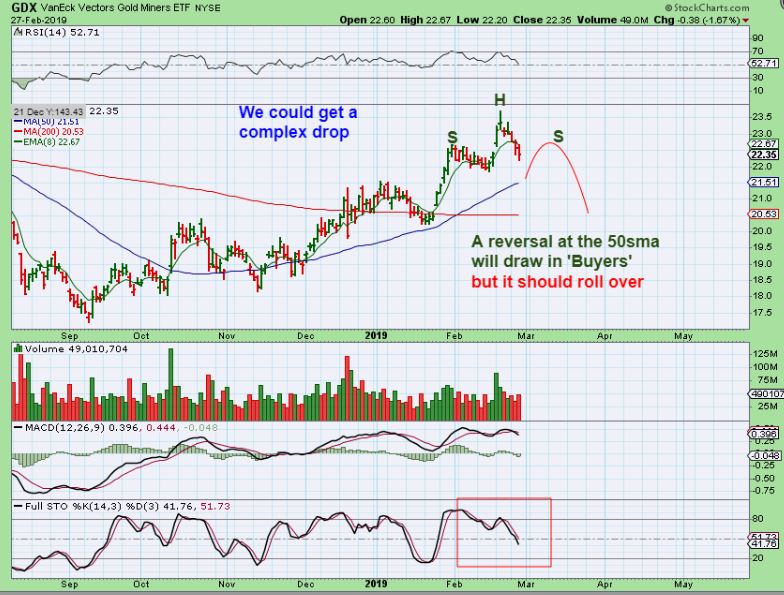
GDX – I would expect a drop down to the blue support line, and the 200sma is there too. This could be a GREAT Buying opportunity, but I want to be patient and allow ‘time’ to do its thing.
.
Things still seem to be playing out pretty much as expected, now that OIL has reversed higher again.
I expected the General Markets to start pulling back sooner than later, and I am still thinking that it should drop.
The Precious Metals seem to be heading into their Daily Cycle low. Even if they bounce theyshould trend lower over time. Biotech stocks look good. I will post a few ideas below.
.
Enjoy your Thursday trading!
.
~ALEX
.
BITCOIN #1– I’ve been watching BITCOIN Bottom, and the BLOCKCHAIN STOCKS reacting as it does ( In the past I have seen them run together ). I was looking for this break out.
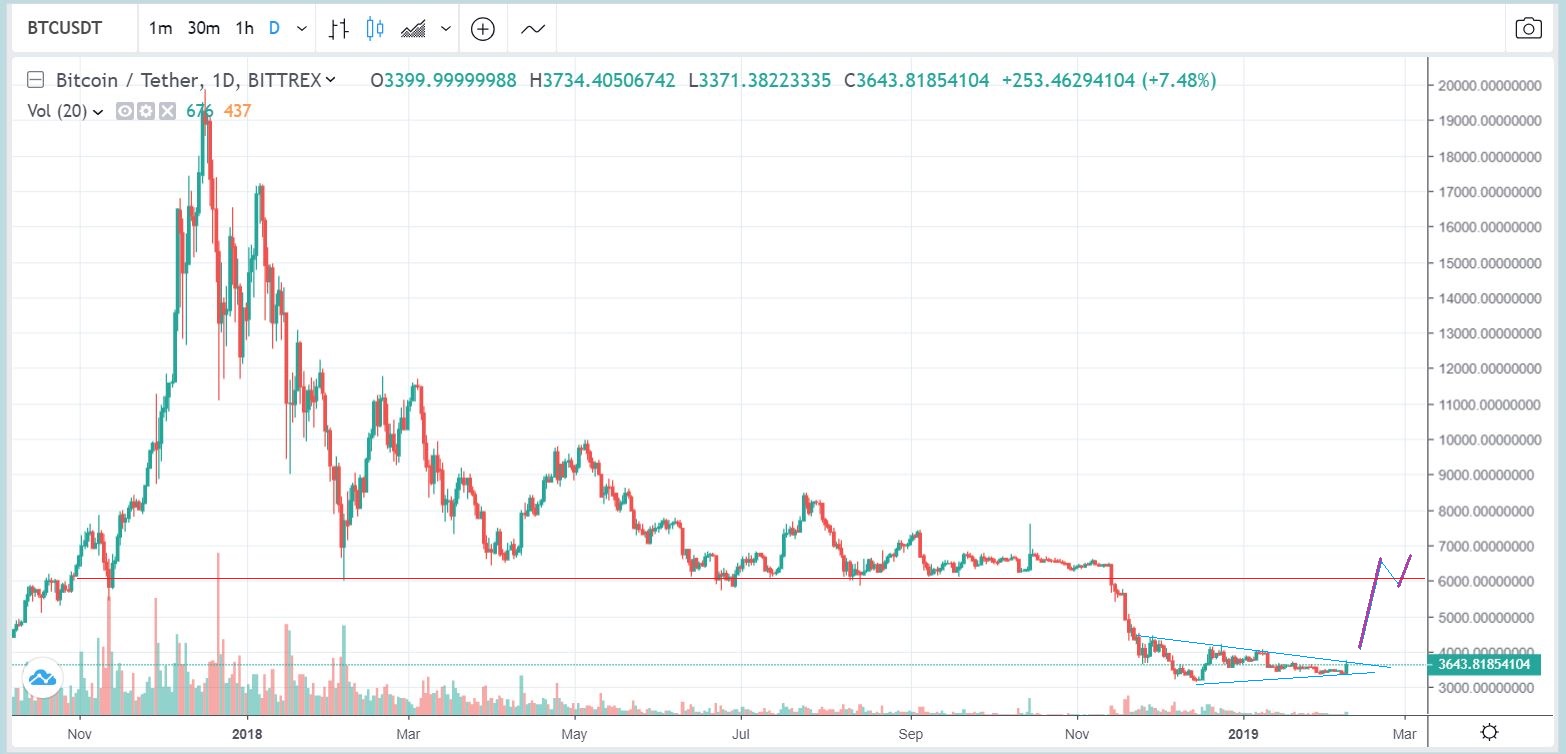
BITCOIN #2– It broke out and formed an even bigger wedge. Things were looking good when this one broke out too…
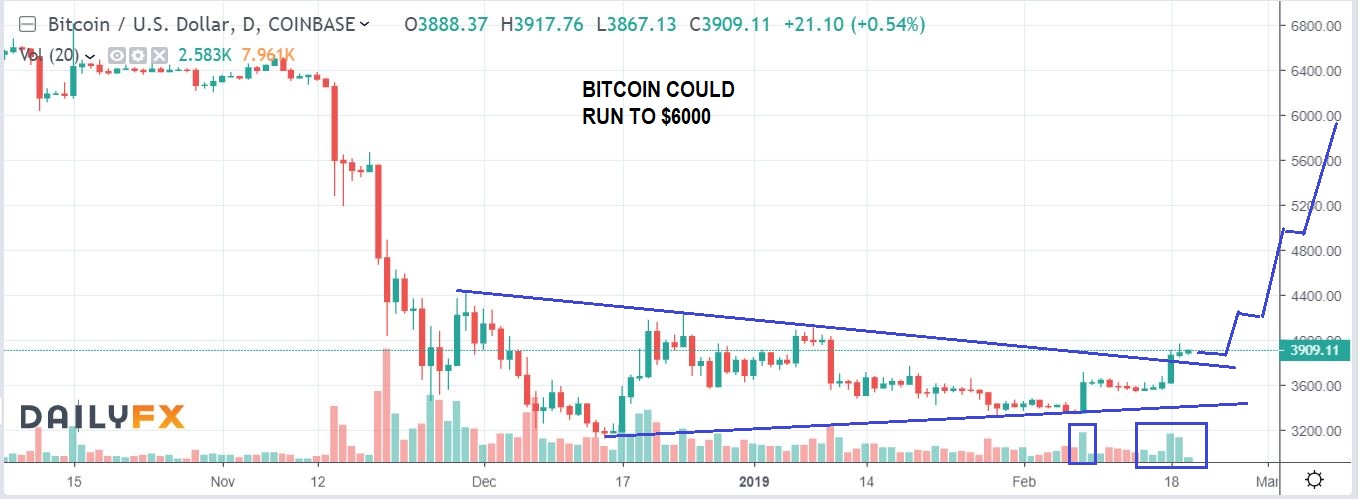
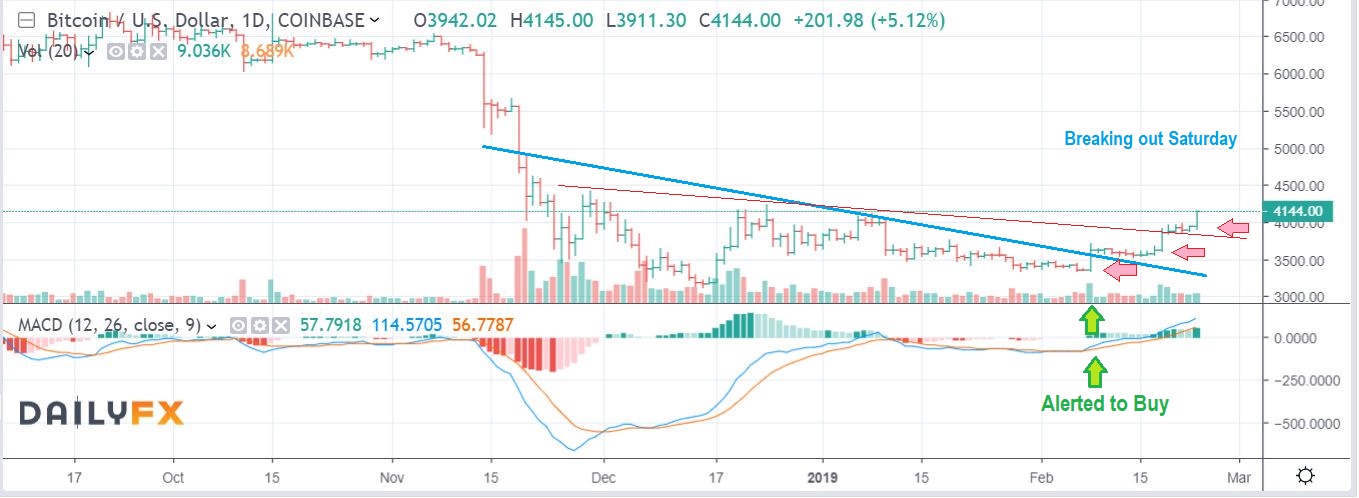
After breaking out on Saturday as seen here, it crashed down later. Lets take a look at a close up…
.
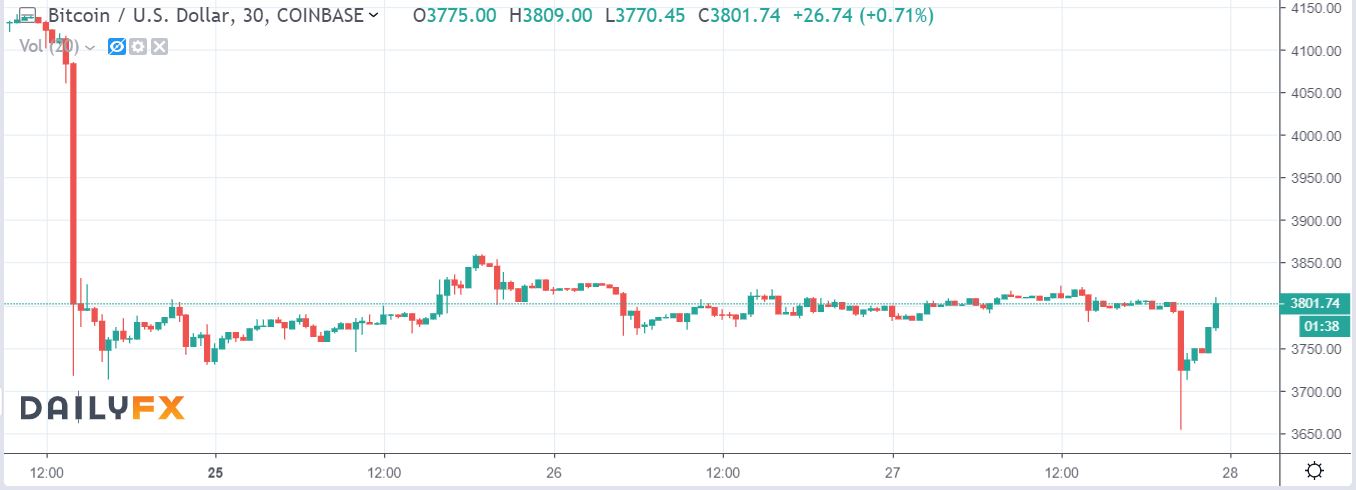
BITCOIN 30 minute chart close up pf 3 days – After the big sell off in Bitcoin on the 24th, it went sideways for days and Wednesday night I saw it crash down & recover with this reversal candle. This looks like a ‘shake out’ Wednesday night and it is recovering, so … IS THIS FLASH DROP TO $3650 SIGNIFICANT IN ANY WAY?
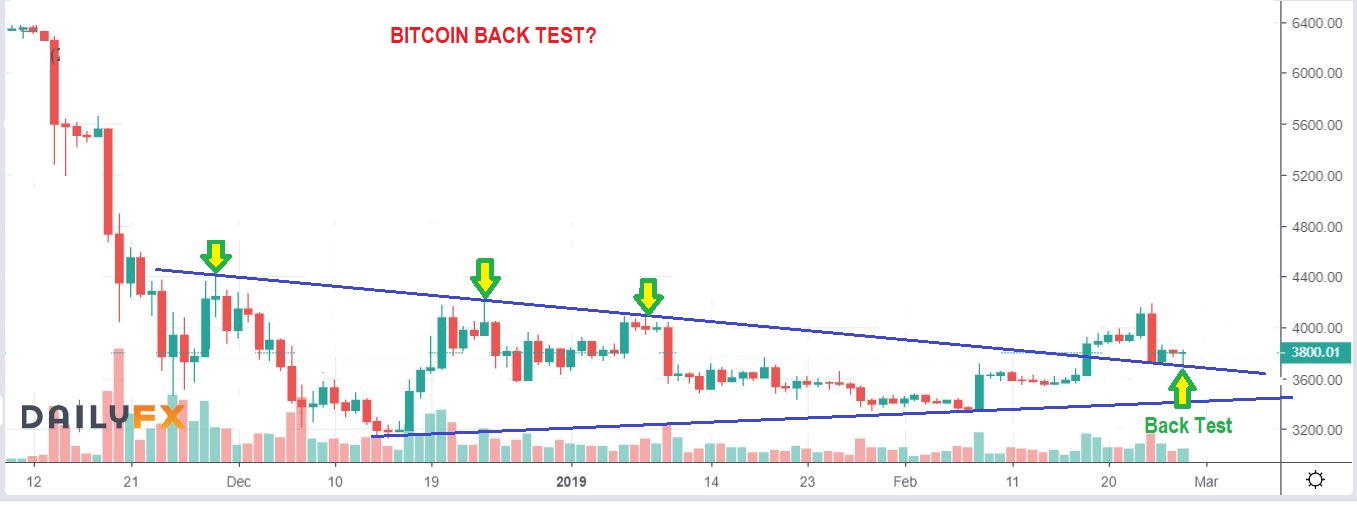
BITCOIN WEDNESDAY AFTER THE MARKET CLOSED -It is hard to believe, but that flash crash & recovery looks like a perfect back test of the break out of the wedge, and then it reversed higher. If so, BITCOIN is free to continue its run higher.
.
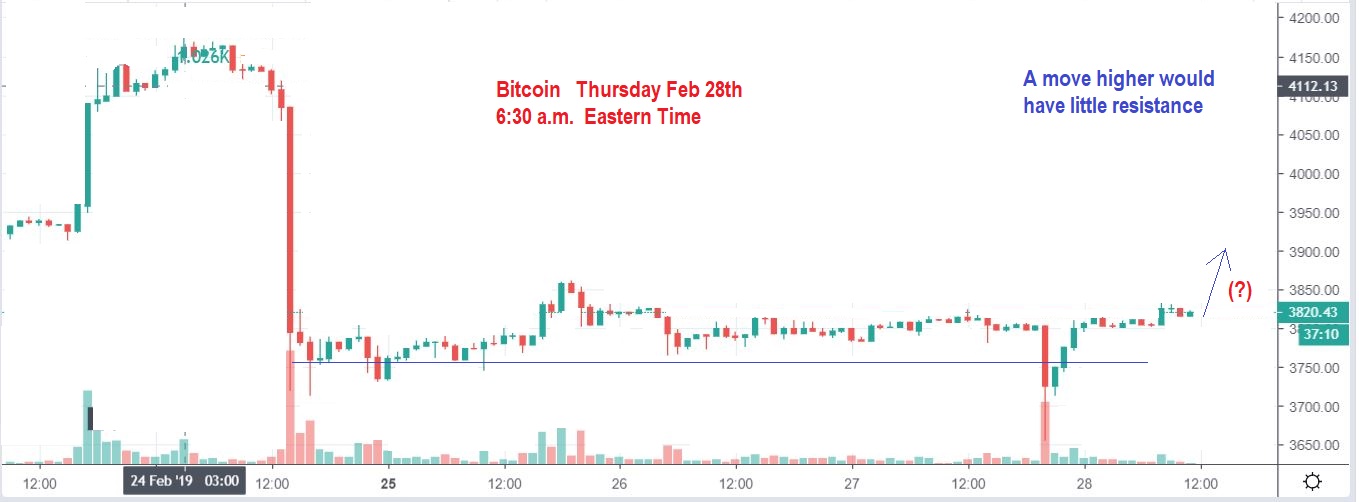
EDIT: THIS IS BITCOIN TODAY AS I PROOF READ THE REPORT – If it can run higher, it could move swiftly, but so far it is running sideways like it was prior to the flash drop. It looks like a shake out though.
I will be interested in watching that play out and to see if the BlockChain Stocks continue to respond too.
.
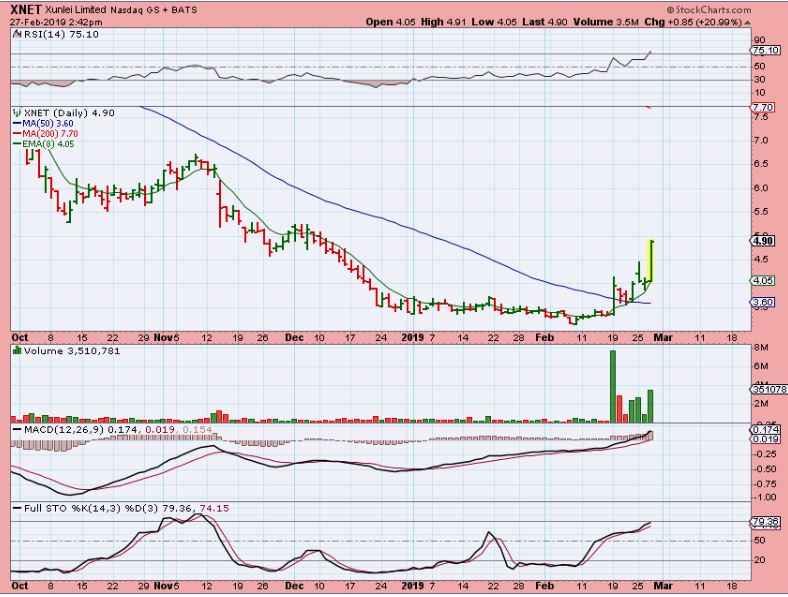
XNET – The XNET BASE & TRADE. This was posted by me due to blockchain. I mentioned XNET, MGTI, RIOT, MARA, GROW, LFIN, etc etc over time. There are many more.
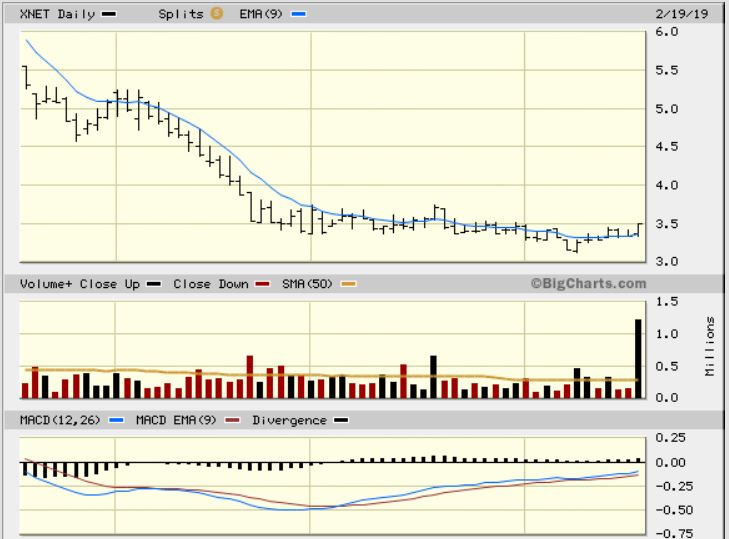
XNET – Notice that this POPS & drops to the 8 ema. Then POPS & drops to the 8 ema. So I sold 1/2 of my position at $4.96 on this pop , and posted that in the comments Wednesday. This may or may not pull back, bull flag, dip down to that 8 ema, and then take off higher again, so I kept 1/2 in case it just keeps running, but I also might add on the dip if we get one.
.
IN PLAY TRADES FOR TODAY – UPDATE OF 4 BIOTECH STOCKS (Plus 1) that I liked , and are still acting correctly. Earnings were also released on 2 of them earlier this week. I am also adding a new contender that looks promising & Bullish. I will start with the new one…
.
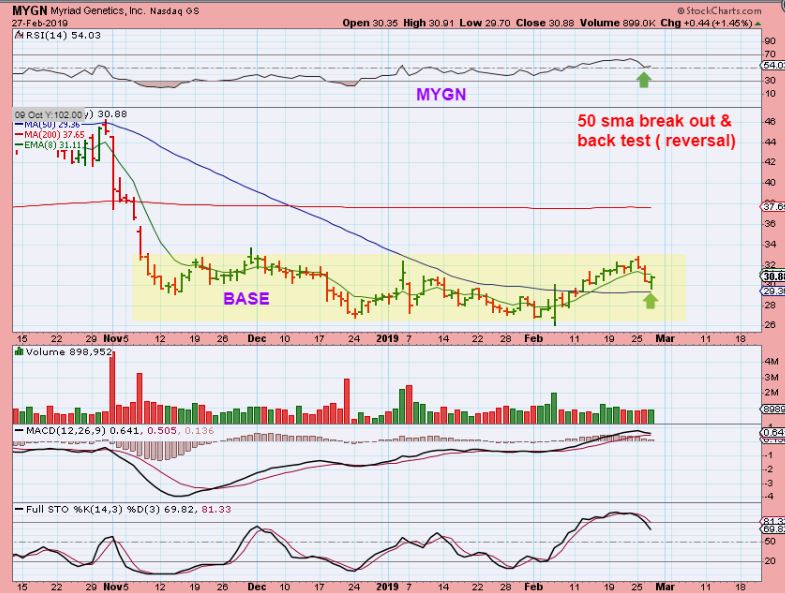
NEW TRADE IDEA : MYGN – I have been watching MYGN after it broke out above the 50sma, and now that it has dropped and reversed on the 50sma, I consider it a BUY. This is a low risk buy and a close above $31.61 on a weekly chart would be great ( fridays close). . *I do not know when earnings come out.
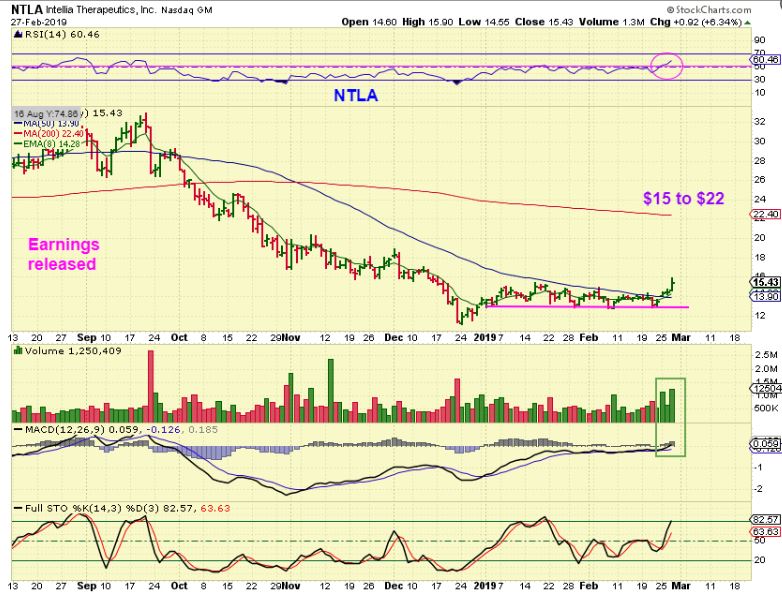
NTLA was a low risk buy around $14 and …
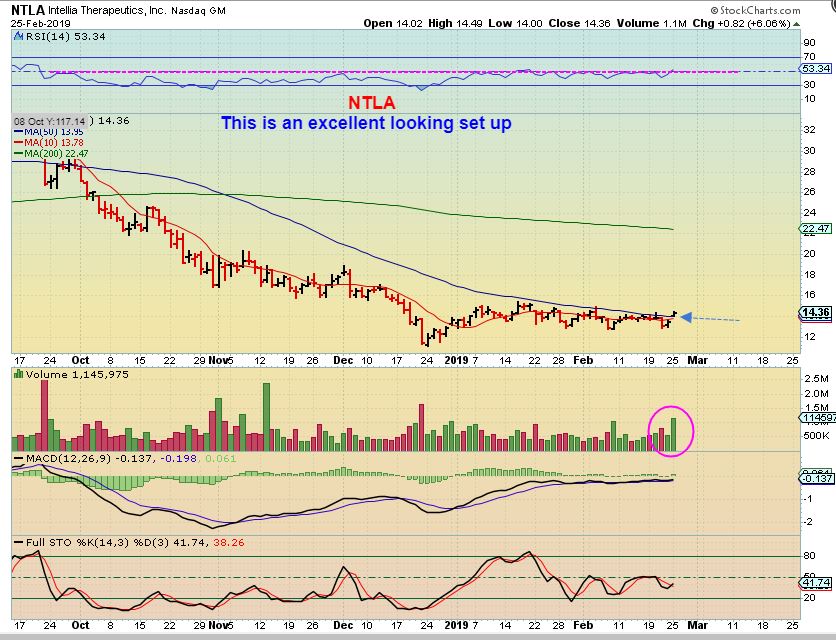
NTLA – It has follow through. Earnings are out, I think that this can run to $22 over time. This is STILL a buy.
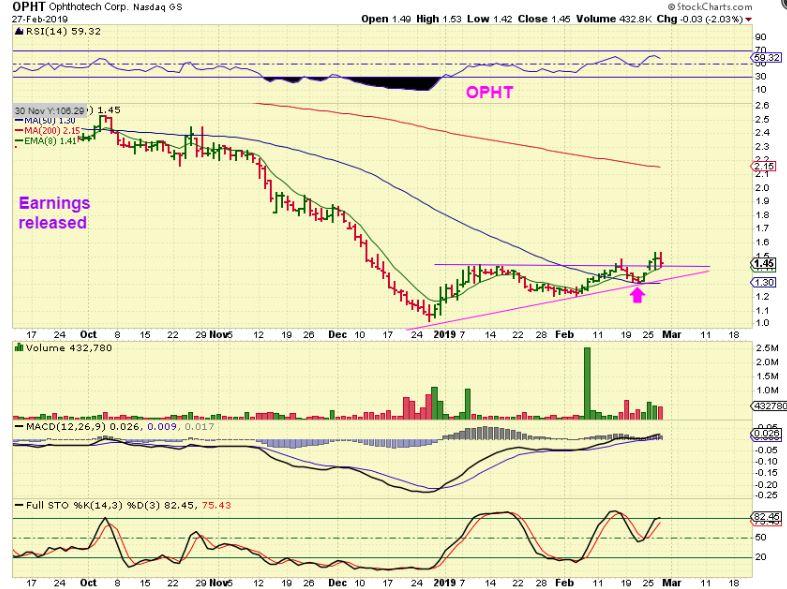
OPHT – OPHT broke out, back tested, and is still OK. It closed red Wednesday, but that doesn’t look concerning, and earnings were already released.
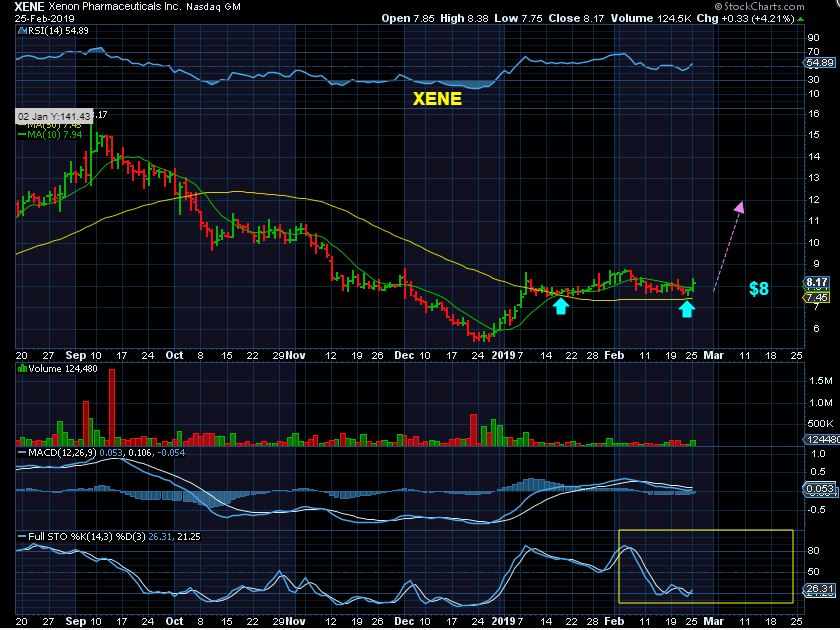
XENE – This Feb 25 chart was posted as a BUY as a back test & consolidation along the 50sma
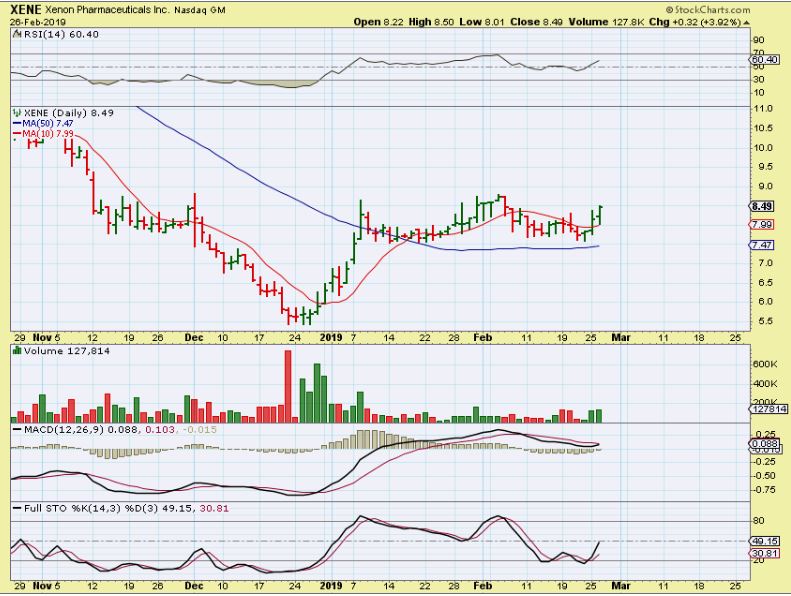
XENE FEB 26 – And it got some follow through, still a buy.
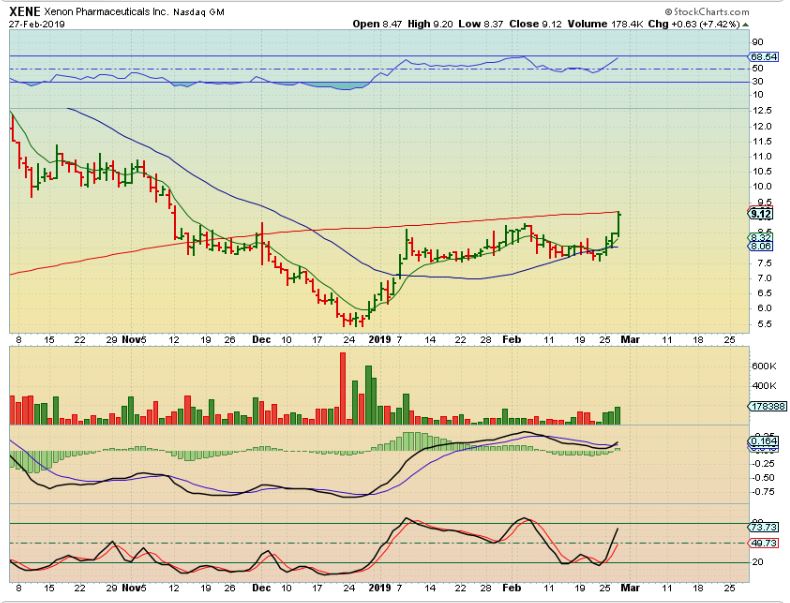
XENE -Now it tagged & pushed on the 200sma.
1. It may crawl along the 200, or
2. It may just break out. I would be comfortable ADDING or buying on a break out (or a pull back for that matter).
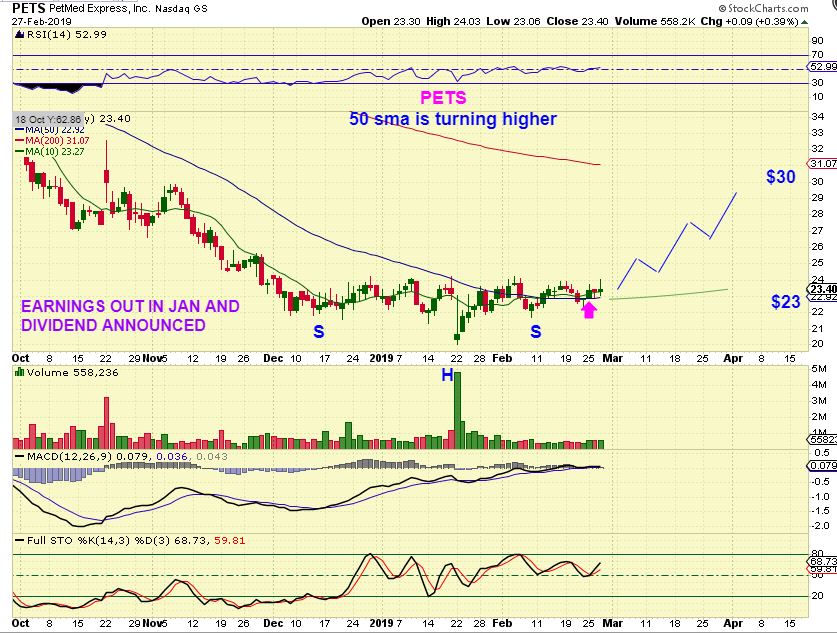
NEW TRADE IDEA: 1-800-Pet Meds – Bouncing on the 50sma is bullish. You can watch for and buy a break above Feb highs or just Buy & Hold with a stop under Feb lows. It does seem to slightly break the 50 and recover , so a stop there may shake you out.
.
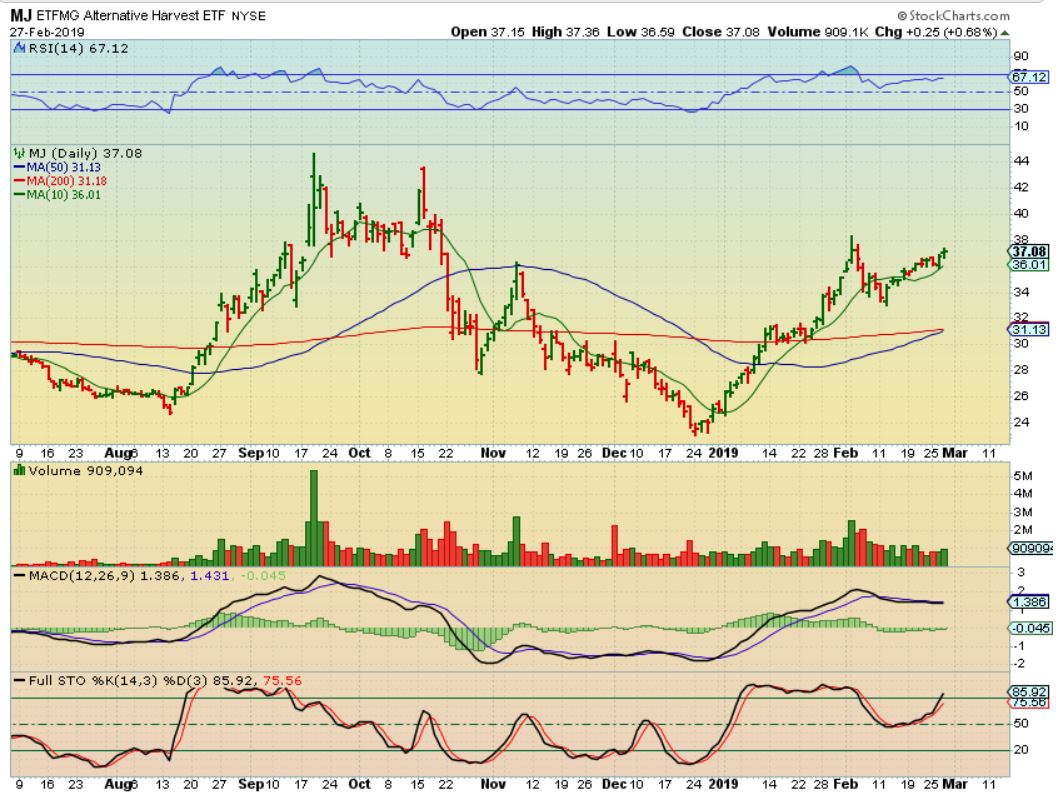
MJ ETF – Still acting correctly
.
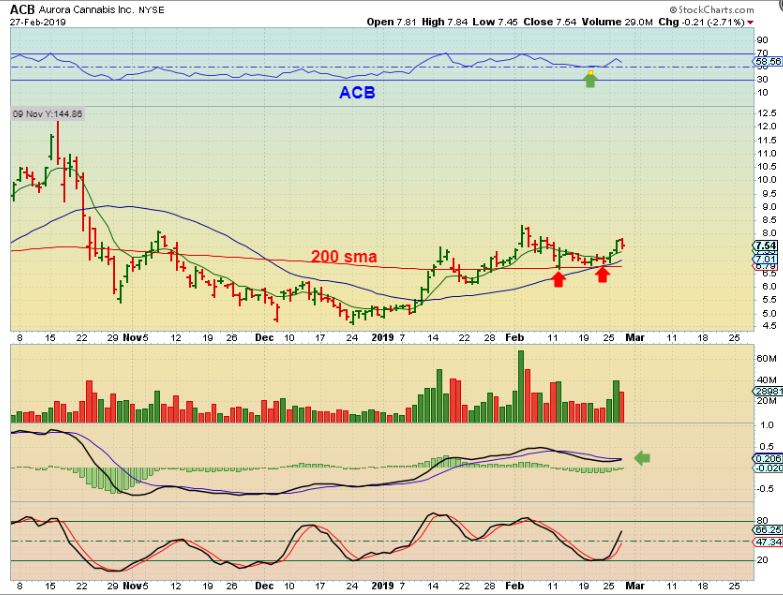
ACB – ACB dropped but is not damaged. It should have solid support where the 200sma is, but I’m hoping for a run higher sooner than later. I’d love for it to reverse off of the 8 ema.
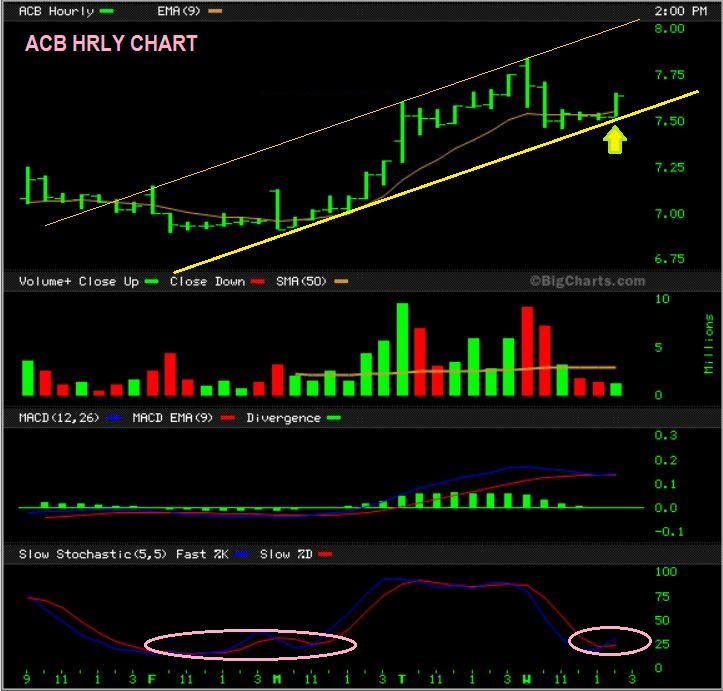
ACB HRLY – I checked out ACB Intraday and it found support just below $7.50 right on a trend line, so I’d actually like that to hold going forward.
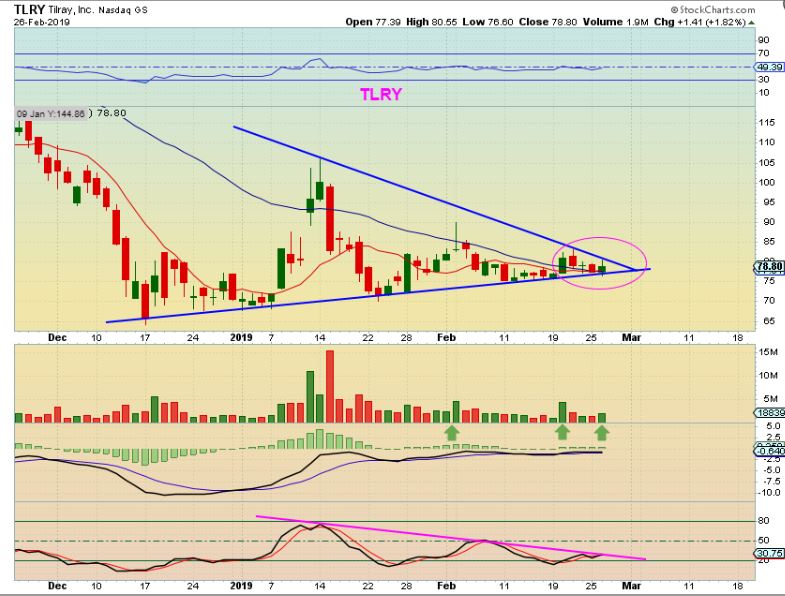
TLRY – TLRY is in a tight pinch and at the apex. It closed slightly Green Wednesday
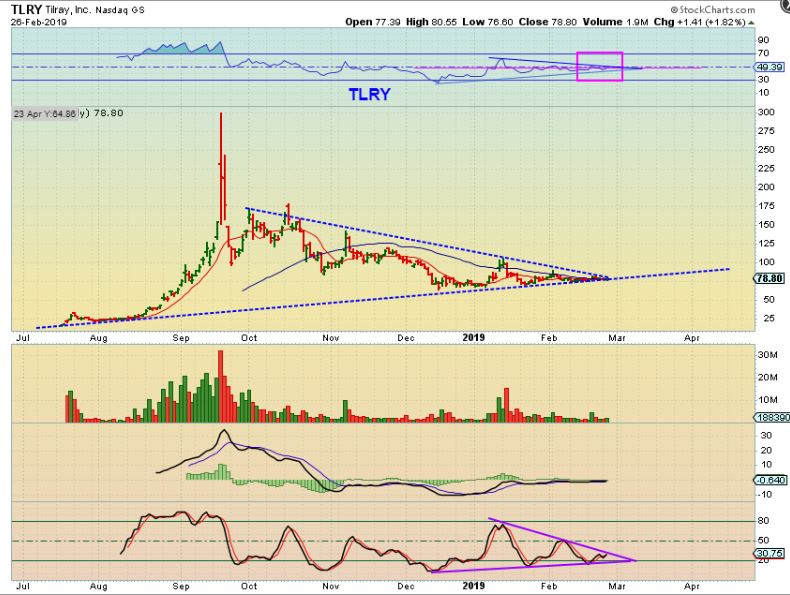
TLRY – A close above the last candles high here, lets just say $81 or $82 to be comfortable, should be a bullish break out.
.
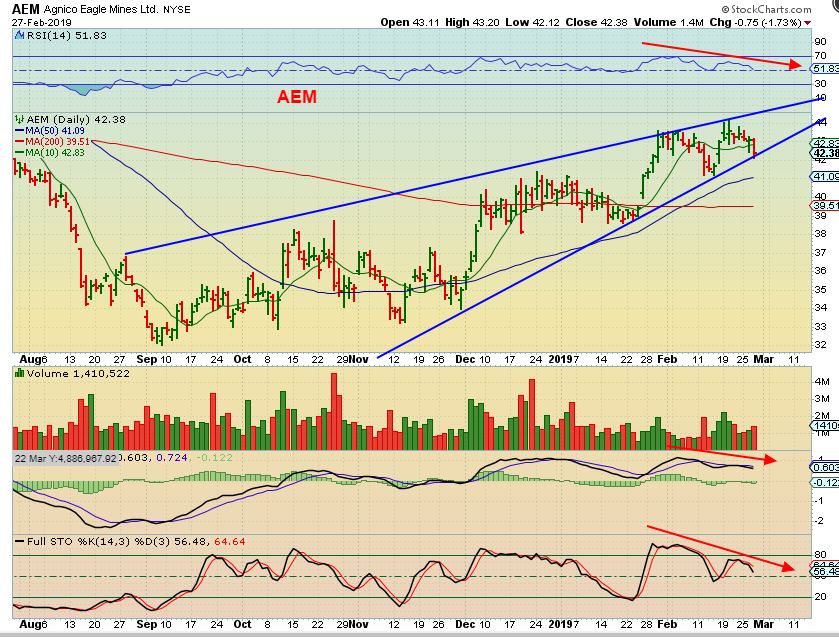
AEM – This is how I see certain Miners. They have had a nice climb, but it just looks like it is time for some to pull back. Even a sideways drop to the 200sma will change this to a channel instead of a wedge.
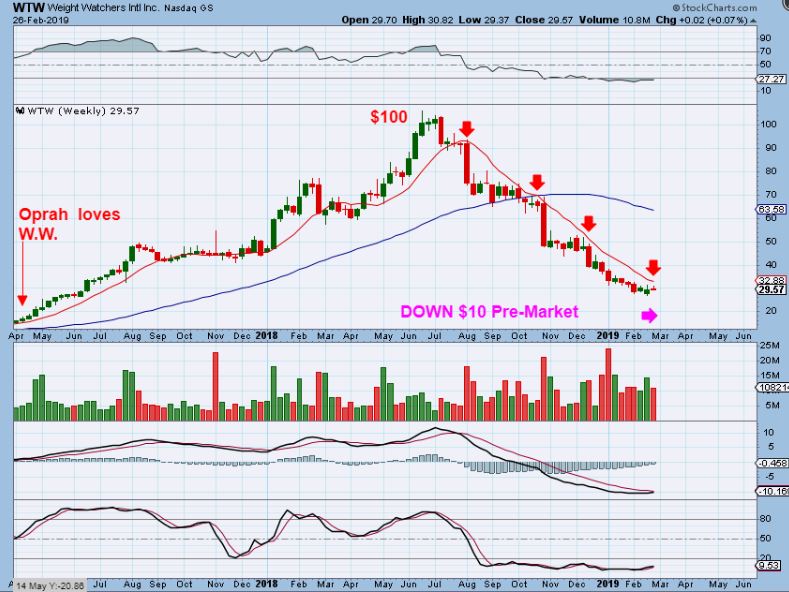
Finally – Just a learning lesson: I captured this chart pre-market Wednesday.
WTW – I remember when Oprah became a spokewoman for Weight Watchers and the stock shot up and ran higher ( I think it was actually late 2015, WTW was near $14?). It was in the teens and made it to the 100’s over the next few years, but in 6 months it gave it all back. This is just a good example of why we use stops and WE DO NOT FALL IN LOVE WITH OR MARRY A STOCK, even if it is “All that and more!” and has “So & So” backing it. WTW was down 35% Wednesday again, and it opened and traded in the teens all day.