
Wednesday Jan 9th- The Climbing Wall
As the various sectors bounce out of their recent lows, they continue to do pretty good on the Climbing Wall. Some may be climbing the so called ‘Wall of worry’. Let’s take a look at the progress…
.
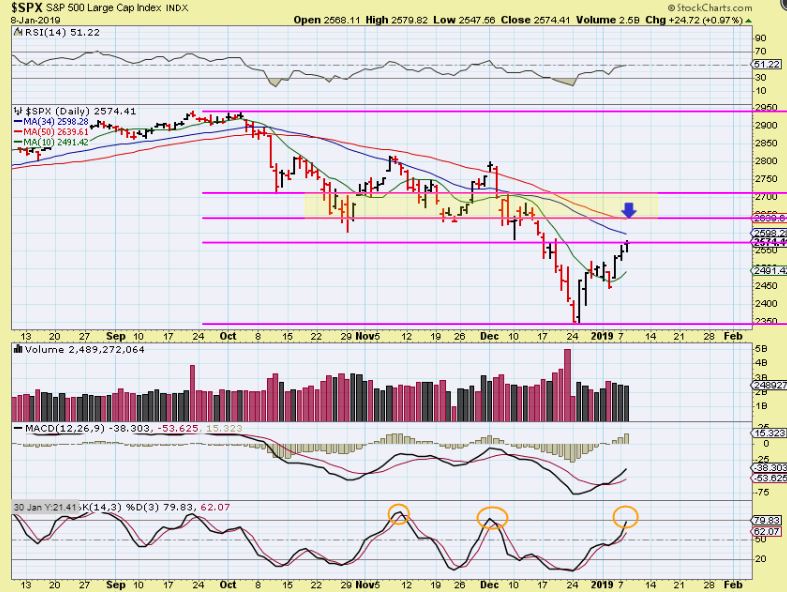
SPX #1 – If this is an ICL, we should have a month or two off of the lows, but we are seeing price enter ‘resistance’ areas. It CAN push higher, but we are nearing an area that may offer resistance and stall price too.
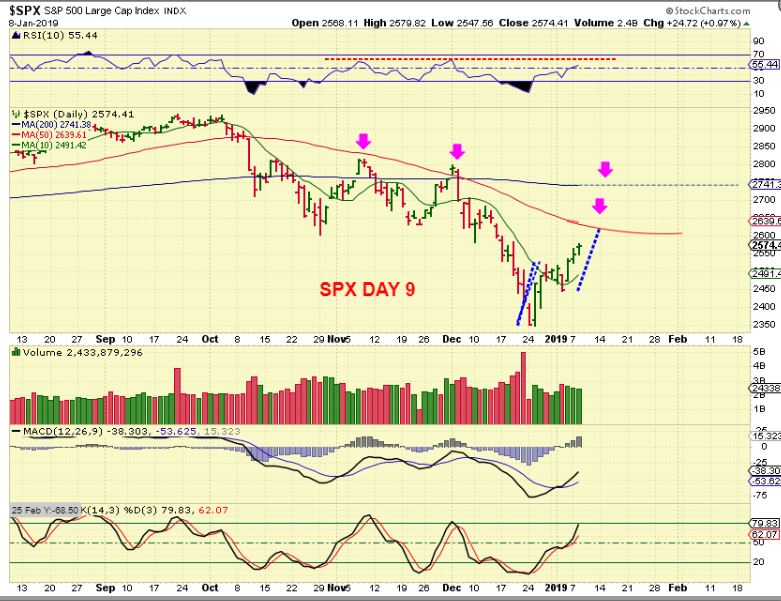
SPX #2 – This is actually day 8 . This bounce has played out well so far, we are reaching various resistance areas. That blue line 200sma should be attainable as a back test ( in my opinion), but if someone has taken on leverage heavily at the lows, the resistance areas could be an area to lighten up a bit. This has been steadily higher, but it could get choppy at the resistance area. Time will tell.
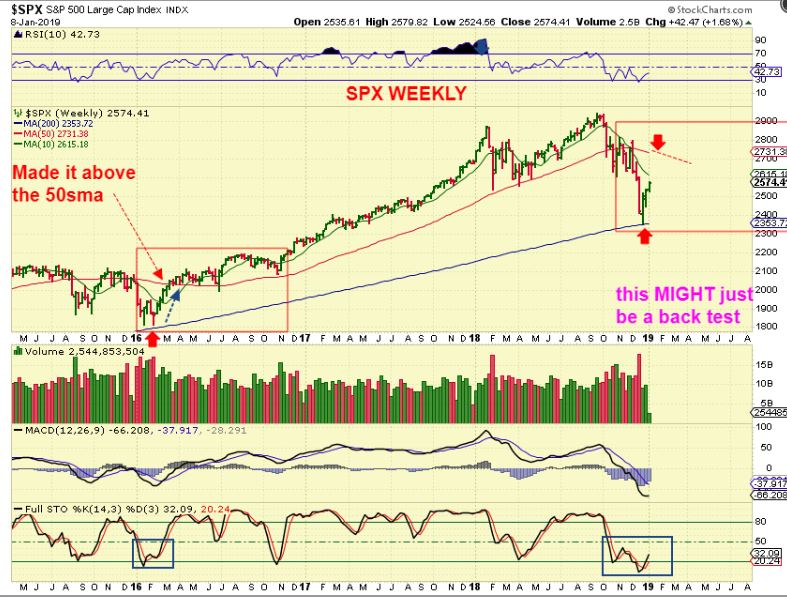
SPX WEEKLY – Something to watch. After the 2016 ICL was in place, the rally was able to push above the weekly 50ma rather easily on a steady climb. It took weeks and this is only week 2, so we can compare the strength here to that time period as we push forward. I would expect a back test of the 50 weekly ma , but I am watching for a possible right shoulder to form and a drop after that. If this just keeps breaking higher, we’ll reassess.
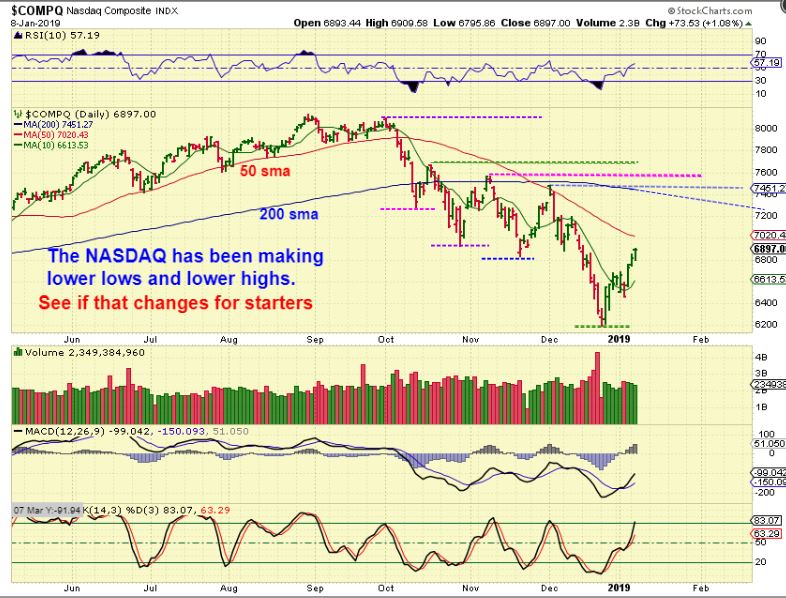
NASDAQ DAILY – Lower lows and lower highs is bearish until that changes. This could also still continue higher, but that 50 sma can offer resistance. Note: If this gets choppy and simply goes sideways for weeks, the STOCKS can still power higher.
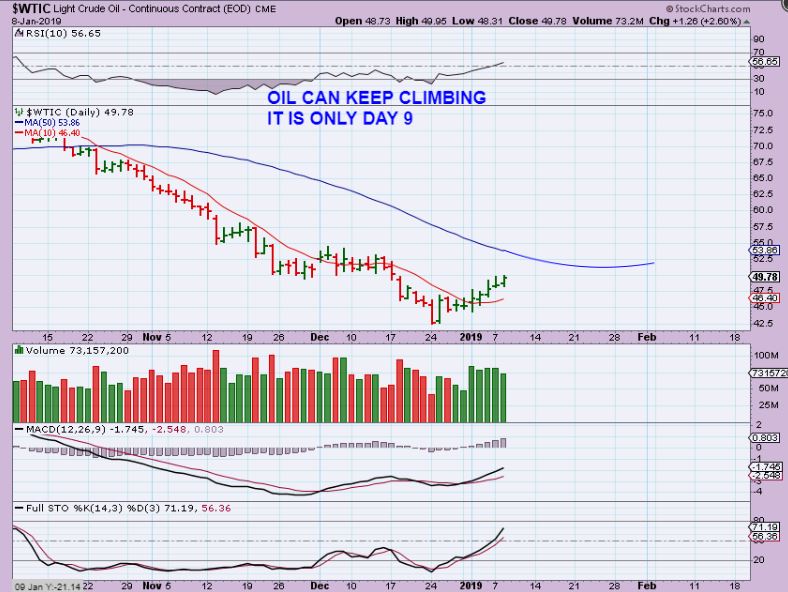
WTIC DAILY – After the initial sideways pause at the lows, OIL has continued higher with Good volume. I am watching the 50sma for a possible pause. WATCH $51- $52.
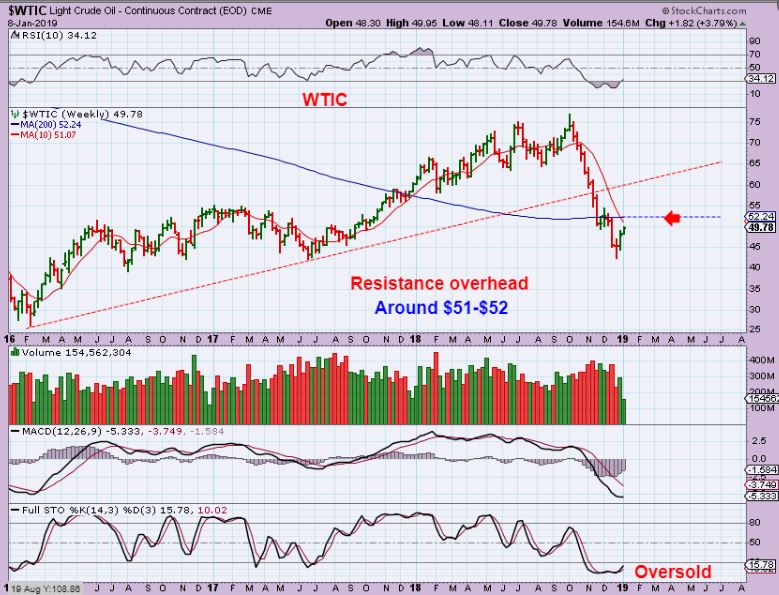
WTIC WEEKLY- Resistance on the weekly is around $51-$52 too, so that is an area to keep an eye on. oil CAN move higher, this is just an area that I am watching for now.
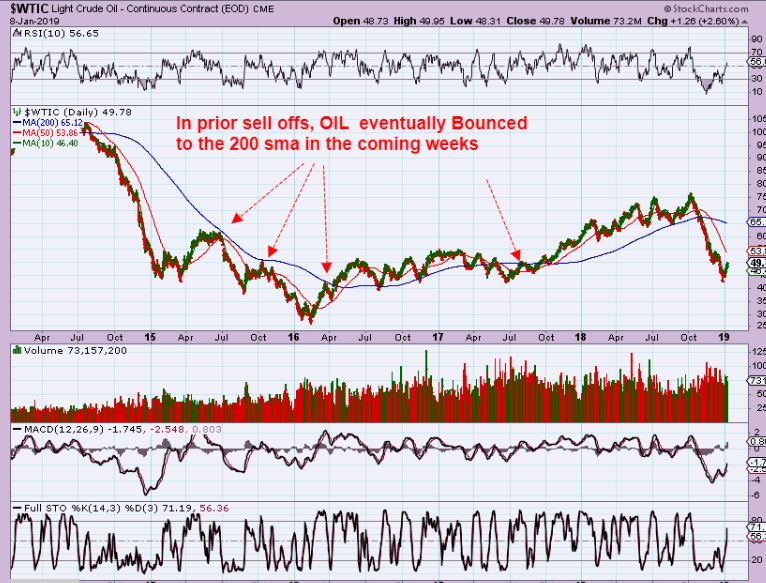
WTIC BIG PIC DAILY- Can Oil tag the 200sma? It has in the past, but some bounces were also rather short lived, so we’ll take it step by step, and $51-$52 is the next step. That is the Red Line here too.
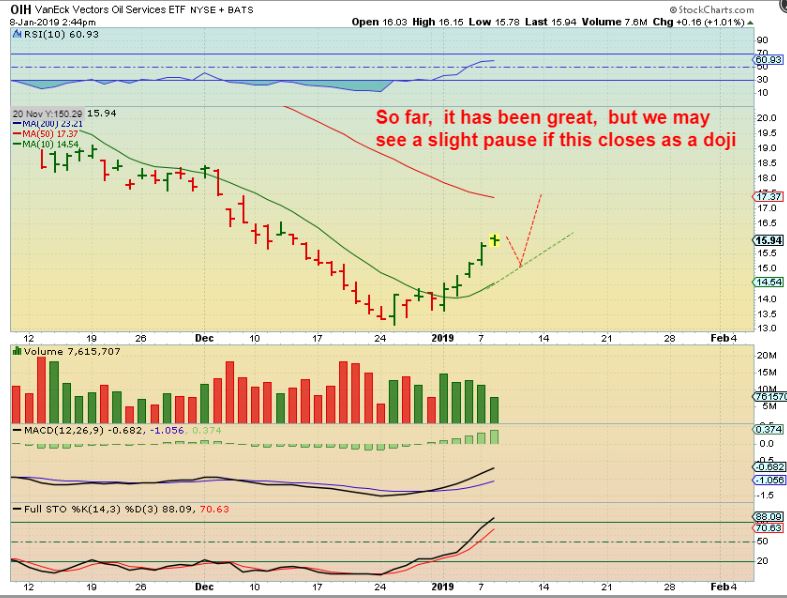
OIH – I sold my GUSH, simply to lock in gains, but kept my Oil / Energy stocks. GUSH ( or OIH, XLE, XOP) can just continue higher day after day , just like the sell off dropped day after day. It can be either straight up from here or after a dip as shown. If it back tests the 10sma, I may re-buy a reversal there.
.
WHAT IS AN EXAMPLE OF WHAT I’M LOOKING AT ON MY ENERGY STOCKS?
.
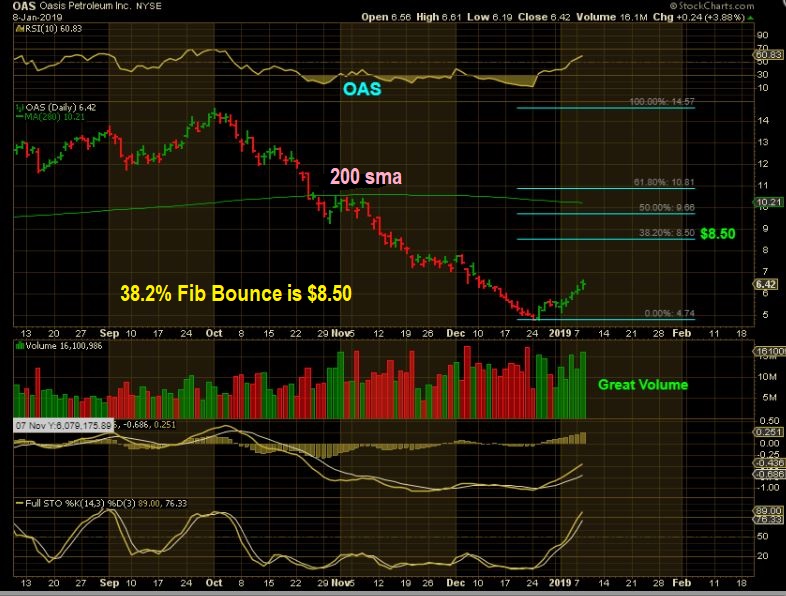
OAS #1 – I used FIB projections, since even a ‘weakish’ bounce should make good gains. NOT STRAIGHT THERE, but a run to the 38% or 50% would be great gains.
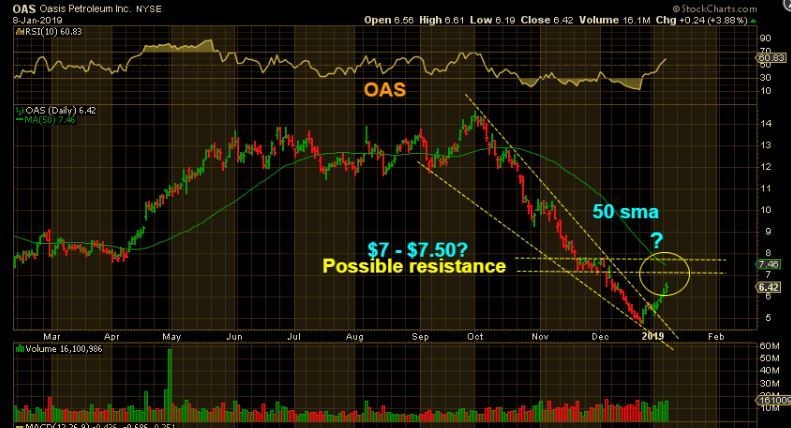
OAS #2 – The 50sma ( $7-$7.50) is also a probable target if Oil continues higher ( A first target, it can go higher). It could run there from short covering and buyers jumping in, or it could take the 1-2-3-4-5 path, with this being wave 3 now.
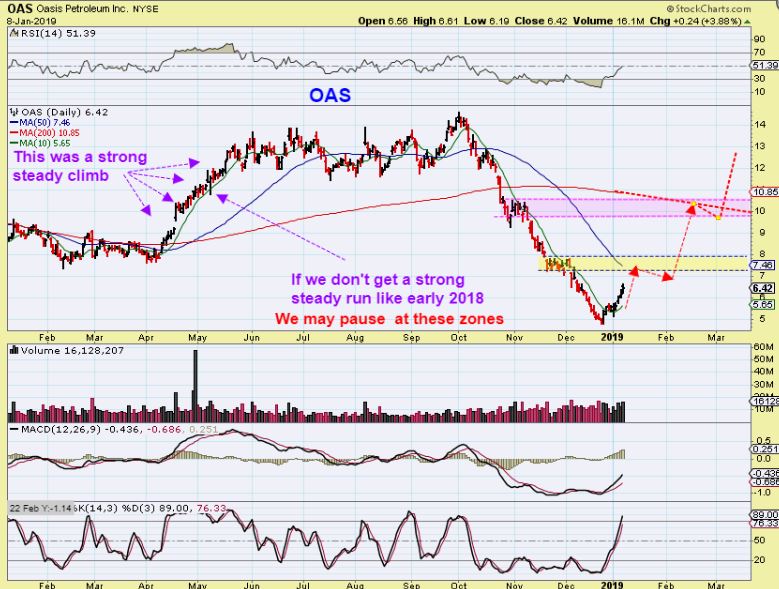
OAS #3 – If we get a complete recovery over time, and it isnt a rapid rise like we saw earlier in 2018, we do have small pockets of resistance along the way.
WILL I PERSONALLY BUY & HOLD ALL THE WAY TO THE TOP IF WE GET THE FULL RECOVERY? As a regular trader, probably not, but I drew those for the readers here that are more of the ‘buy & hold’ type of investors. I certainly do use these ideas to trade in and out at support & resistance levels too. Most here know that I often BUY when a stock bullishly crawls under the 50sma for example, and then Pops through for the next run. If OIL can continue to recover, I may be trading these stocks often.
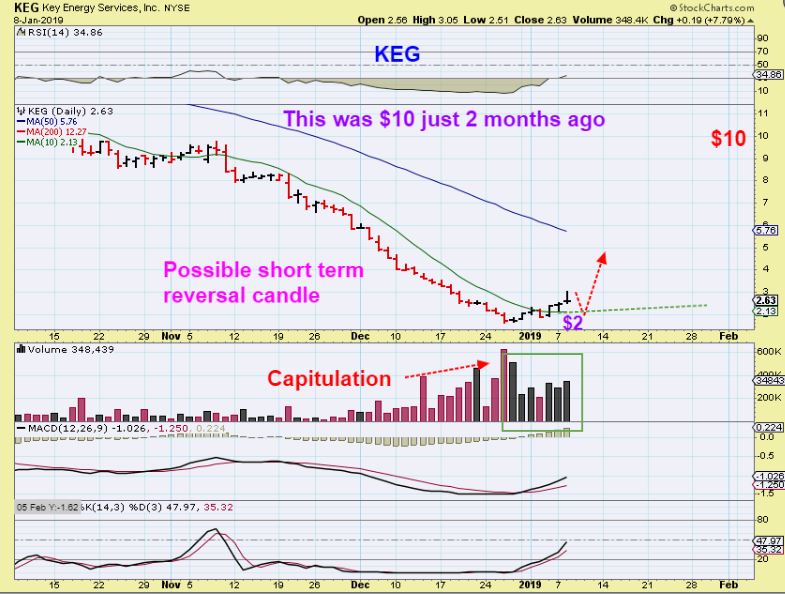
KEG – This could be a buy here or especially if it tags the 10sma. I saw a reversal Yesterday. Check your energy watch list for short term buys. We’ve traded AXAS, AREX, PDS, BAS, HK, KEG, OAS, LPI, WPX, etc etc in the past.
.
GOLD – If we ever get that steady pull back, I used this idea in the recent past. This sector does not want to sell off yet. It seems that each dip is being met with buying. I did a report on AN ADJUSTED VIEW last Wednesday, Thursday, and Friday with out weekly close matching the Bullish December Monthly close. It ignores cycle counts as a primary factor. Why? I discussed a “Melt Up” where buyers step in and buy the dips. THE IDEA WAS THAT YOU SHOULD OWN SOME MINERS , DESPITE CYCLE TIMING. Start small and build on it if necessary. I Discussed various Miners recently like Silver stocks still at their lows and bases, and other laggers like AUMN, NGD, ALO, HL, FSM, GPL, ETC, ETC. , I will touch on that again…
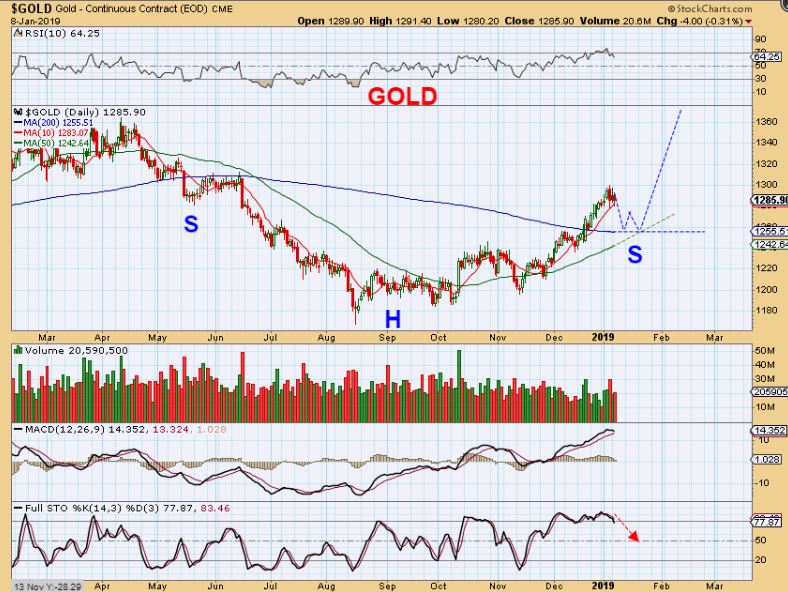
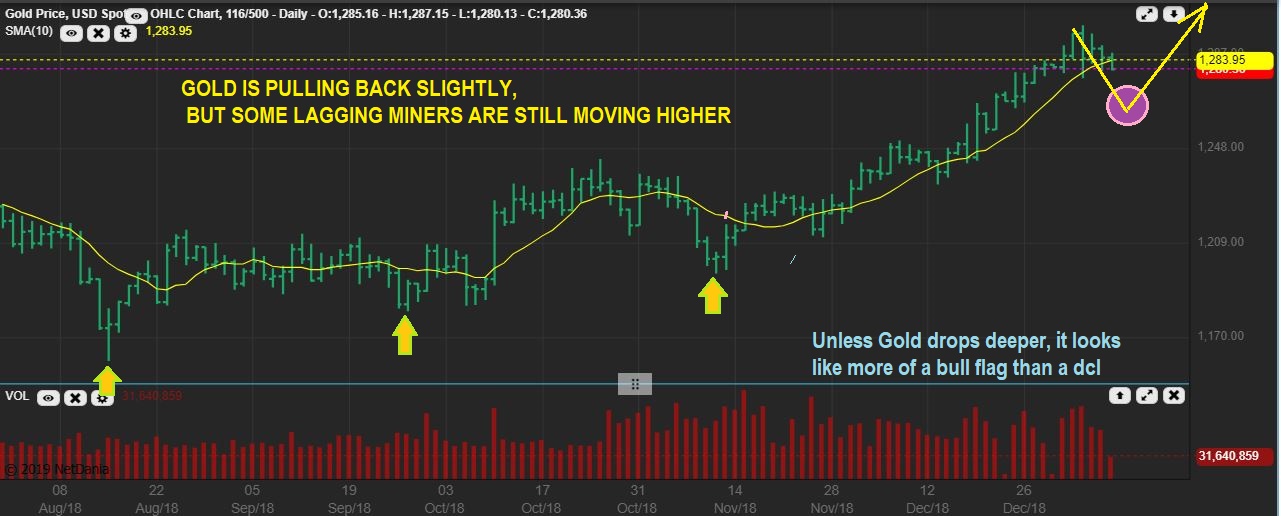
GOLD LIVE WEDNESDAY JAN 9th- Gold has been dropping, but it is mild at this point. I’d like to see more of a drop.
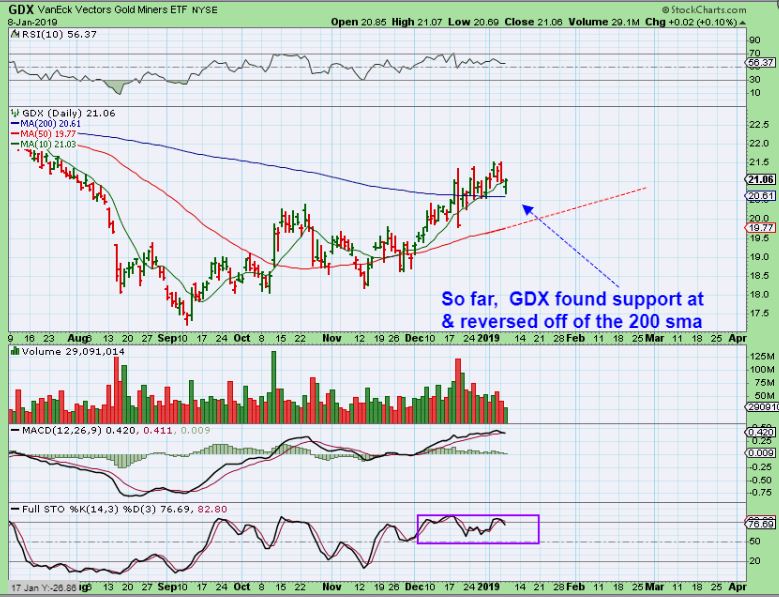
GDX DAILY – GDX dropped to the 200sma on Tuesday morning, but closed as a reversal by the days end. It closed green as buyers apparently bought the dip to the 200sma.
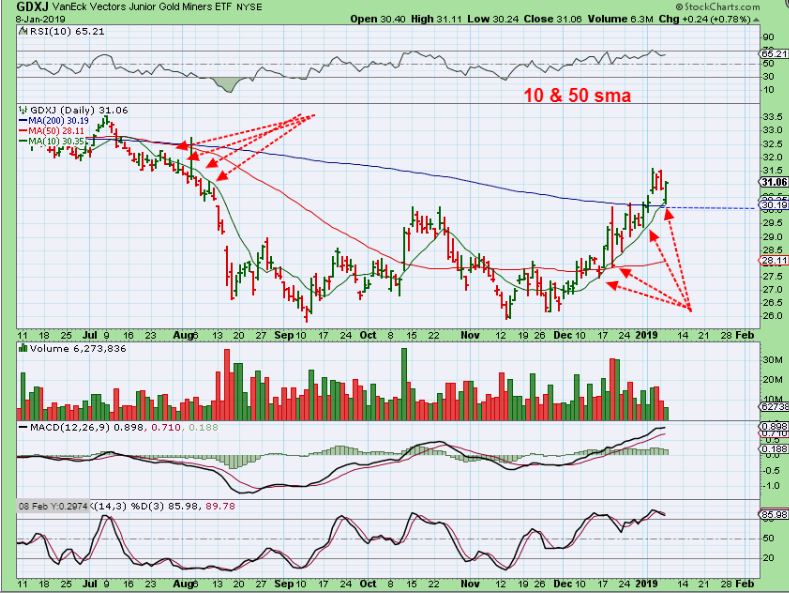
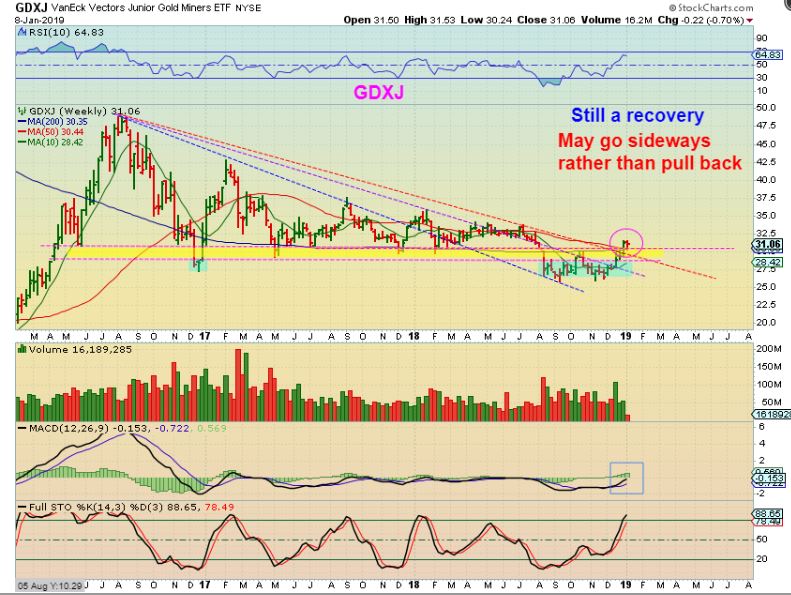
GDXJ DAILY – I have discussed the melt down and the melt up – where the 10 sma is the barrier for a long period of time. It appears that Buyers are stepping in at the 10 sma . Also the 200 sma was a support area, just like the 50 sma was earlier. This may continue higher or just crawl along the 200 sma, but so far it won’t break down.
GDXJ WEEKLY – So if we remember where we are in the Big Picture, this is where Buyers may keep stepping in, as a shake out & recovery. It just may not pull back deeply from here. And…
GDXJ WEEKLY – Do you remember my chart similar to this, pointing out where we could be when compared to 2016 as we leave a blue base behind? We are at the lows of a possible strong run higher over 2019. This is a weekly chart and it ran higher for months. I did catch the ICL in September, but after 2 months of choppy slop, I sold JNUG because 2016 had a final shake out low. This one did not, it recovered at the end of December.
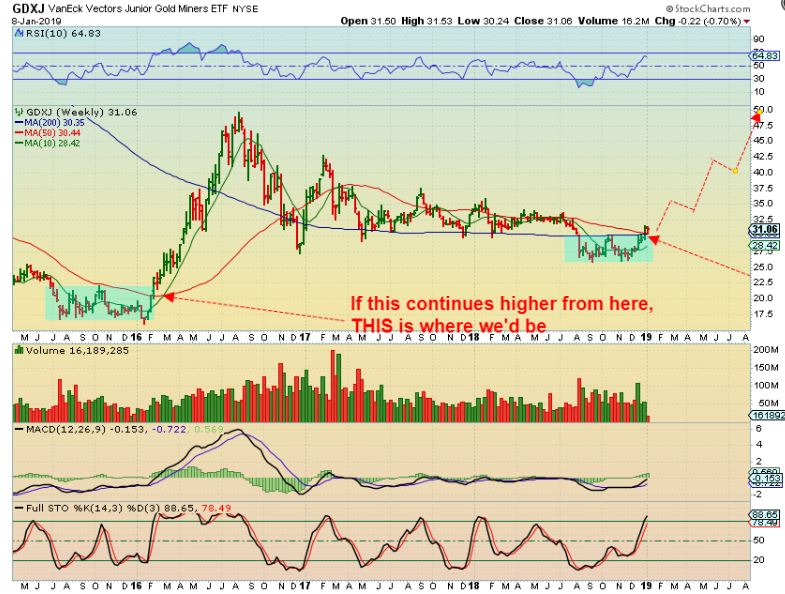
So looking at that above chart again. What can I say? I know that the daily cycle is due for a dip, but buyers do keep stepping in, and this should be a major support area for that reason. In Technical analysis, this is a buy with a stop under the 50 & 200 weekly MA. In Cycles, this is be due for a drop, but it may just go sideways. Look at 2016, and it just got choppy and went sideways at times when dcls came due. To buy, I’m not saying go all in leverage, but if you buy in this area, you can easily USE A STOP and start small. We are above support here. I will again discuss how various Miners are just doing their own thing right now…
.
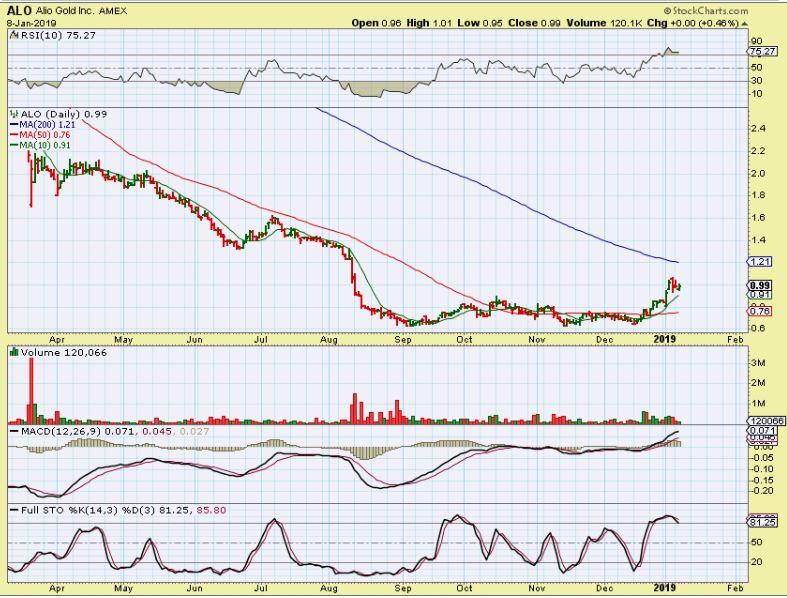
ALO – In December I pointed this out as a lagger that Popped and was a buy. I pointed out that these bases can actually produce a nice run .
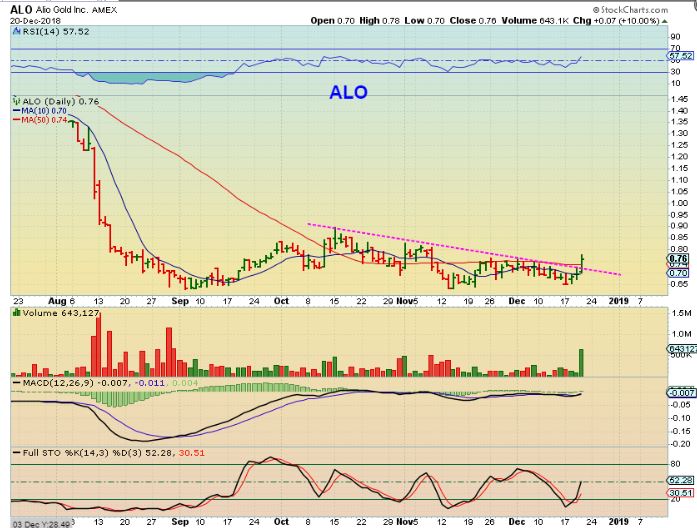
ALO – It ran and is now Bull Flagging. I then pointed out other stocks that resemble this set up, and mentioned that they could be bought as those ‘lagging stocks trying to play catch up’ ( Advice: a small basket to avoid individual risk, and you can also use a small position size).
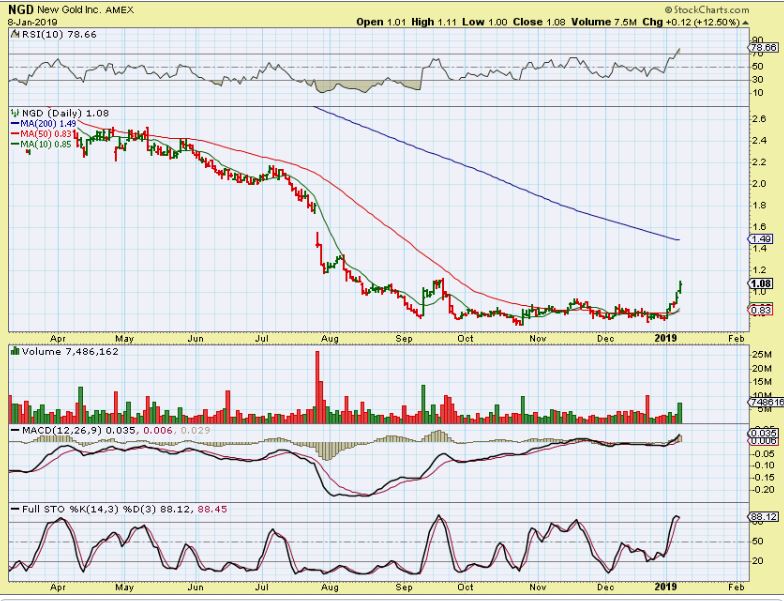
NGD – Here we go, JAN 3rd, a similar base as ALO was pointed out here and looking ready to go. It popped 10 % here and I was looking for a nice run to the 200 sma as possible over time.
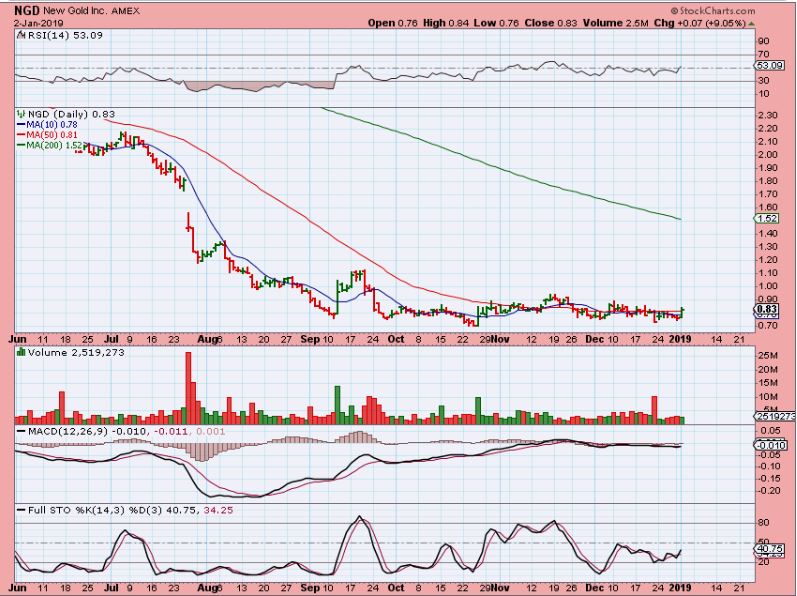
NGD – Boom Boom Boom- it is playing catch up, even on days when GDX & GDXJ were down. So I see that as an indication that some of these will act on their own, as buyers step in to accumulate.
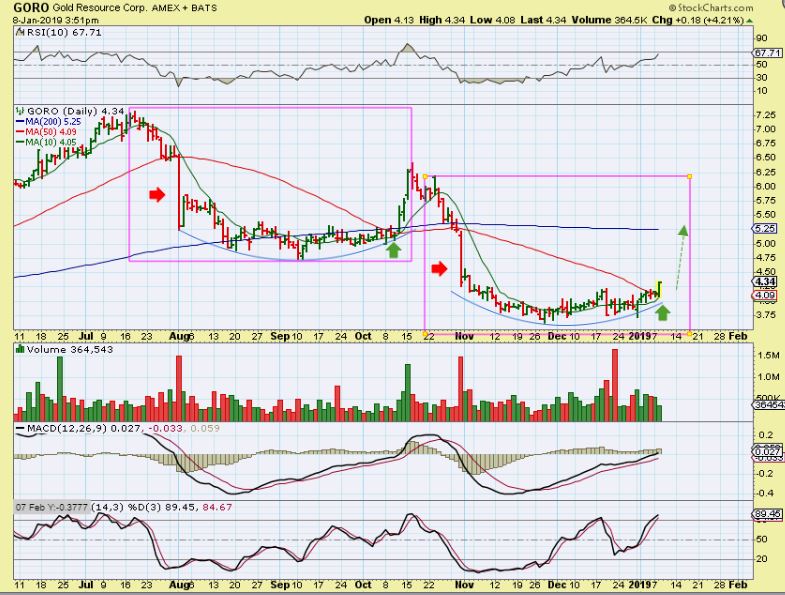
GORO DEC 31 – So I used this chart and said that it looks similar to ALO and NGD, but it needs a bit more sign of strength. I wouldn’t just buy a 1 day reversal, but…
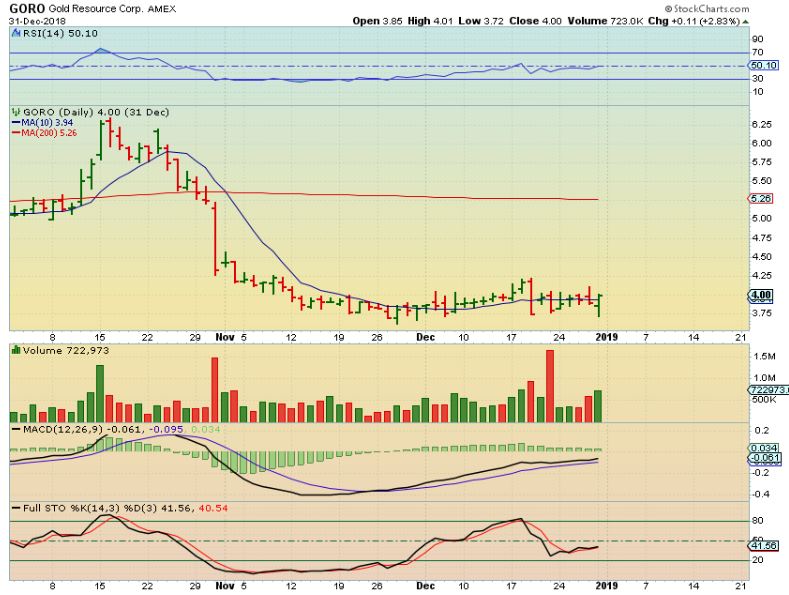
GORO – By JAN 4th, it then started Breaking from that base.
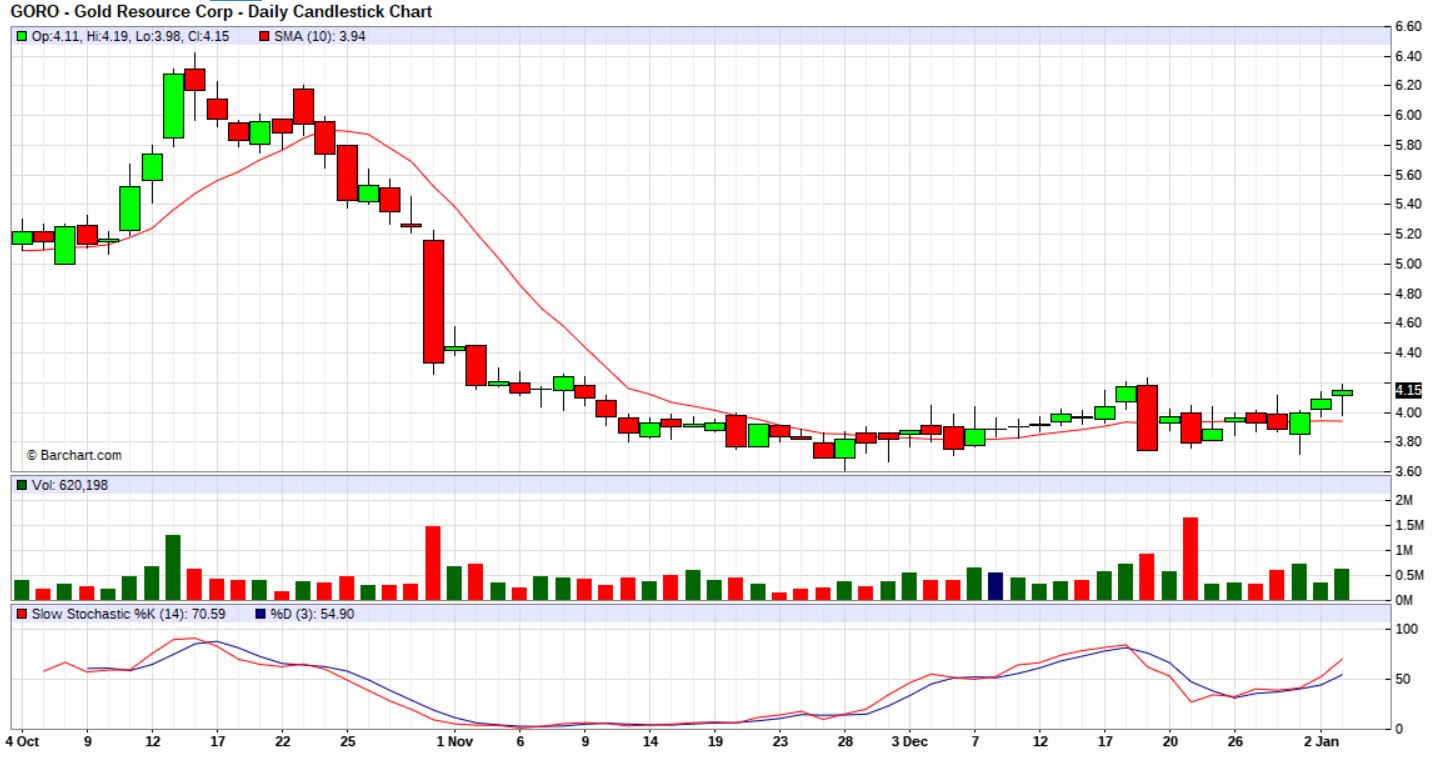
GORO – It started pushing on that 50sma, and Tuesday it POPPED above it. THAT IS A BUY. GDX & GDXJ were down at the time, they were pulling back, but GORO was being bought up. This is a buy, but I did notice the DEEP RED CRASH DAY every 3 months before the base (red arrow). That MIGHT be earnings, so be aware of the earnings date.
HL – HL was a BUY on JAN 3 too. It has lagged, and it was a Silver stock still at the very lows, MACD rising. Low risk, with a stop at the lows. $2.47
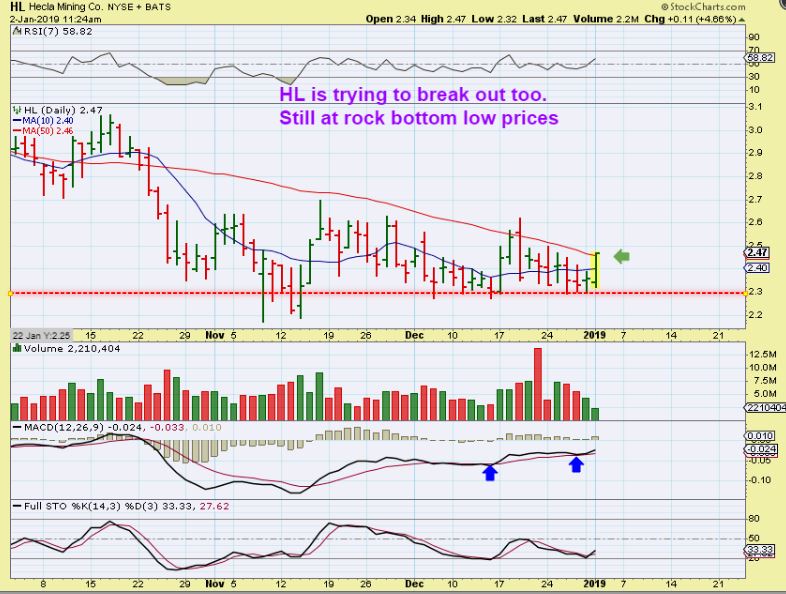
HL – It started flagging sideways and Tuesday HL has a 10 % POP. Again, this happened while GOLD, GDX, and GDXJ were down. SO IF CYCLES SAY GOLD & GDX Need a pull back, maybe some of these that didn’t join in on the run higher in December (laggers or Base building) will still just do their own thing in January?
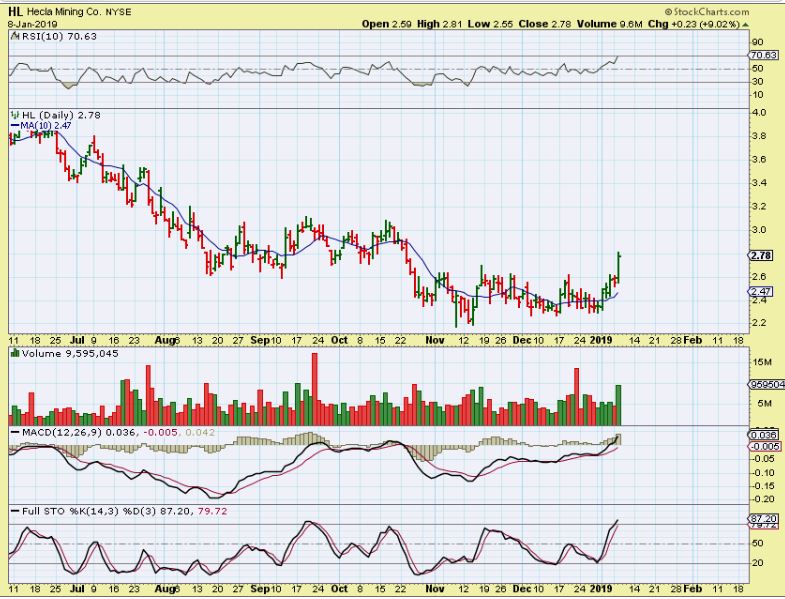
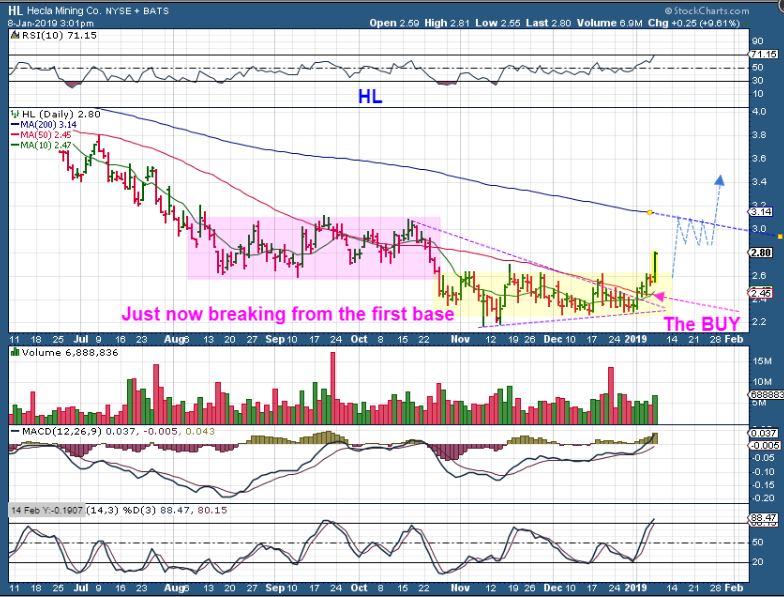
HL – It could easily run, crawl along the 50sma, and break out as shown here.
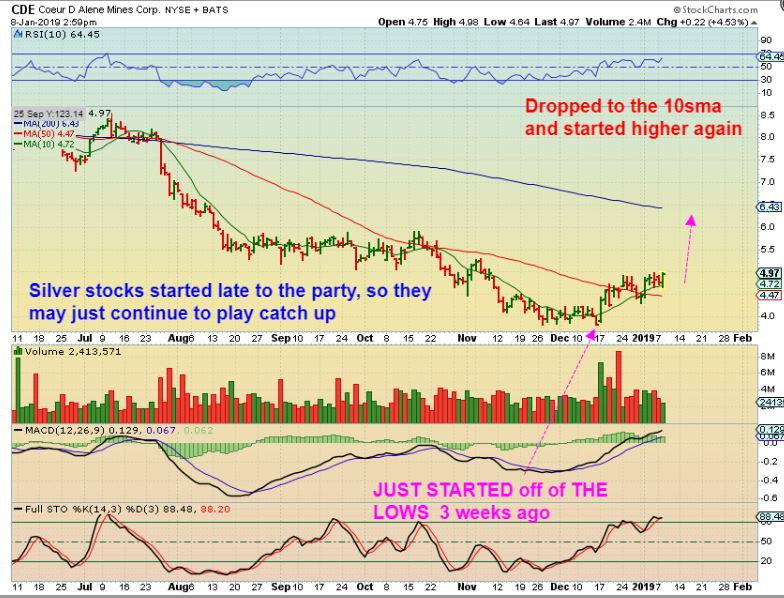
CDE – CDE has crawled along the top of the 50 sma, but sold off to the 10 sma & reversed a few times, SO I BOUGHT CDE Tuesday near the 10sma. I can place a stop under the 50sma, but I may just ride it and add if it dips.
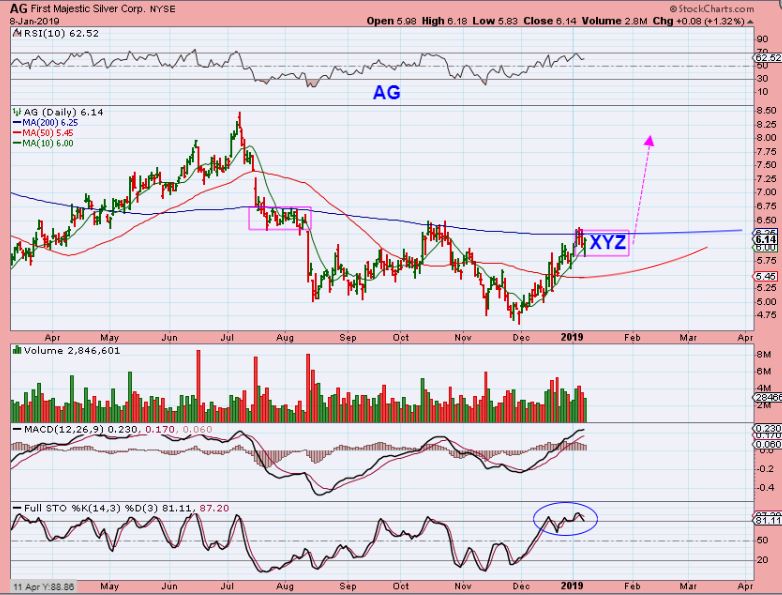
AG – Ag is one that did make a nice little run in December. It is in a double bottom base, and looks pretty good here. It dropped to the 10sma Tuesday and reversed higher too. This may just crawl along the 200sma, or it could break out.
1. If it drops to the 50sma & reverses? IT IS A LOW RISK BUY, with a stop under the 50sma
2.. If it crawls along the 200sma, and eventually pops through? IT IS A LOW RISK ENTRY with a stop there too.
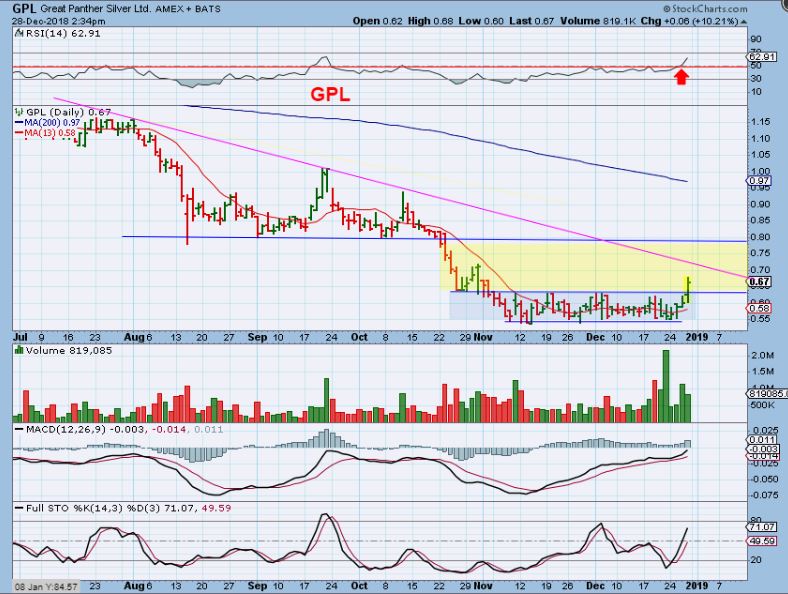
GPL – On Dec 28 , this was GPL and it was a BUY as it broke from the base. I did draw a down trend line near 70 – 75 cents that might stall it. Guess what?
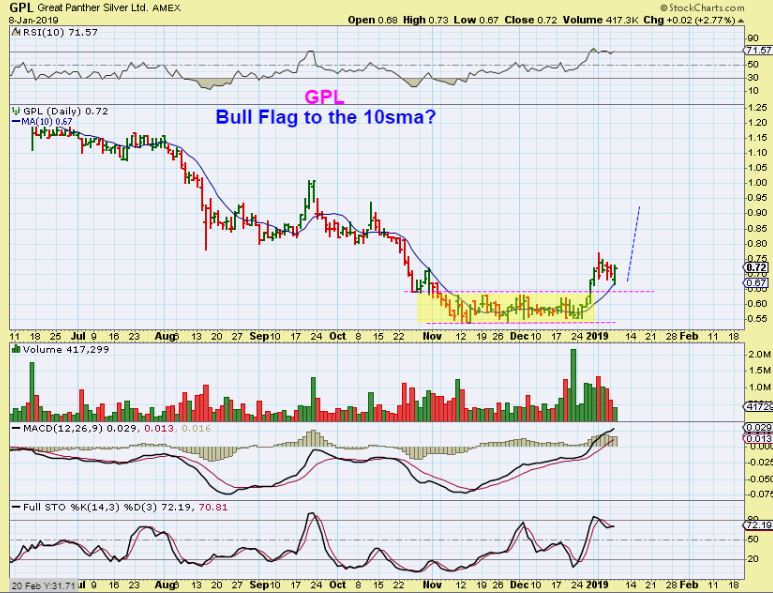
GPL – It has Bull Flagged at 70-75 cents cents and reversed after dropping to the 10sma Tuesday. This broke from a base and flagged and is a buy in this area if you ask me.
.
The General Markets and Energy Sector are climbing the wall of worry higher so far, as expected. I decided to lock in my leveraged gains for now on GUSH, but it can continue higher. I also may buy a dip if we see one, but I am still riding the Energy stocks. I own MJ stocks and Miners too.
.
So as mentioned in the report a week ago on Wednesday, we have had an adjustment in the way we are viewing this sector, correct? After the December Monthly Close & then the Weekly Close above the break down levels in GDX & GDXJ, we likely have had a ‘Big Picture Shake Out’. If that area is now supposed to hold up price as support, that can be the area where stops move up to. That is viewed as a recovery that could draw in Buyers and an area where shorts may feel that they need to cover if it doesn’t break back down. Please Re-Read last weeks reports Wed-Fri if necessary.
.
I am not ‘Chasing the extended stocks like KL, GOLD, AEM, AU, etc. I want to see if the Leaders do normal pull backs and offer lower risk entry. If some of the ‘Leaders’ pull back, they can be bought, but some of these Silver stocks were lagging, caught inside of bases until Silver started playing catch up. They are Popping 10% here and 12% there, and that is more than JNUG has done lately. Again, a small basket to lessen the individual risk, position size is important. FOR EXAMPLE: One can always start small positions at lows, and add after they get above their 50sma. Add again if they make it above their 200sma, so that you are slowly growing your position size After it proves itself.
.
It is also tough to own leverage here as things chop sideways and GDX or GDXJ may try to drop a bit, but I may discuss leverage again as time goes forward.
If we Do get a bigger pull back to the GDX 50 sma, certain traders may consider a leveraged ( JNUG or NUGT) entry with a stop, but this may just go sideways if buyers keep stepping in.
.
Enjoy your Wednesday trading , WATCH FOR THE OIL INVENTORY REPORT AT 10:30. It did NOT hurt Oil last week, but I just thought that I would remind everyone of that report. Oil actually looks like it still wants to continue higher.
.
~ALEX
.
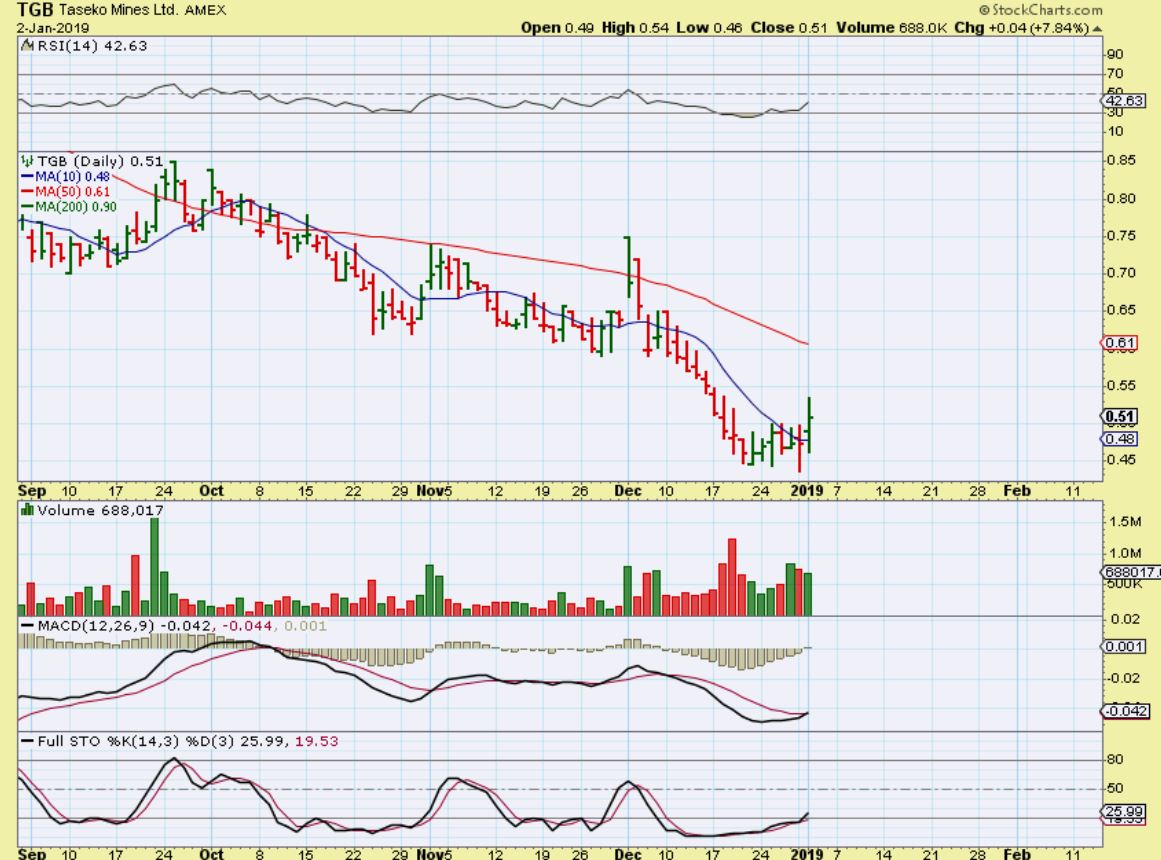
TGB – The BUY Jan 2nd, as Metals began to pop.
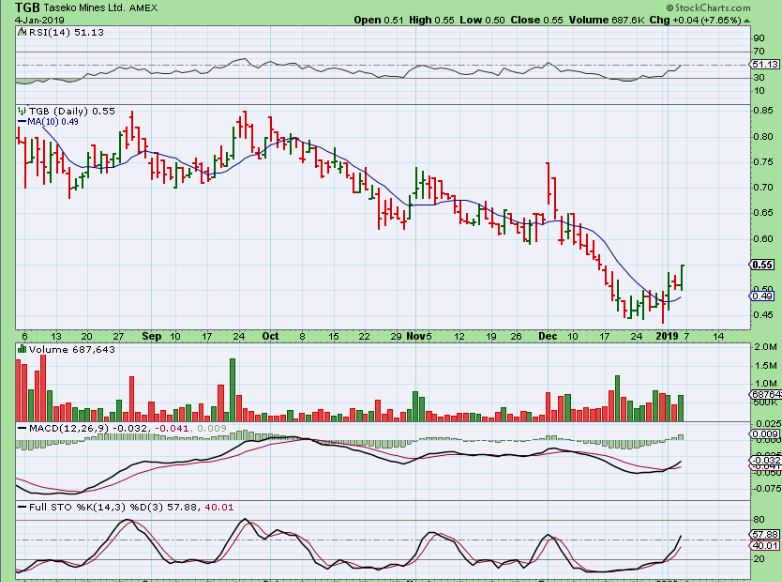
TGB – Continuation, still a buy, along with CLF, X, AKS, etc
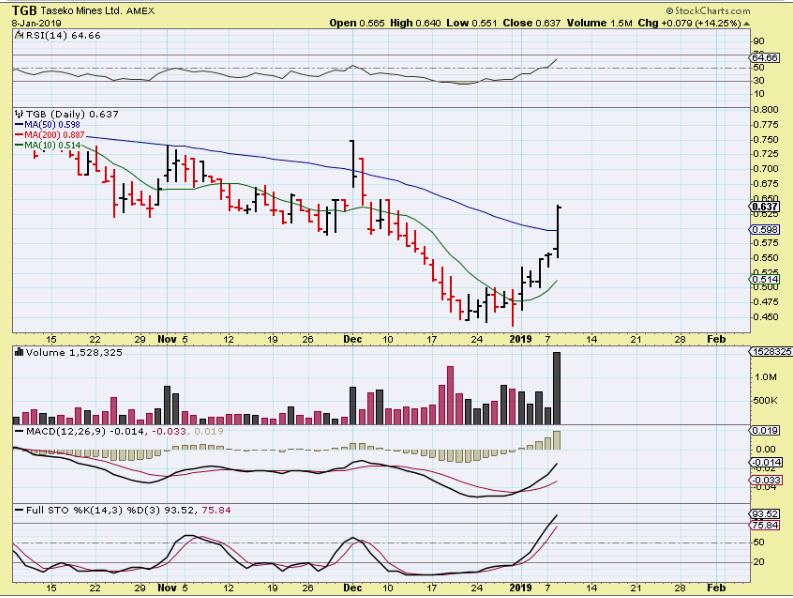
TGB – Who needs JNUG? 🙂 I dd not take this trade, but congrats to those that did. It broke the 50sma, so raise your stop there if you wish. WRN actually popped like this and dropped to the 50sma Tuesday, so you may want to look at that chart and see what it does Wednesday for comparison sake.
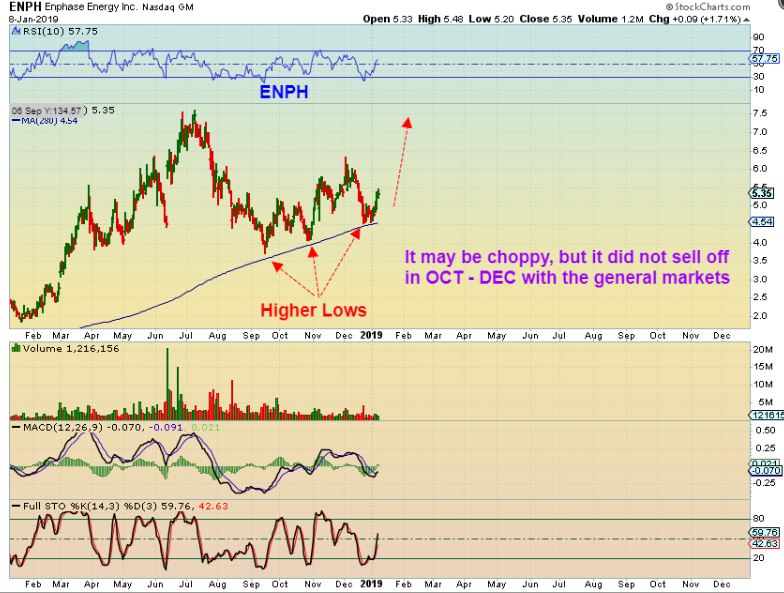
ENPH 1– Our old friend ENPH, which has made me some good steady BUY & HOLD gains in the past, looks bullish again. Let’s zoom in…
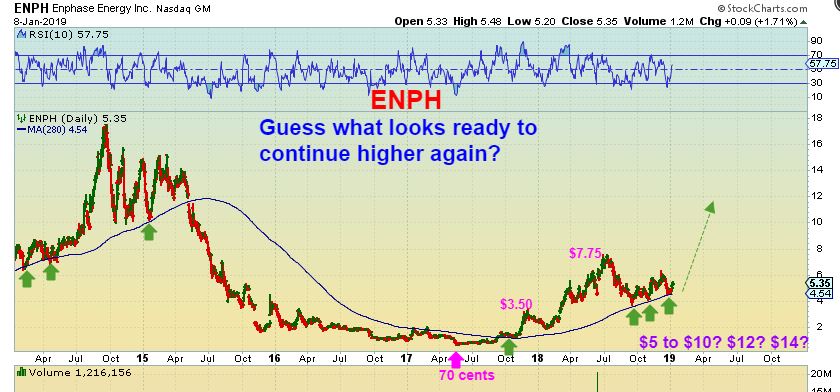
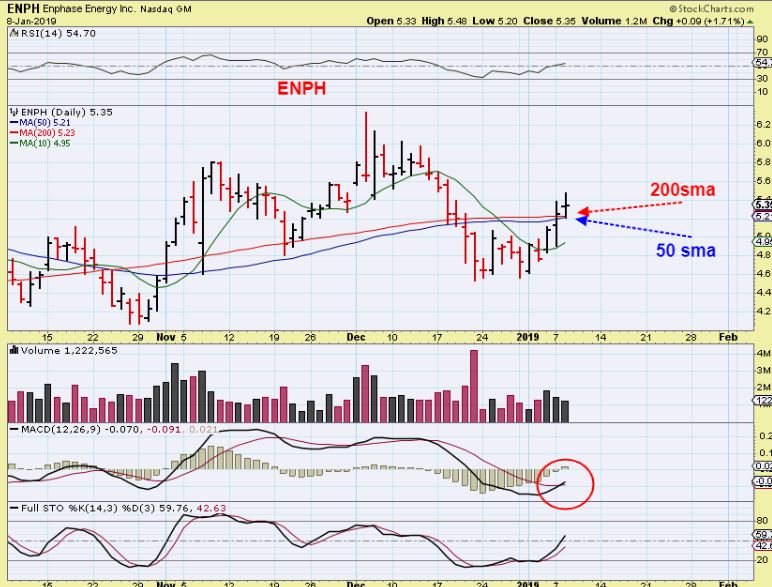
ENPH 2– Unfortunately, I didn’t catch it on the moving average that acts as major support , but it can still be purchased with a reasonable stop . I will show you why shortly, but first, doesn’t this look like it wants to run from $5 to $7.50 , since it has higher lows and higher highs? And…
ENPH 3– Zoom in. The 50 & 200 sma are actually tightly riding together, you can place a stop under that 10sma and hope that the 50 now acts as support.
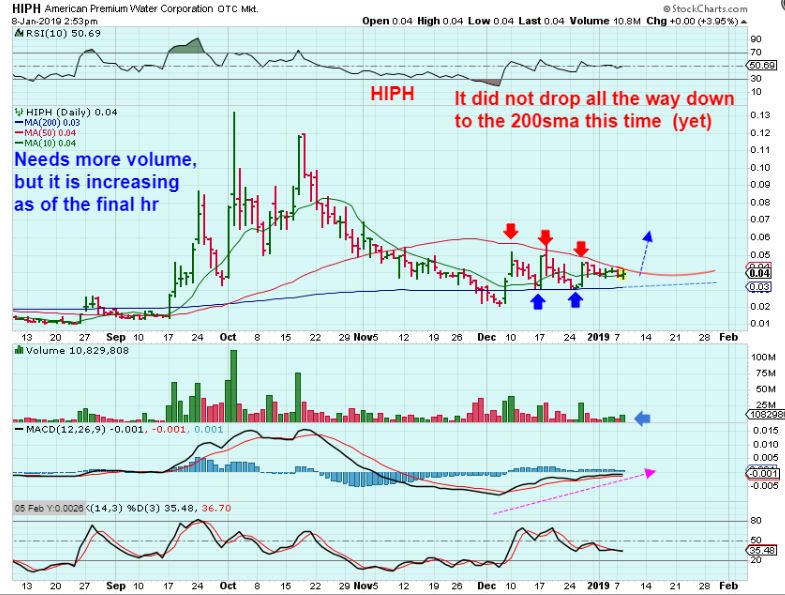
HIPH – This has been bouncing off of the 200 sma and bumping into the 50 sma. I own it. It is Pinched and should break out, but we’ll see. Volume was a bit larger by the close.
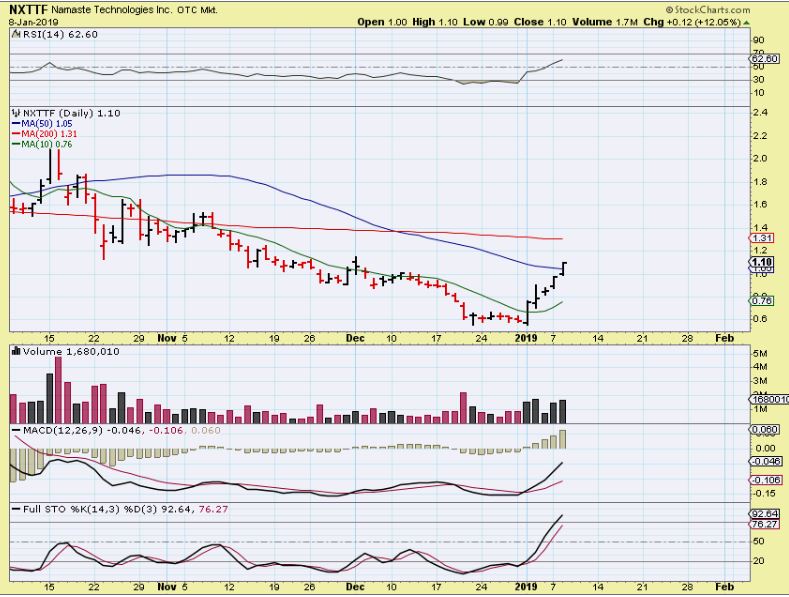
TRTC – This trade from yesterday is playing out well too. It was up 13% at one point, but closed up 9.47%. I compared this to the NXTTF trade that had a similar base and was running to the 50sma too. Well…
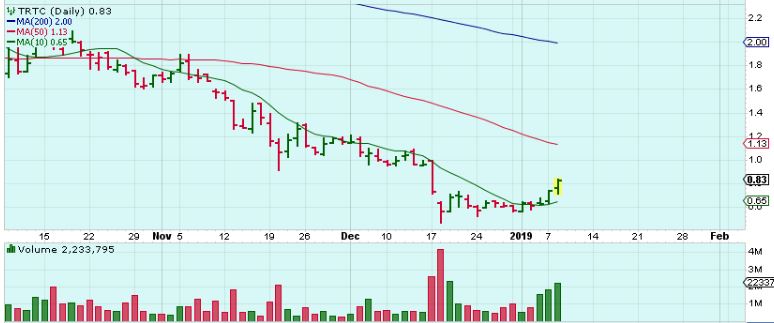
NXTTF just kept going, from that base right through the 50sma, up another 12%. I look forward to seeing if TRTC can also continue on through the 50sma. Several of these MJ stocks leaving their bases have done that now. This may stop at the 200 sma though.
KEG – Watch list?

