WEDNESDAY – Bouncing Along
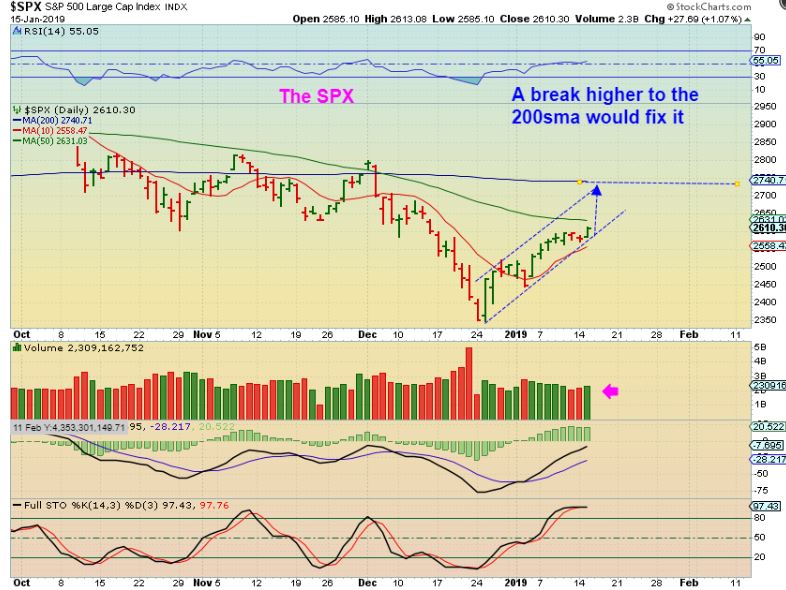
SPX 1 of 3 – After the pause that we expected under the 50sma, the equity markets actually look ready to break higher already, so
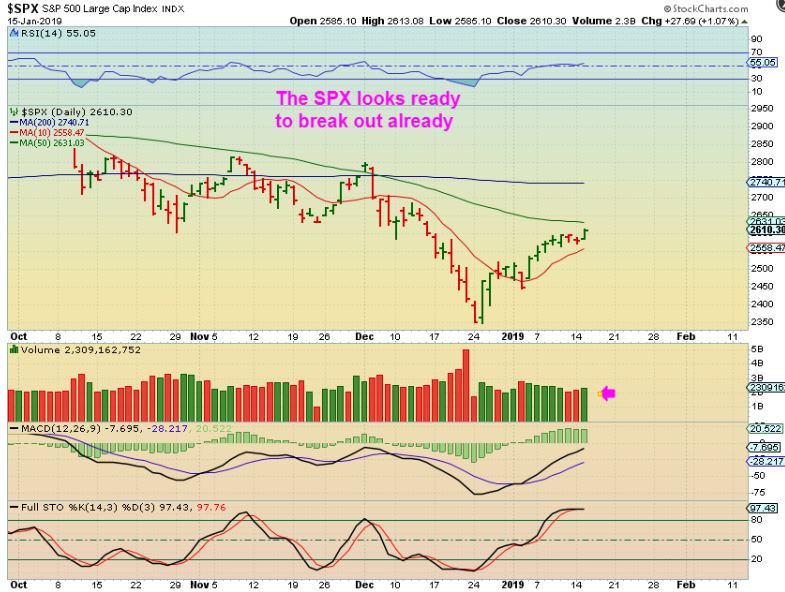
I want to show you these 2 charts …
SPX 2 of 3 – I was looking at a possible rising wedge. This would cause a break down, but could this just break out higher? …
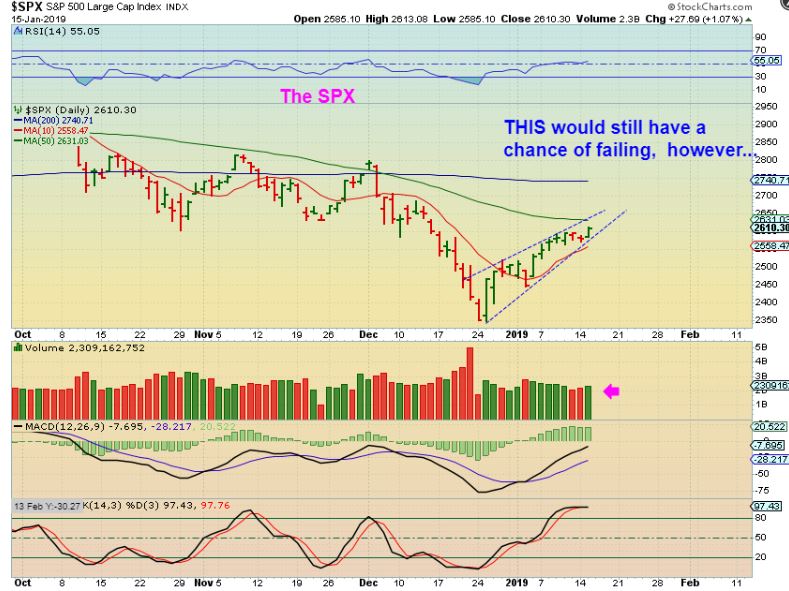
SPX 3 of 3 – Yes, I have seen this at times, where the break higher just forms the upper channel line. So IF this is ready to now run tot he 200 sma, it is a buy either here at the 10sma, or with a break out above the 50 sma. This does look Bullish in many ways and if we are coming out of an ICL, we need to expect strength early on in this first daily cycle.
.
From Yesterday …
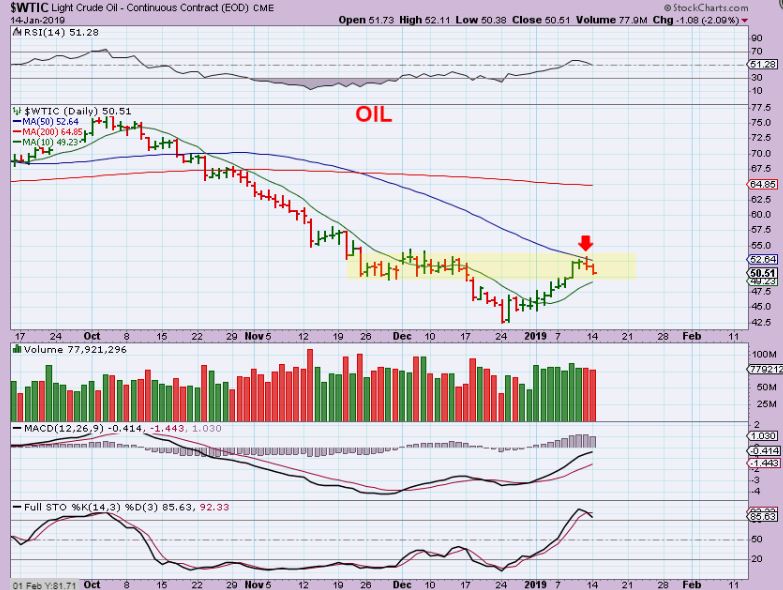
WTIC – Oil paused as expected too. It is at resistance, but I think that it will break higher in time too. Watch the 10sma for possible support.
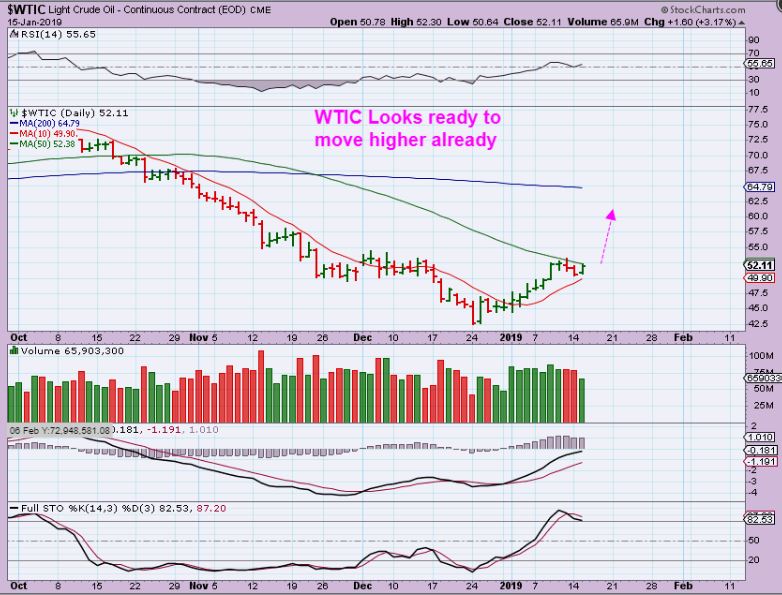
WTIC – Oil reversed on the 10sma. Wednesday is the Oil Inventory report, and I must say that OIL looks ready to break out. I thought that it could go sideways for a bit longer , due to the sideways chop as resistance on the left, but this does look bullish. A bullish inventory report could cause a break out or further consolidation. A break out could be bought expecting a run to the 200sma ( UWT, OILU, GUSH, etc).
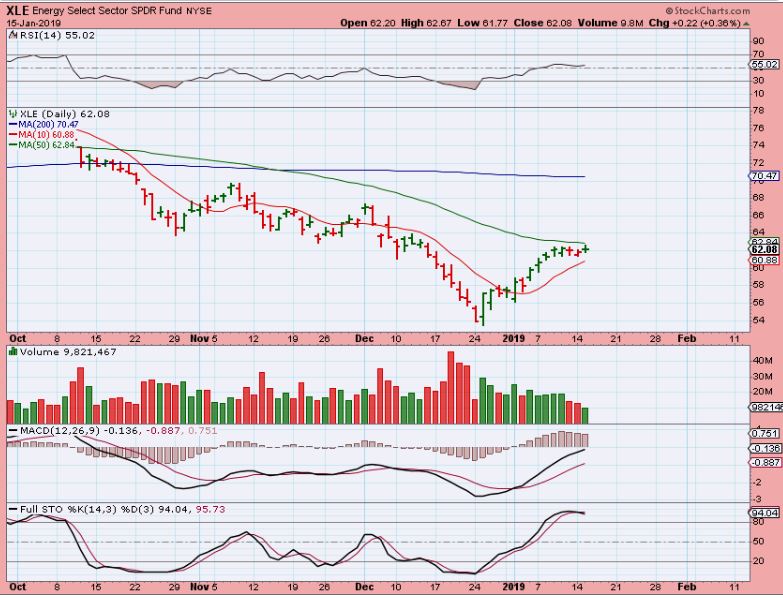
XLE – This is NOT quite as bullish looking as Oil ( Volume is lightish), but that can change if Oil Breaks out. Energy stocks actually look bullish…
From Yesterdays report
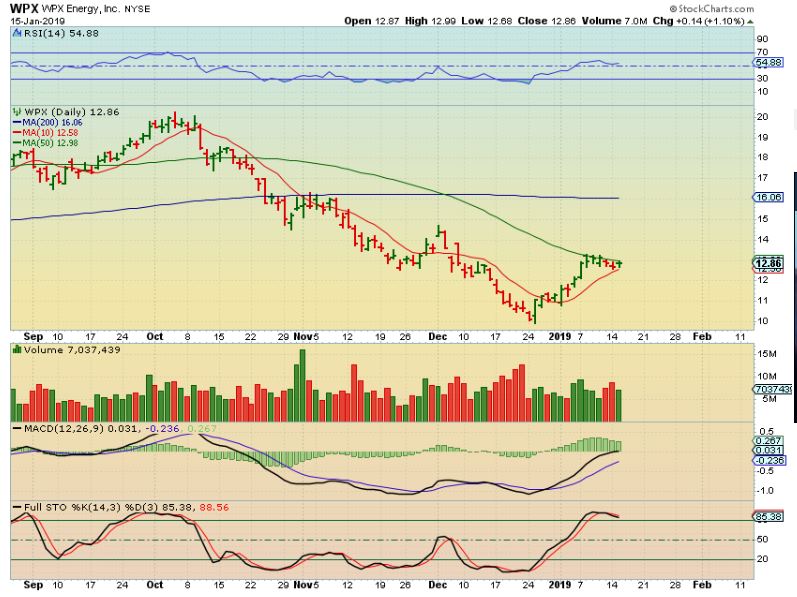
WPX – WPX is hugging the 50sma, and so are many other Oil / Energy stocks. See also LPI, DNR, OAS, AREX, AXAS, etc The sector looks to be setting up for the next leg higher.
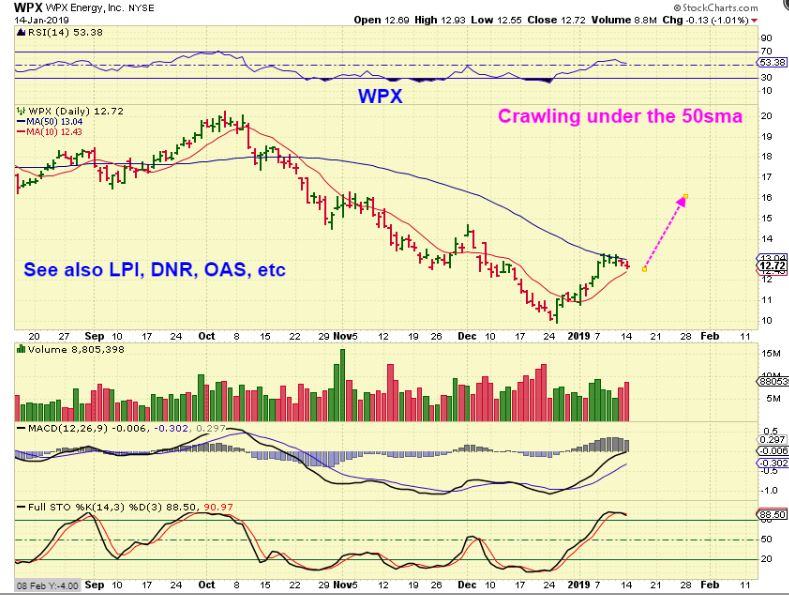
WPX – So this looks like a Bullish crawl under the 50sma. I think that it is going to break out if Oil does. Then you can add to your current positions (or start a new one) and put a stop under the 50sma. See also WLL, WTI, LPI, OAS, AREX, AXAS, etc etc
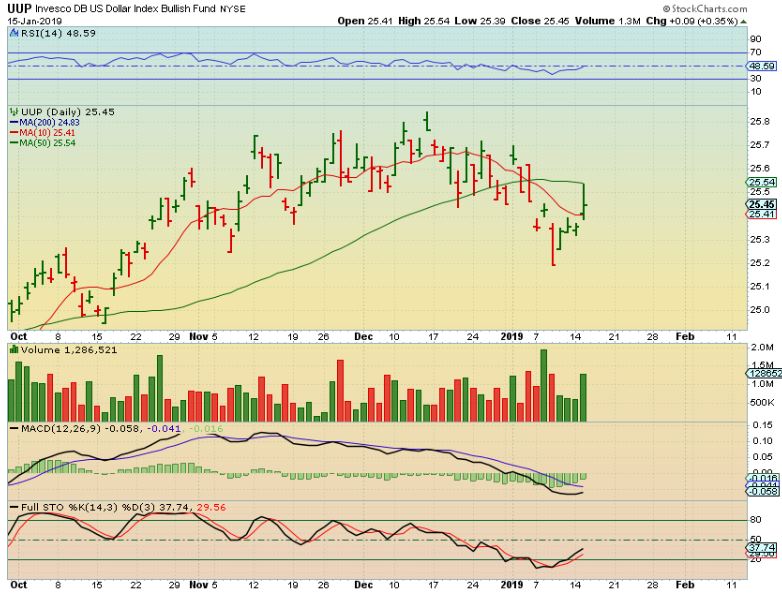
UUP – FROM YESTERDAY
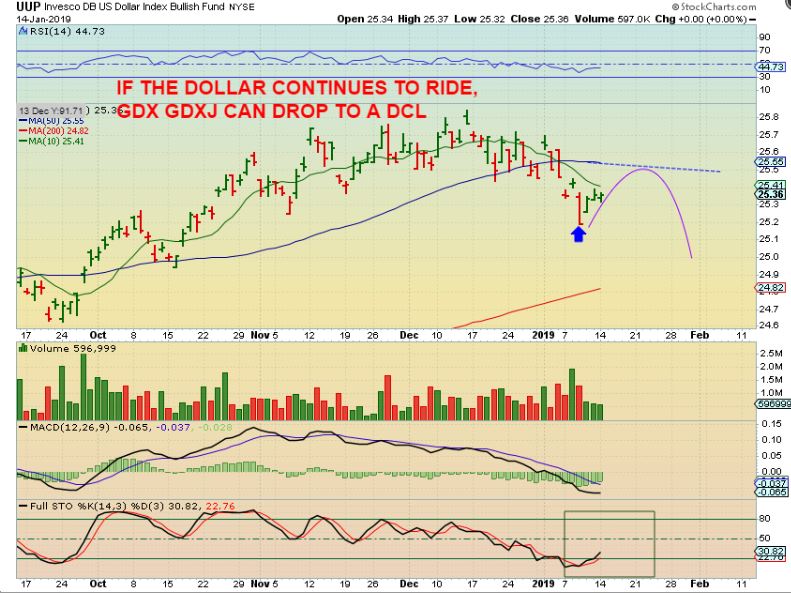
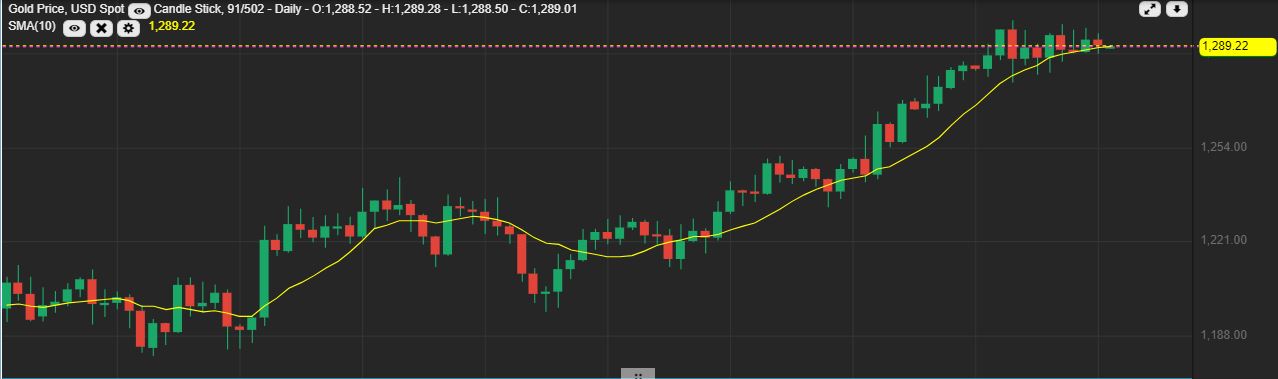
UUP – This DID Pop and GDX & GDXJ DID DROP. Interestingly, GOLD and SILVER did not drop much, but some Miners sold off hard. Let’s take a look…
GOLD – Gold looked fine
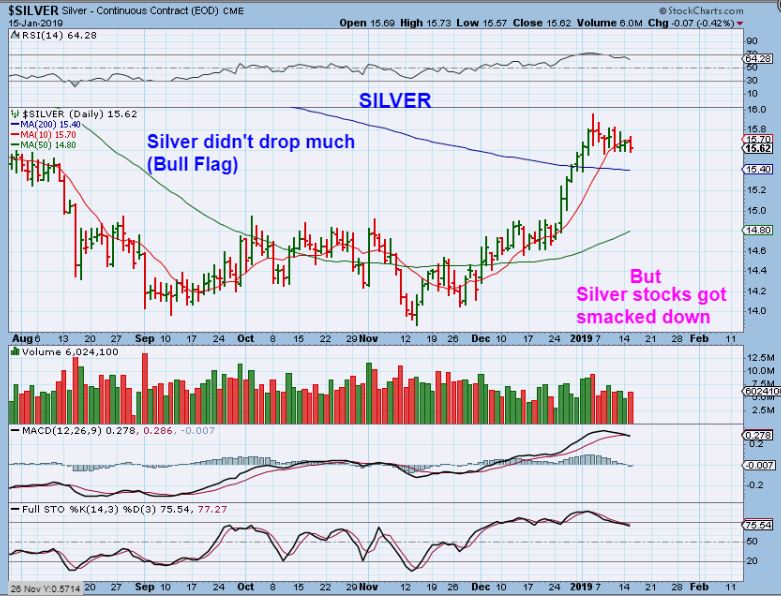
SILVER – Silver looks like a Bull Flag, but Miners?…
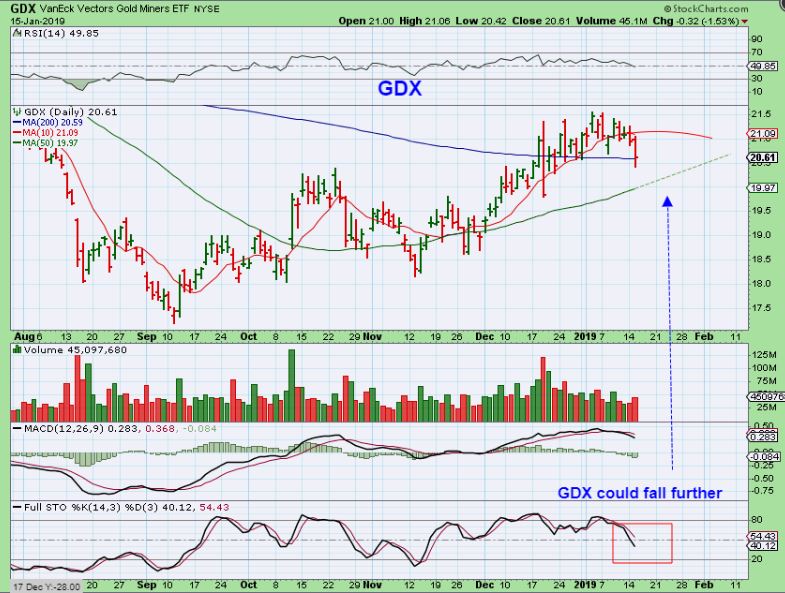
GDX – GDX broke the 200sma and recovered, but this can still sell off further. And look at the Silver Miners…
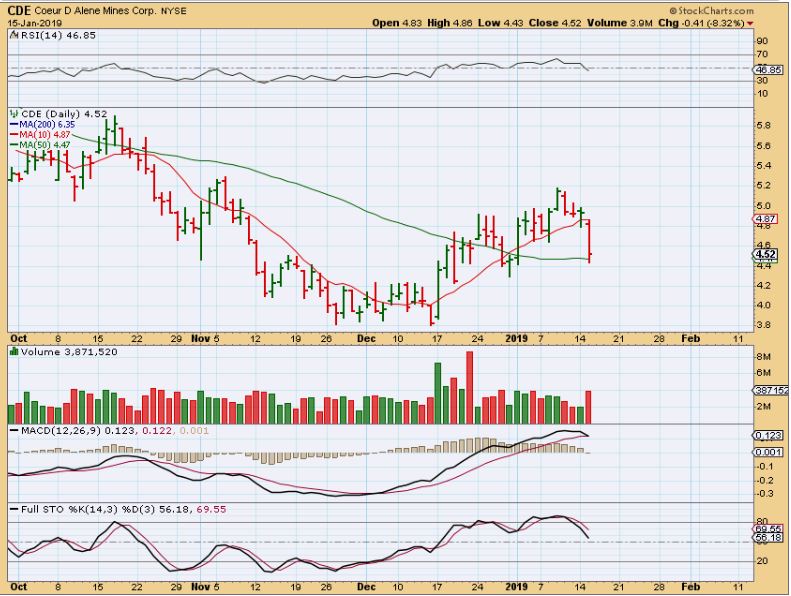
CDE – Silver has a Bull Flag but Silver Miners sold off. AG sold off especially hard.
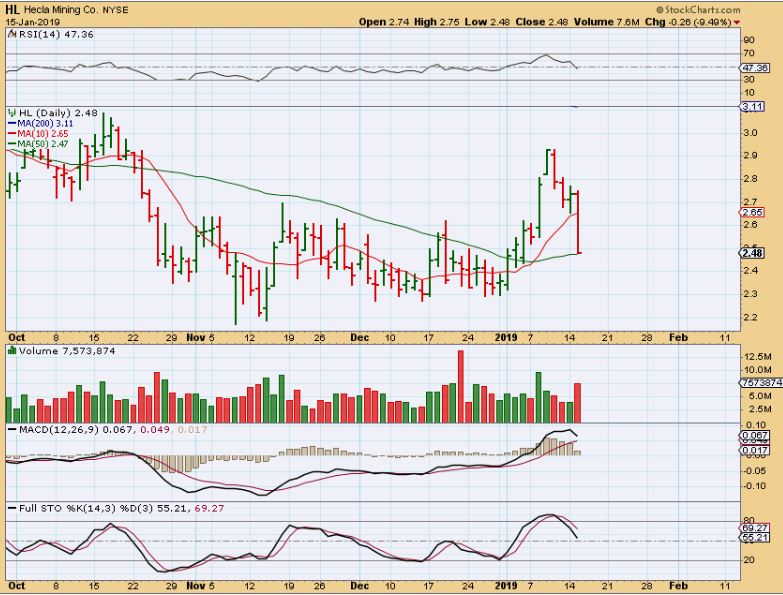
HL – Big drop.
PAAS – Dropping to the 50sma?
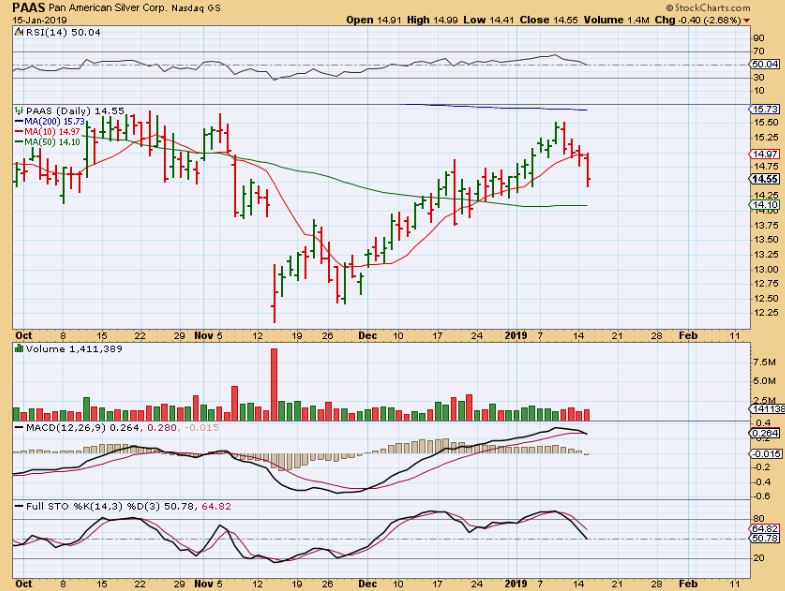
So on the Miners that are dropping, they may go to support levels and reverse. I will watch them on the way down. Look for a reversal at the 50sma or support if you are in front of a screen during the day. I consider those a BUY with a stop under support.
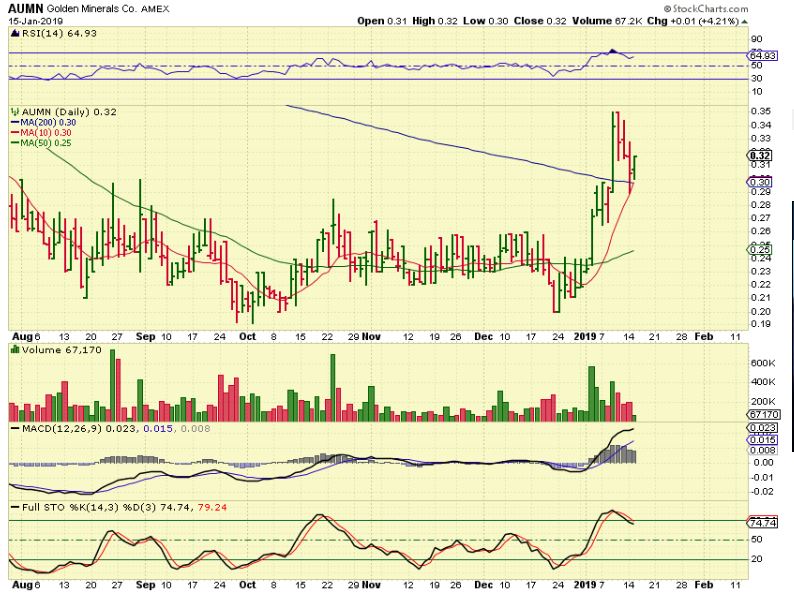
AUMN – AUMN actually dropped to the 200sma and reversed higher. his may not get through the 200sma.
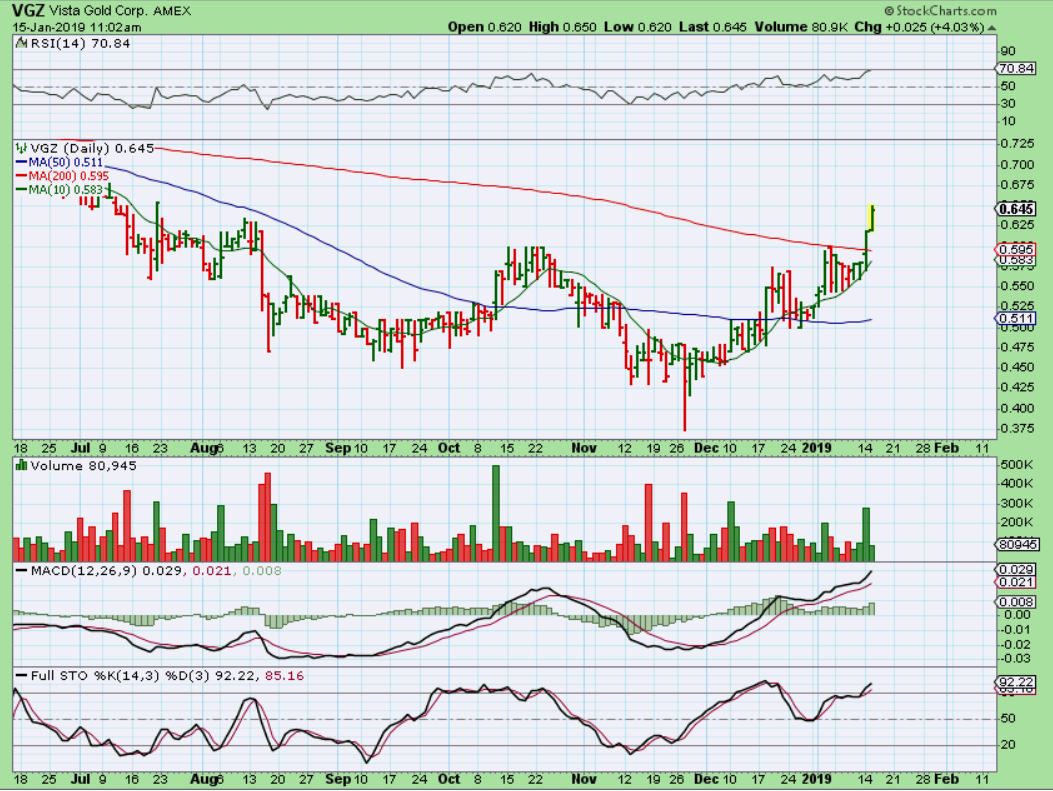
VGZ – Yesterday I pointed out the VGZ break out and it got some follow through, so things are still a bit mixed with Miners as GDX & GDXJ continue to chop around for the 4th week now.
.
Are Miners leading the way, and Gold & Silver will follow? Or are Gold and Silver going to break out of that bull flag & get Miners to reverse higher? It is not possible to tell, so stay tuned. I discussed the charts of AEM, TRX, GPL, and a few others yesterday too, but it is still a mixed set up in this sector as shown above. We are waiting for this consolidation to finish playing out.
.
I pointed out a few charts & trade ideas in yesterdays report . We should finally be dropping to the DCL for Miners, and The General Markets and even ENERGY may be setting up right now as a buy. The trading has been very good, so I will review a few more stocks below.
Enjoy your Wednesday trading ( watch Oil in the Morning, the Energy stocks may start another run higher).
.
~ALEX
.
A few side trades discussed recently
.
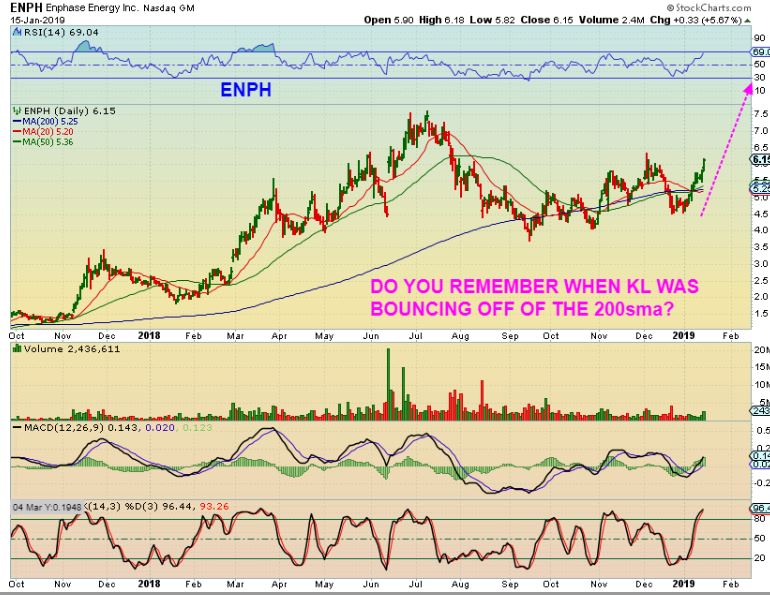
ENPH – I have been pointing this out since the 50sma, and it just keeps climbing higher. It actually closed at $6.15 and if you bought it, I’d ride it . Monday it was still near that 10, 50, 200 sma stack and this can keep running from here.
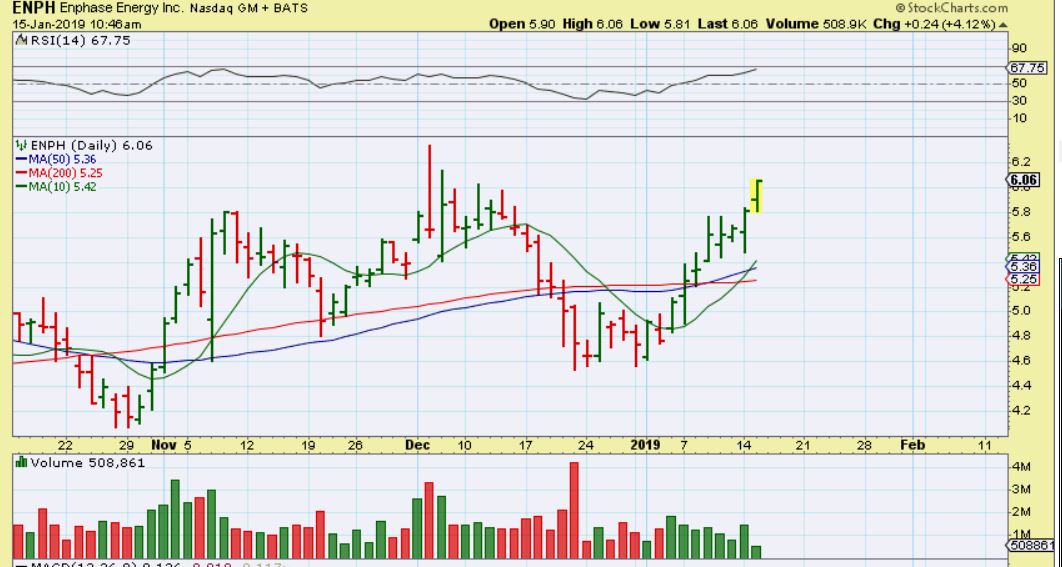
ENPH IS LEAVING THE STATION: It reminds me of KL, when it bounced off of the 200sma. Soon this may be too far away from support to buy comfortably.
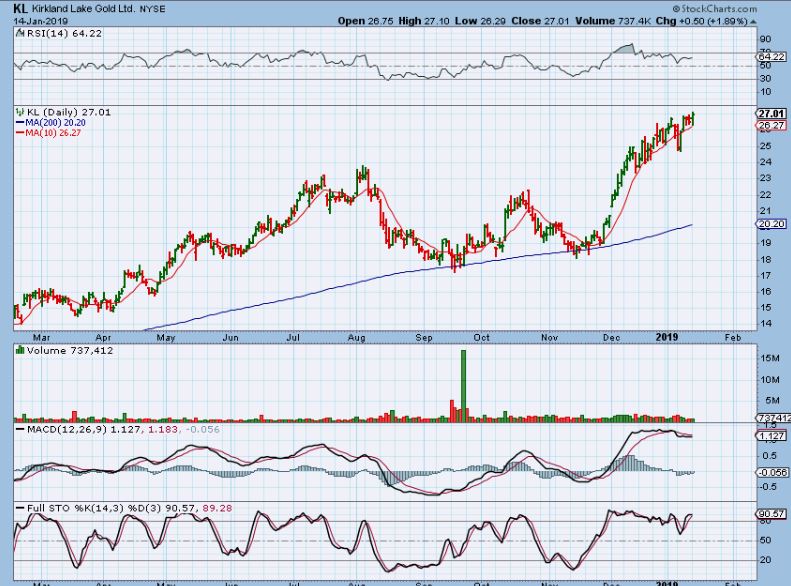
KL : Example of how KL was at the 200sma for a while too, then it just kept rising.
.
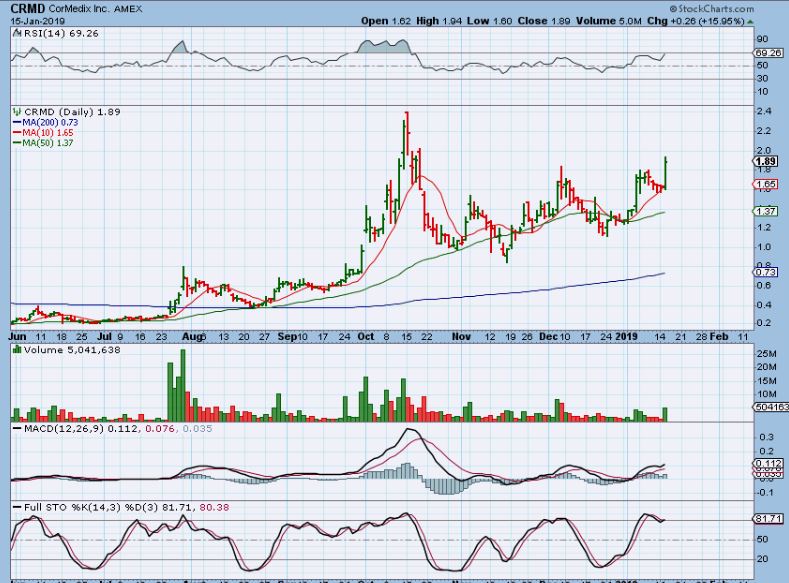
CRMD has been a buy as it holds support at the 10 & 50 sma, but it is a choppy one.
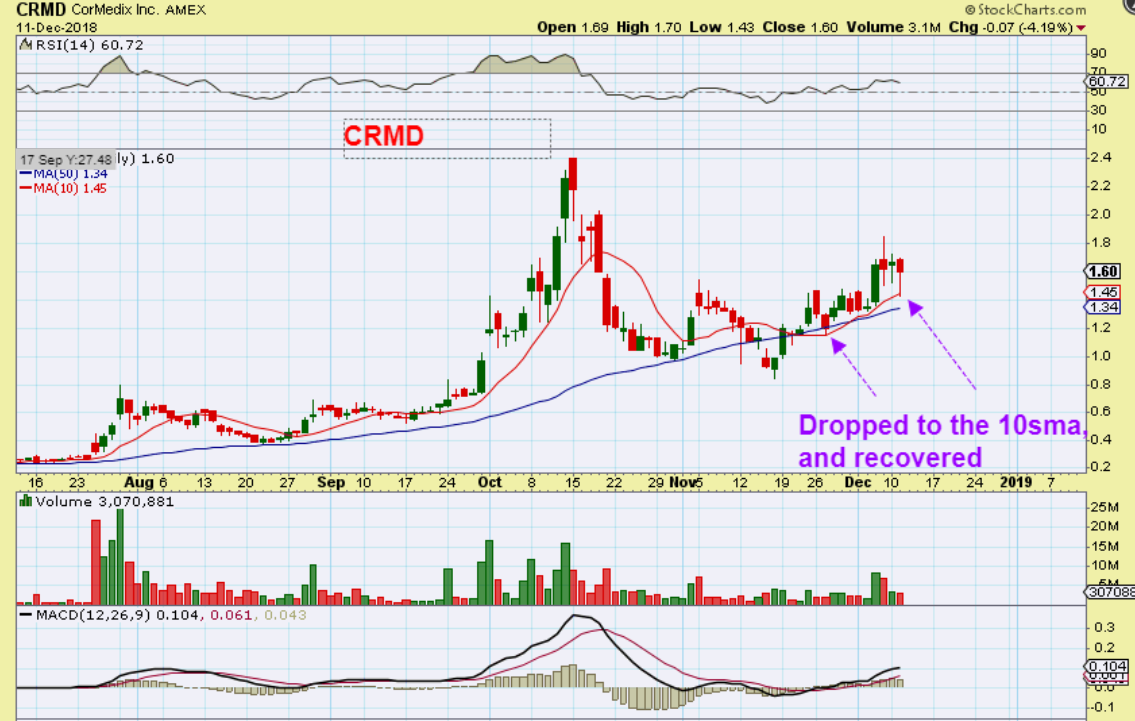
CRMD – After this long consolidation, it could make a nice run and begin trending higher. It has not been a smooth ride for months, but it is maintaining higher highs and higher lows.
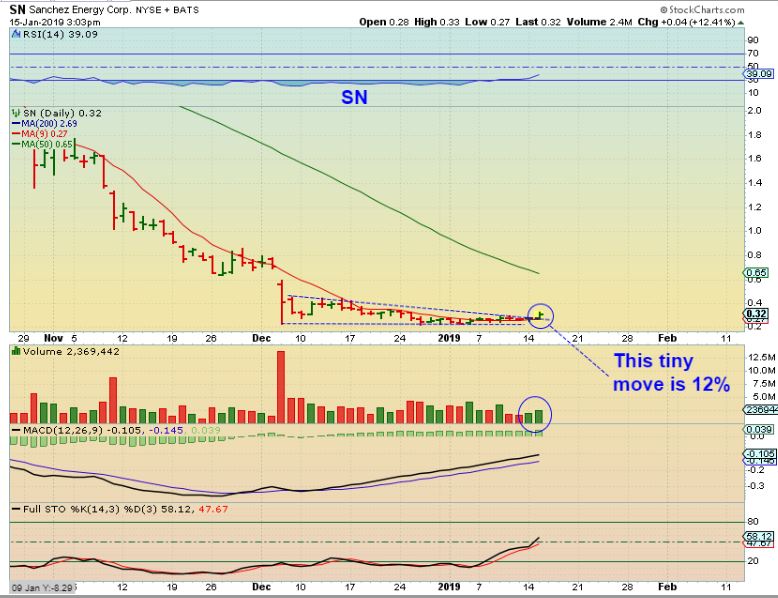
SN – I started pointing out SN in the comments as a base that had a good look to it. It started breaking higher so I actually bought it for a short term trade. This TINY pop was already 12%, but this can move much higher. so…
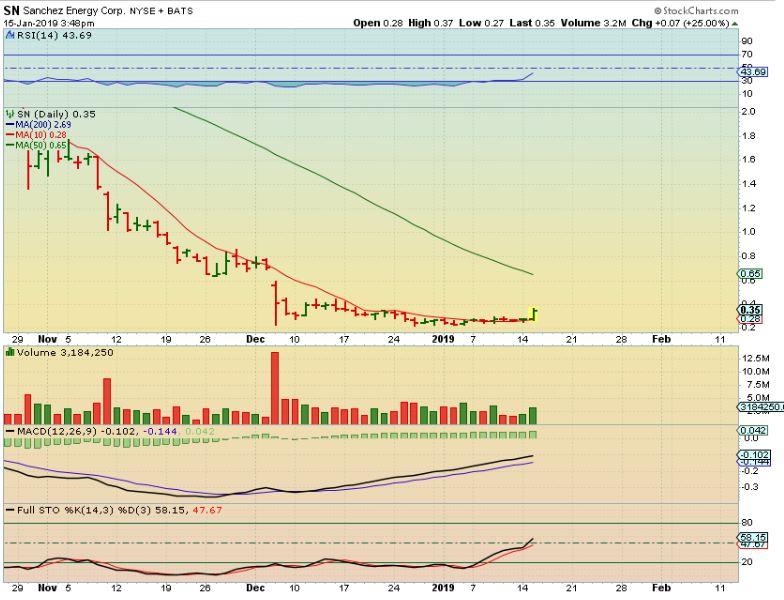
SN – I LOVE BASES. It closed up 25%, but this looks like it just wants to run right to the 50sma, and that is almost 100% from here. NOTE: This has its own risks. They got a notice of de-listing, but they have time ( 45 days I believe) to submit a plan to avoid that and then they can get an extension, so I think that that is not an issue at this point short term. I just throw a small amount of money that I can risk for the reward of a possible 50-100% gain. DO NOT RISK TOO MUCH.
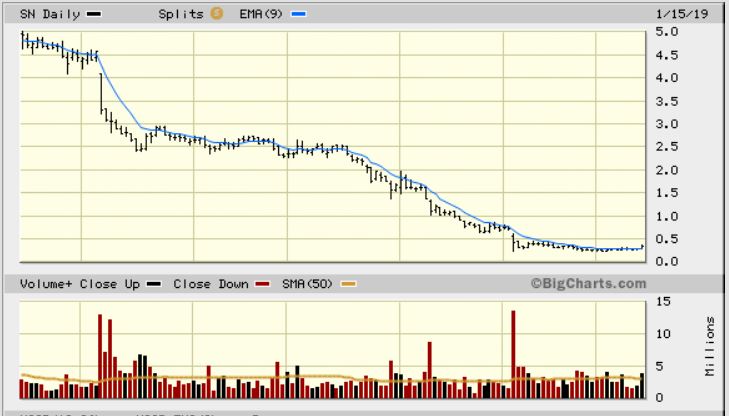
SN – This is a different way of looking at it. SN crashed with OIL and hasn’t recovered, it based out. In august it traded at $4. 50 It is HIGH RISK, due to a possible delisting, but also it has the potential to recover some of this crash and the higher volume POP yesterday could start things off. It still trades on the NYSE, so it is easy to get in & out of. Again, if trading this, just start a small position. IN FACT…
.
IN FACT: A LESSON RELATED TO THE SN or OTHER LONG BASE TRADES
.
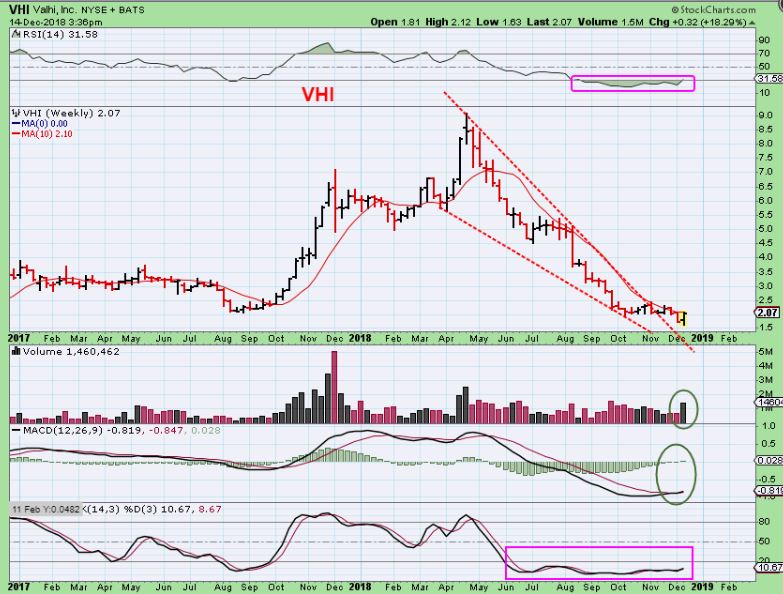
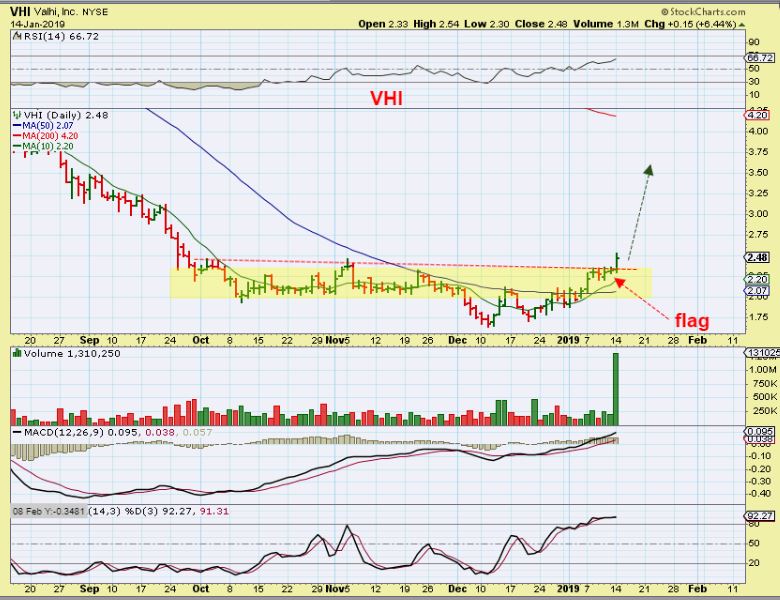
VHI – This was my very first chart of VHI. It started to base after breaking a down trend, and upside potential was big. It had a High Volume POP and I liked it. I had no idea how early this was ( Dec 14), but…
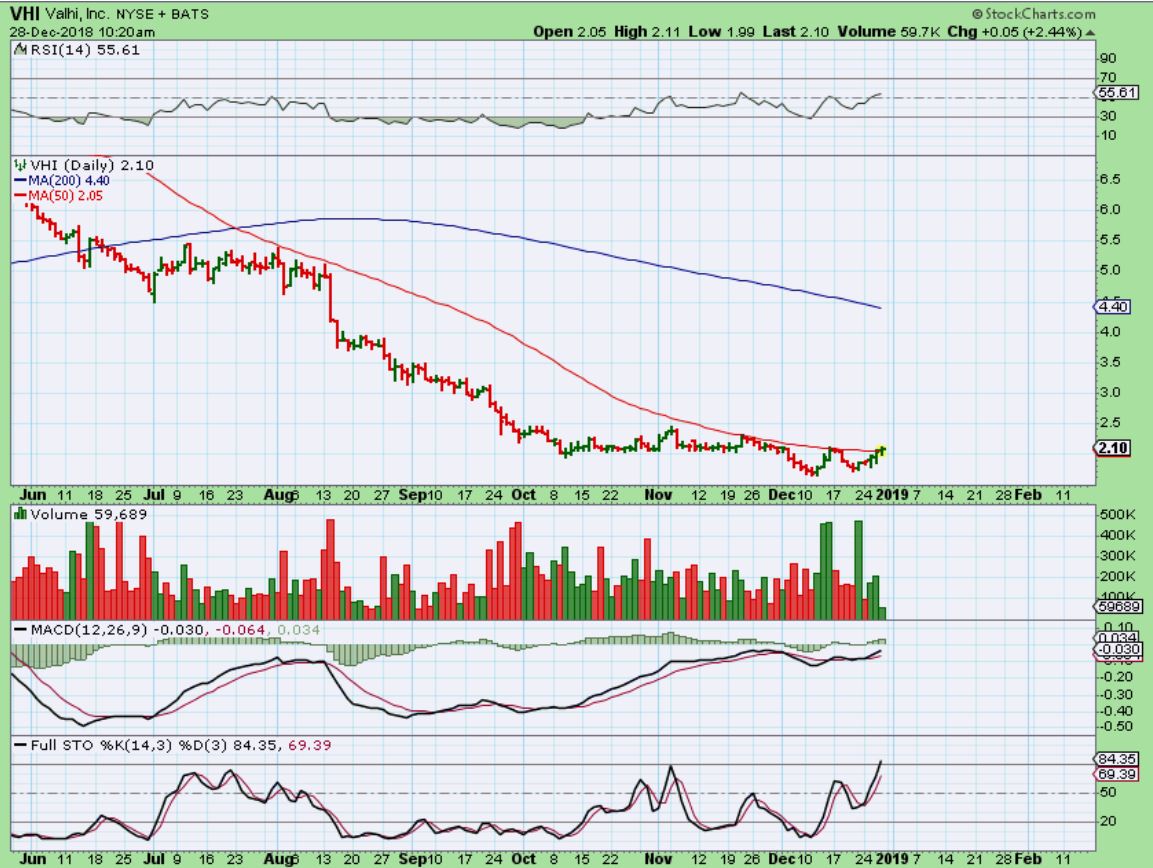
VHI – I love those bases! I Love high volume POPS in bases even more. So I have 12 charts of VHI from prior reports, but we’ll skip to DEC 28. where I thought that this was ready to go at that time. This pop was a Buy. This may be similar to the SN pop, but…
JAN 2- The base continued! This crawled along the 50sma, but was finally about to break. THIS POP WAS THE NEXT BUY.
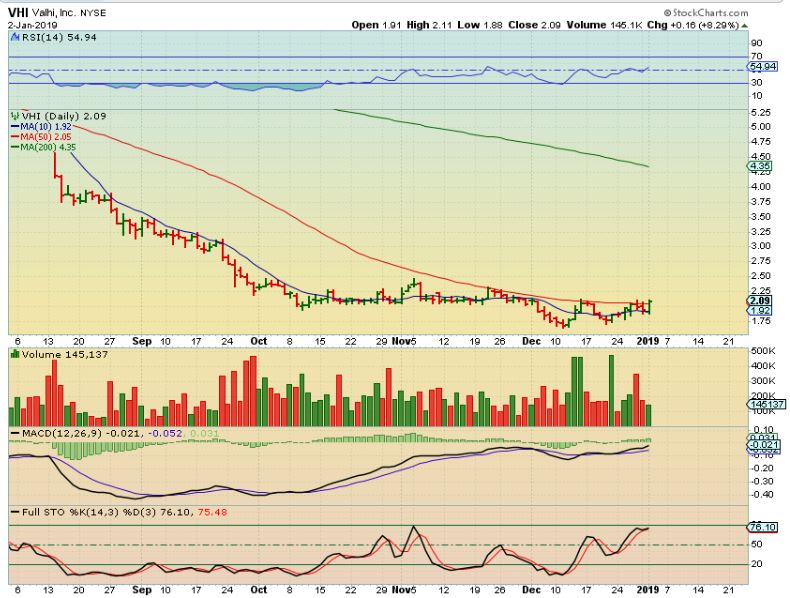
VHI JAN 7 – Still basing, but now we were seeing more of a Break from the base ! Now the run?? …
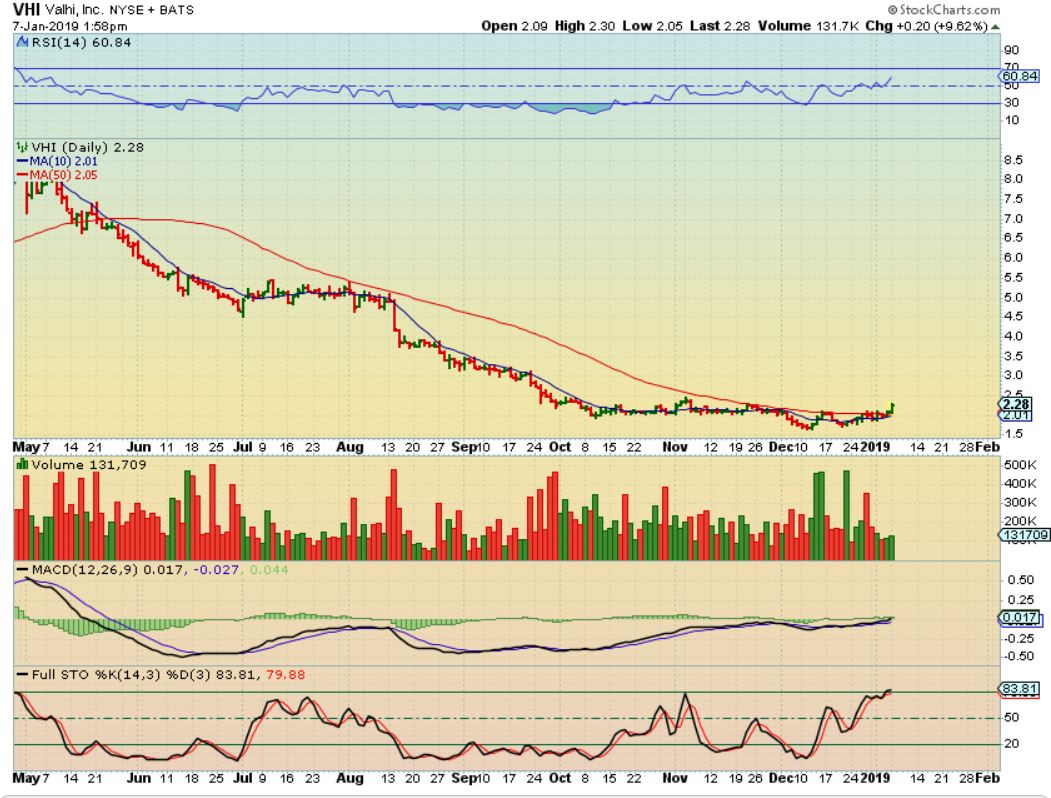
Not straight up – it Bull flagged & then Popped again. So when I looked at SN and I say that it looks ready to go, this shows that at times these bases just take more time. VHI kept popping up, but also continued base building.
VHI – AND FINALLY Boom.
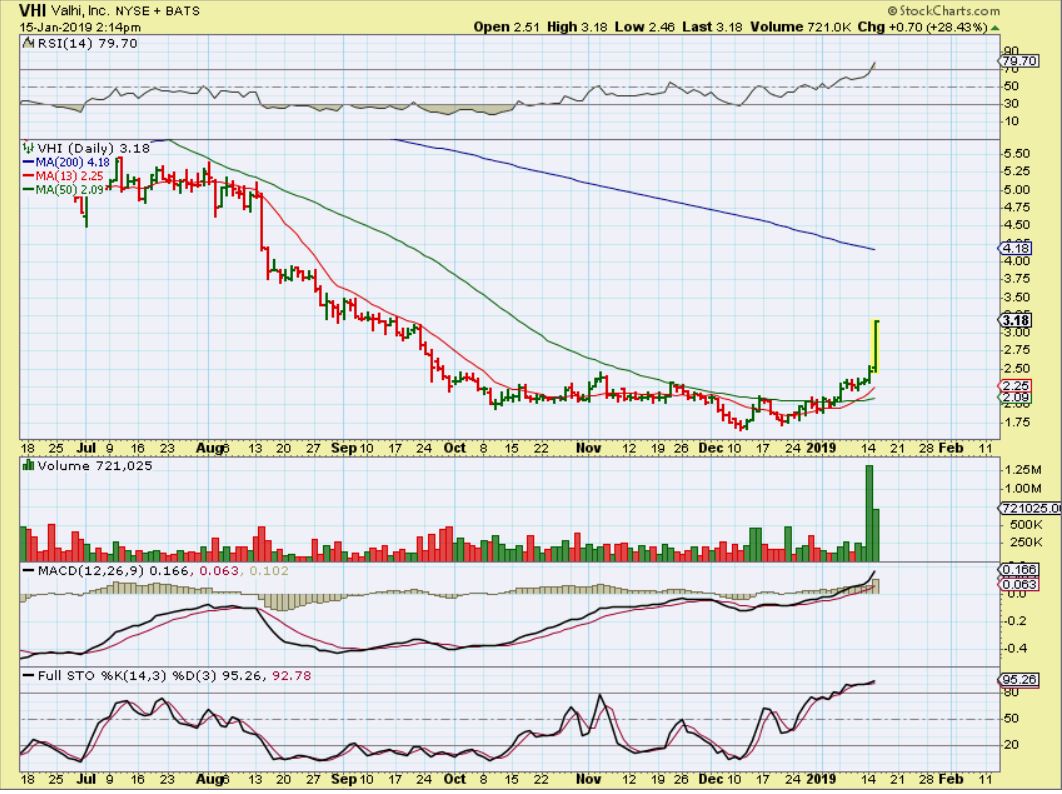
My Point: SN Looks ready to pop and I bought it, but look how long it took VHI to play out. I’ve been stalking it for over A month. SN may do the same, but I will ride it as long as Oil remains bullish ( and they come up with a plan for the delisting).
.
I don’t want to focus everyone on Penny stocks too much, but some of the ones that we have discussed are breaking, so lets just take a quick look…
.
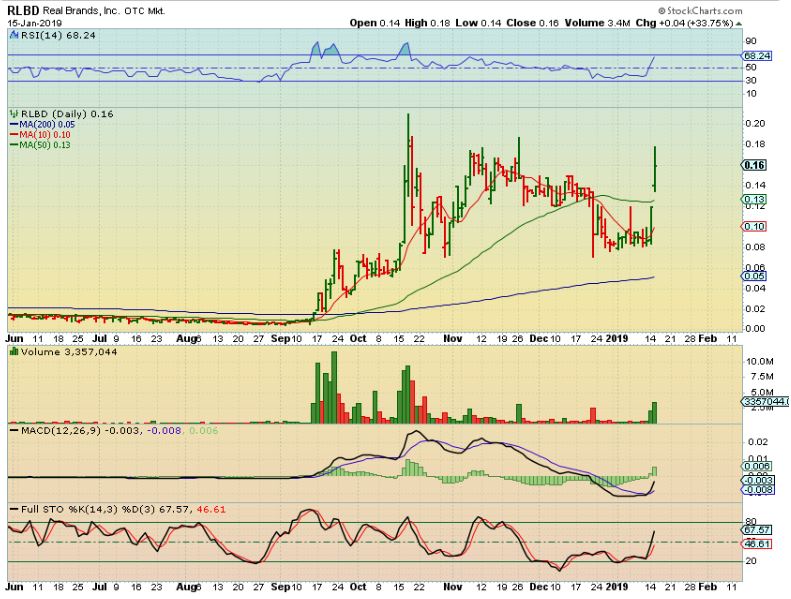
RBLD AND THE FIB PULL BACK- This is part of the red hot Hemp / CBD sector , but but can it get back over the 50sma
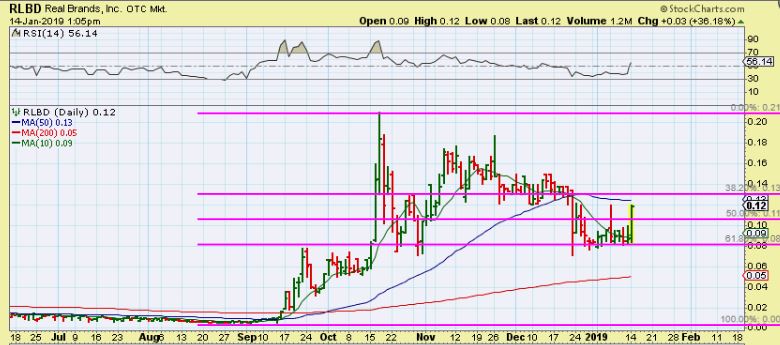
YES IT DID
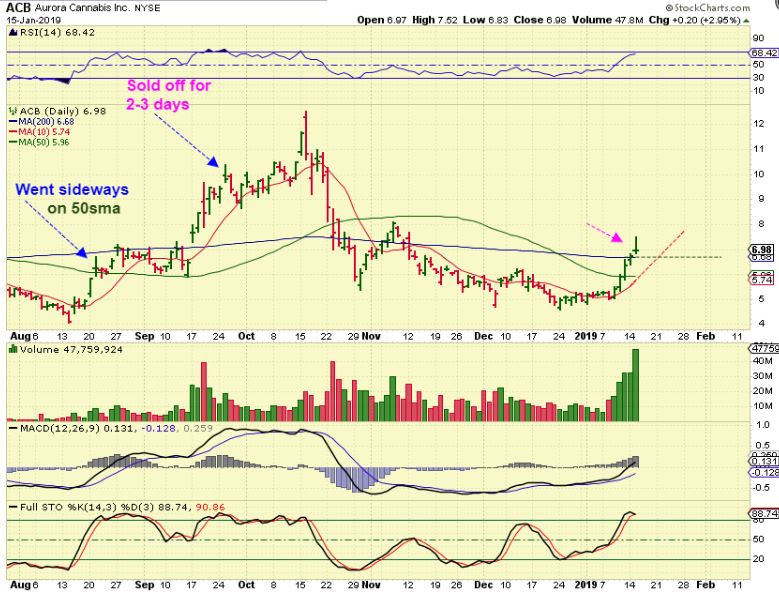
ACB – ACB has been running great and suddenly it shoots up and sells down. This is OFTEN a topping candle, but it doesn’t have to be long term topping. For example, it may just do this. Did you miss buying ACB? You may get a chance if it pulls back like this. I’ll keep my eye on it. AND…
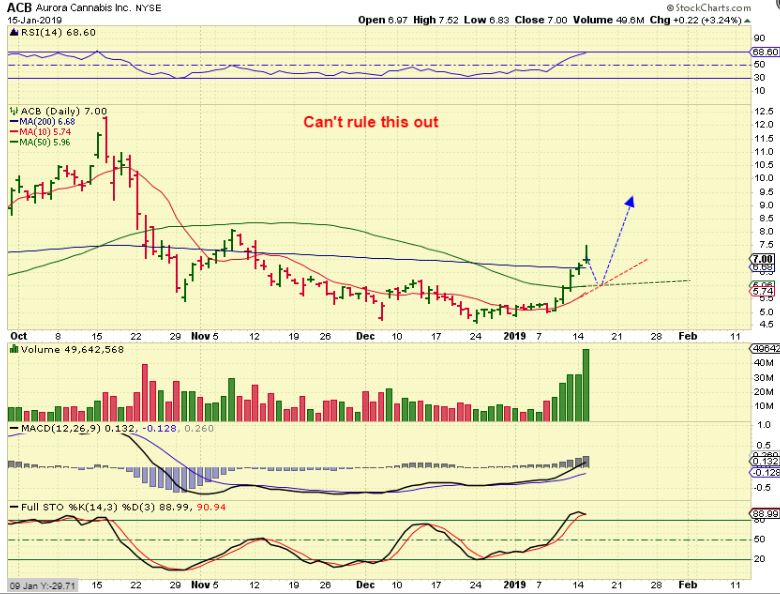
ACB – I looked for past candles like that, and found 2.
1. One just saw a pause in August for 2 days along the 50sma and then moved higher.
2. The other in September pulled back for 2 days and then continued higher, so we may see that here. I still own ACB.
.
So this sector is doing very good, I want to go back to a cheaper stock that I pointed out a while ago
.
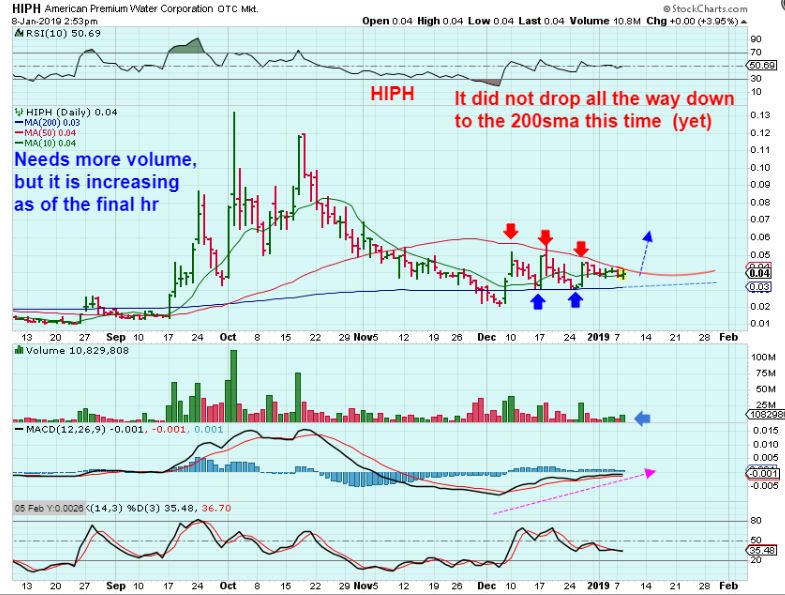
HIPH- I just posted this chart Jan 9th, but I have been discussing this BASE and pinch between the 50 & 200sma for weeks. I said that I wanted to BUY & HOLD this. This looked very bullish to me…
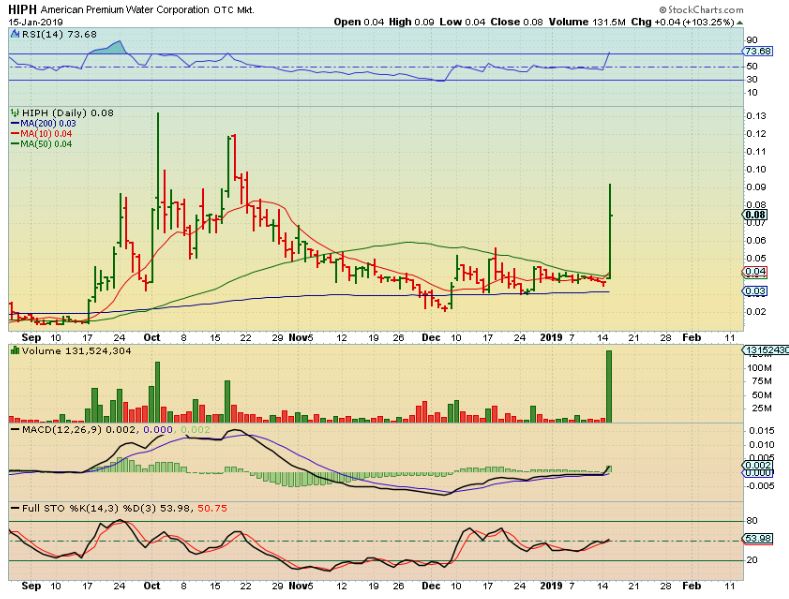
HIPH- Up over 100%. They announced a private deal that valued the company at 40 cents / share! 10x current value, so it popped and this actually may work its way even higher. Congrats if you bought it. Since it has more than doubled , You could actually sell your original investment and just let the rest ride. I did that with EDXC a while back. Free Money trading as long term buy & hold.
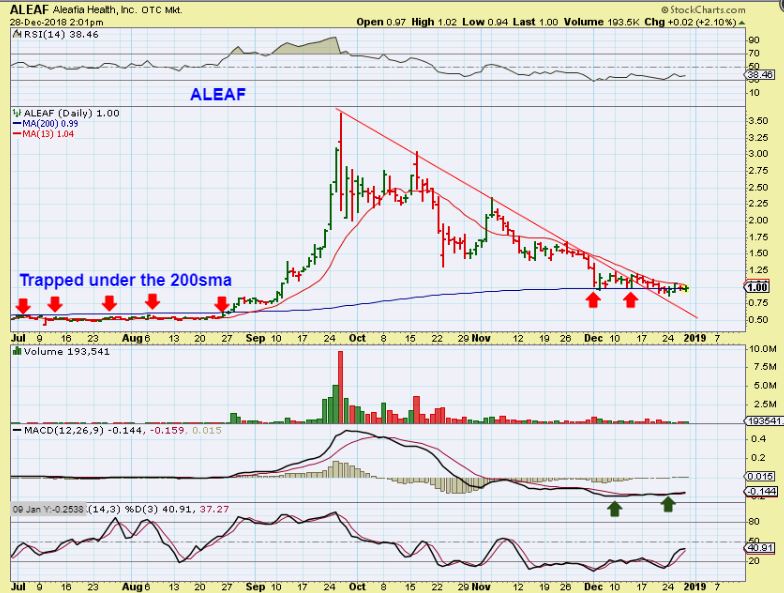
ALEAF – Do you remember this one? I Bought it here at $1 around the 200 sma and wanted to just BUY & HOLD this one too. They are in the Hemp / CBD / MJ sector. Well…
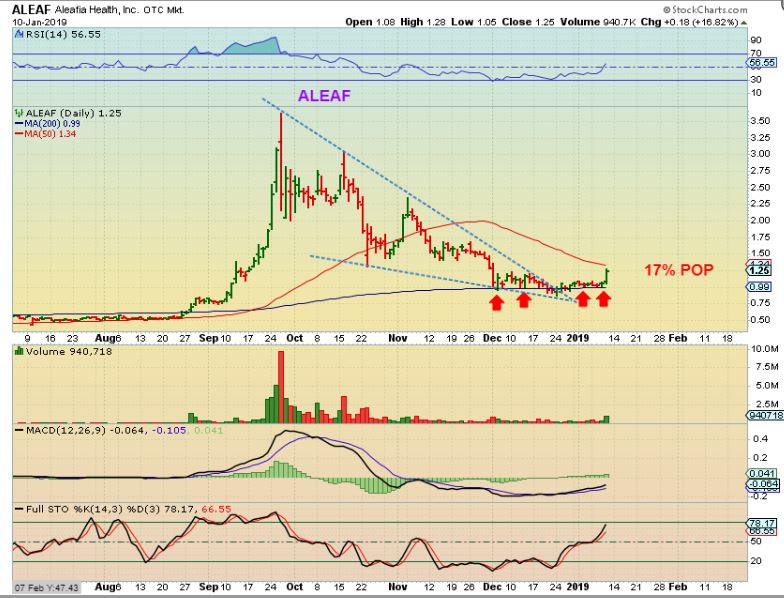
ALEAF – We saw a nice POP last week out of the base, and I pointed it out here again. The 50sma was still overhead.
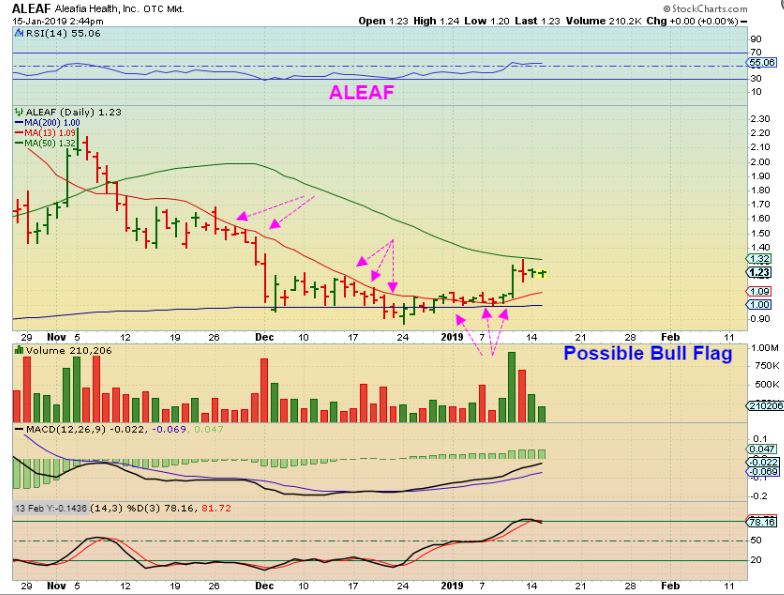
ALEAF – This is ALEAF now. It may be a bull flag, crawling under that 50sma, getting ready to break out. I own it, you may want to keep your eyes on it too. THis sector has been acting correctly.
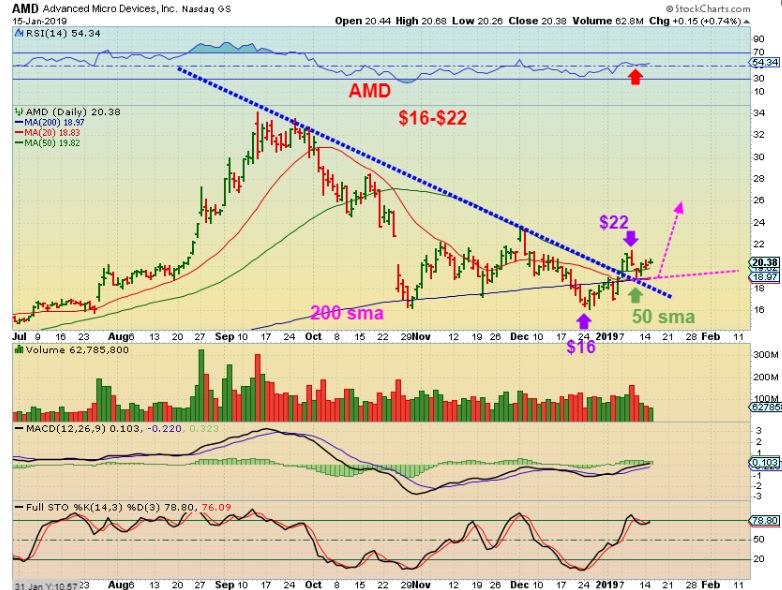
And don’t forget to look at stocks like AMD, MU, SQ, IO, HUYA, CY, etc when the Markets push higher and start the next leg up. I will put them in future reports if they look Bullish. Right bow, they do ( Like this)..
AMD ran from $16 to $22 off of the lows. It may do another leg up with the Markets. It sat on the downtrend line and 50sma & 200sma. It is acting correctly, it just needs some buying.