Tuesday Jan 29th – Hang On
When a trade is acting correctly, sometimes we just trade out of them after they hit an estimated target, and wait to see if they pull back and offer another entry point. In some set ups, however, if the run looks really bullish, I may just encourage selling a portion on the way up and trying to Hold On if you can. I will explain that a bit more later in the report, after a brief discussion of our markets…
.
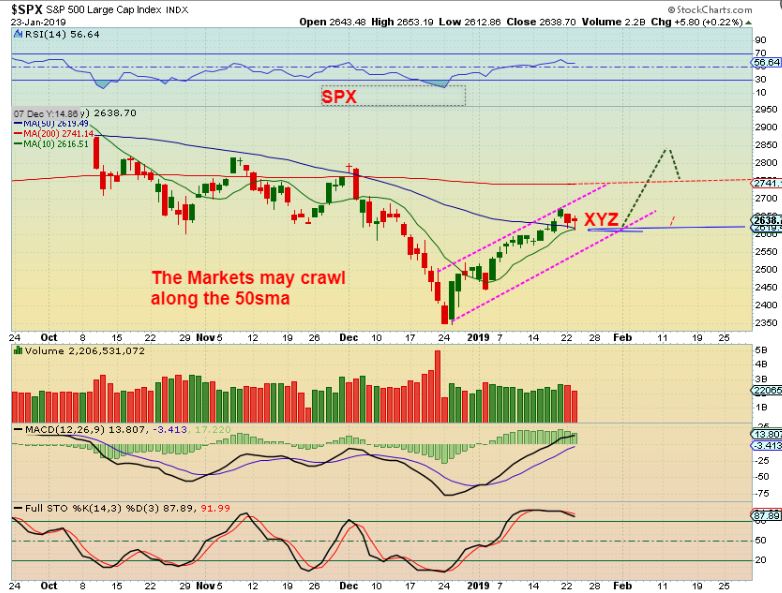
SPX – Last week I mentioned that because of the rising wedge, Price may need to crawl sideways along the 50sma as shown (XYZ) to form more of a channel.
SPX – So far it has done just that. It is day 21, and I feel that we could still run to the 200sma and then ‘peak’ and drop into the dcl. 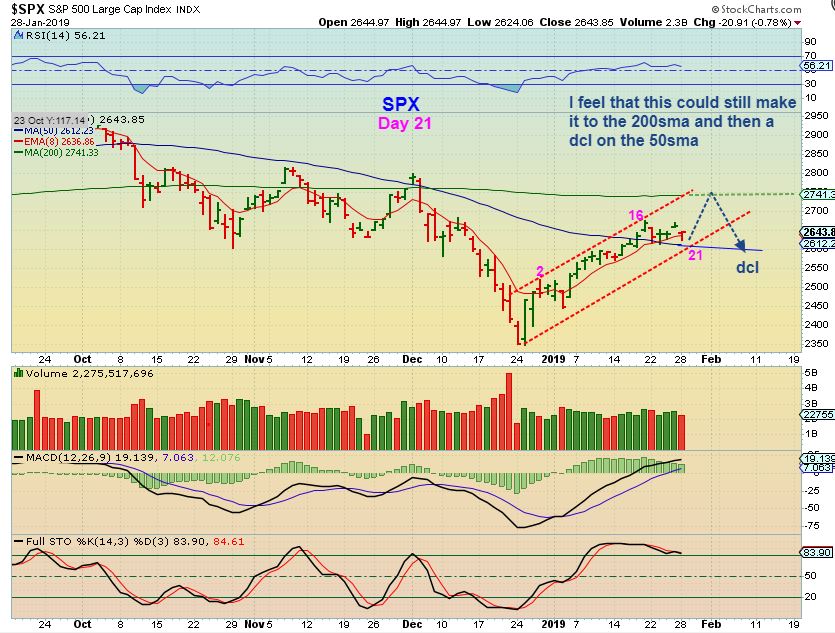
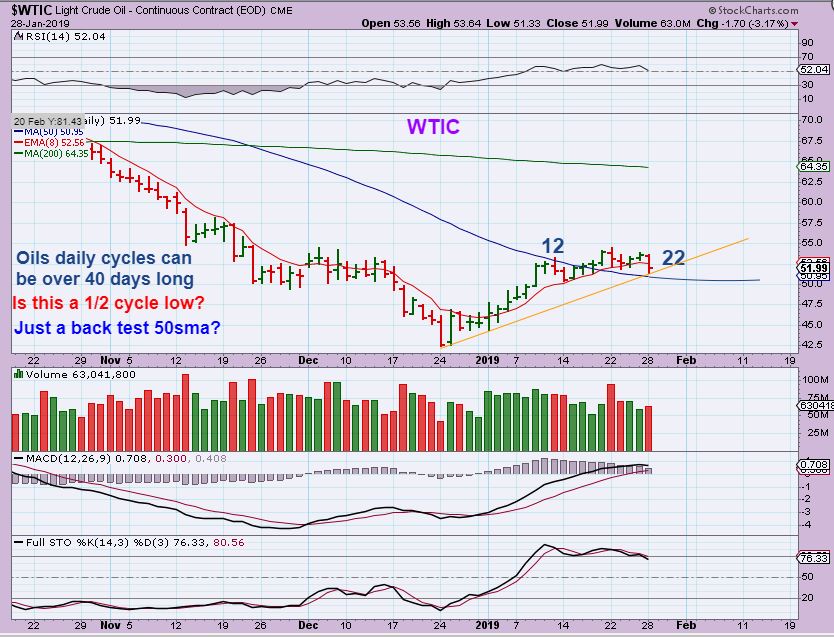
WTIC – Oil has been crawling too. We’ll have to see if the 50sma holds as support? Do we get a shake out? It tagged the 50sma Monday, so does it reverse & run higher from here? It is still early and I do expect more upside coming out of an ICL, so all you can do with the current trade is honor stops if it breaks down. Then if it does a shake out, get back in to ride the 2nd leg higher, but so far so good.
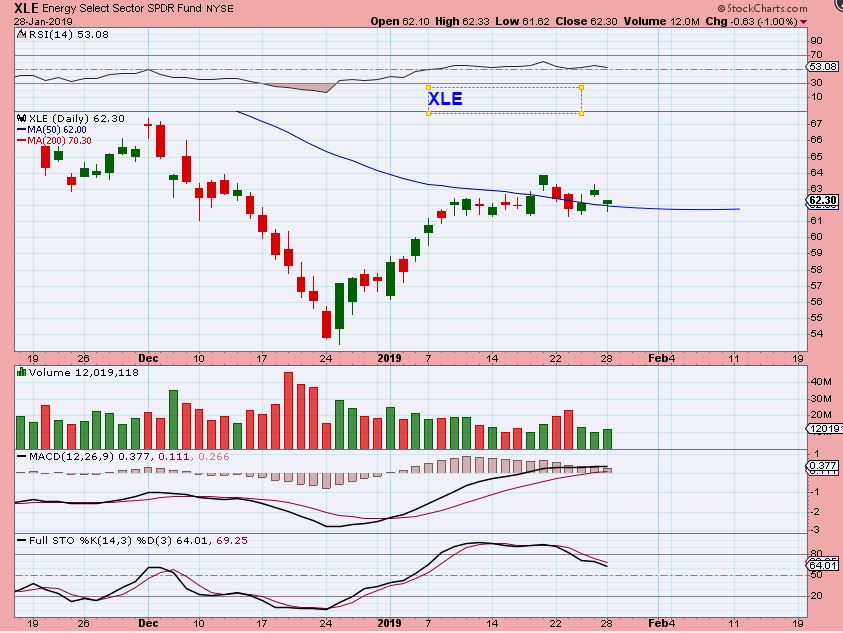
XLE – With Oils drop, the XLE did not break down, it broke the 50sma and recovered so far. That may indicate that OIL is not going to break down below the 50sma.
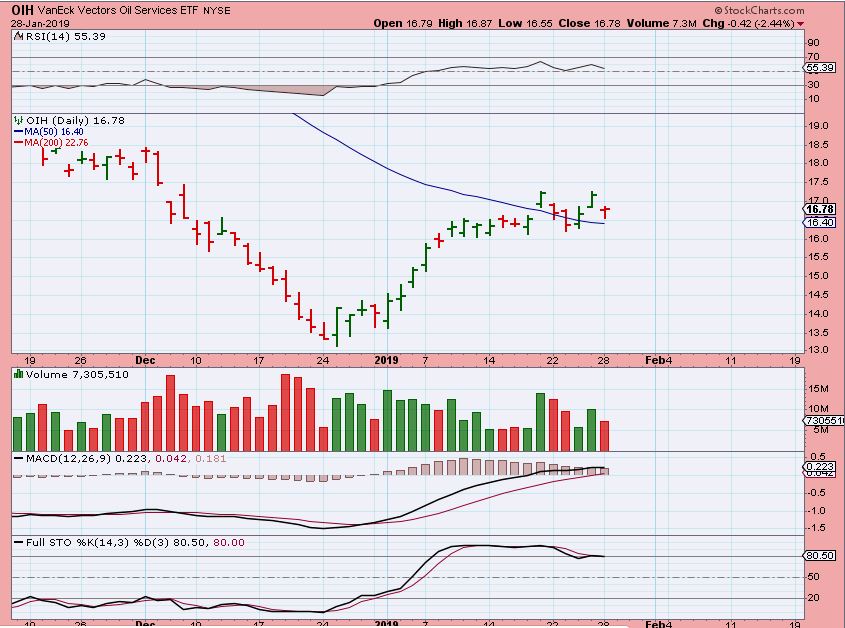
OIH – Notice that the OIH broke down last week & recovered, but with OILS drop Monday, the OIH dropped and was bought back up off of the 50sma. So far, it is fine.
.
GOLD- FOMC POP? Or FOMC DROP?
.
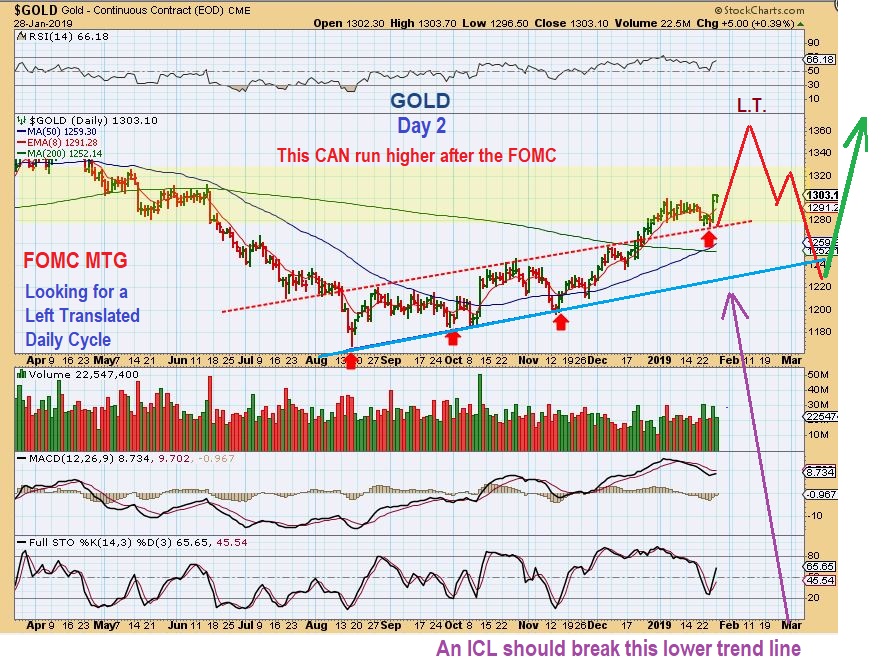
1. If this 4th daily cycle is to be L.T. and drop into an ICL eventually, it ‘could’ start to roll over after the FOMC Meeting.
2. It also could rally for a week or so, and then roll over & still L.T., right?
.
That means that after buying a dcl, you may just want to honor your stops and let it ride for now. When I look at several Miners individually, they do look bullishly set up. Some Miners may run on their own, I have already mentioned that, and TRX is proving that to be true. For that reason, I want to show both ideas above for Gold, and we will watch and to see if either happens after the Wed FOMC Mtg.
.
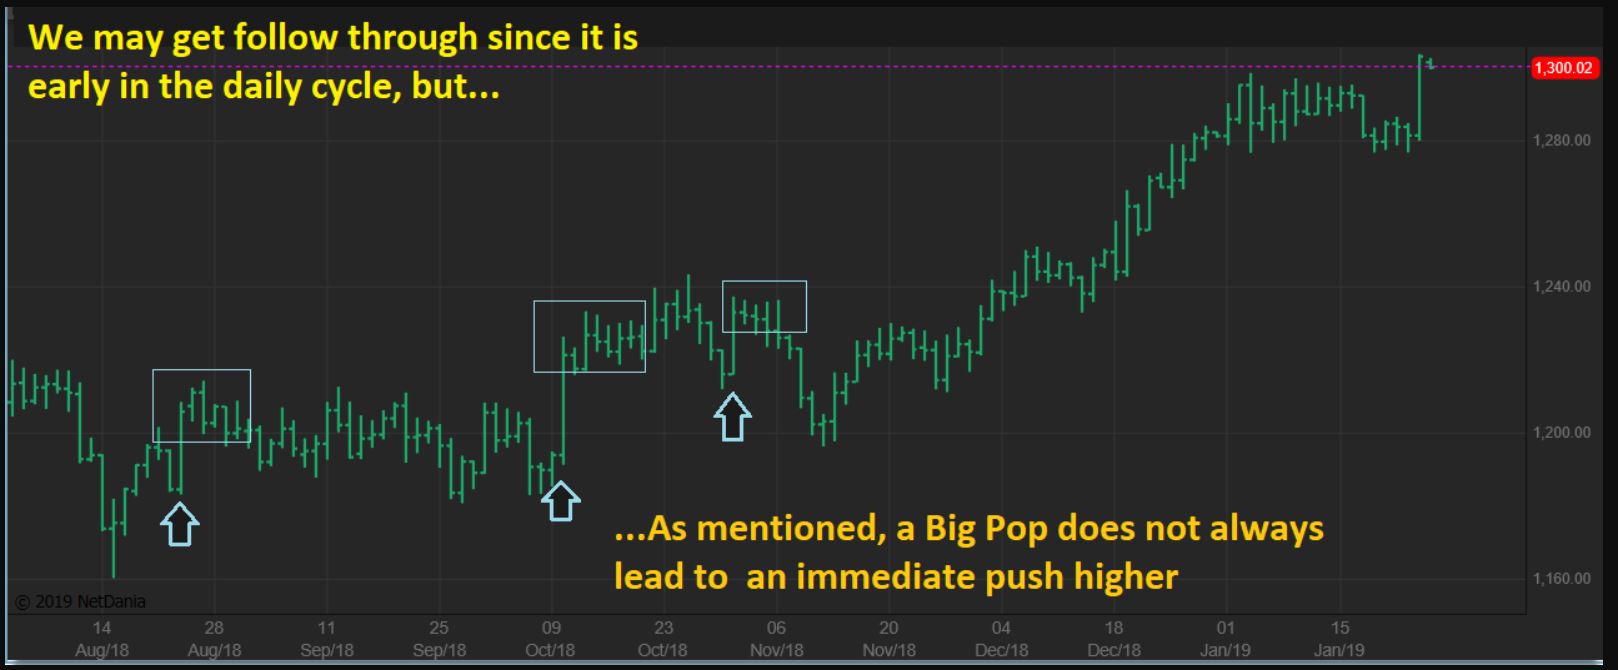
WE KNOW THAT GOLD CAN JUST GO SIDEWAYS TO SLOWLY HIGHER AFTER A POP, AS SEEN HERE. I MENTIONED THIS IN THE WEEKEND REPORT, SO KEEP THAT IN MIND.
.
We have an FOMC meeting this week, and often gold does ‘SOMETHING’ after that meeting.
.
GOLD – For Gold, this is only day 2, and though we are expecting a Left Translated Daily Cycle ( they peak on the left side of a daily cycle) , it can run higher first AND STILL BECOME L.T. , so let me look at this a bit closer before that FOMC MTG. Please read the chart.
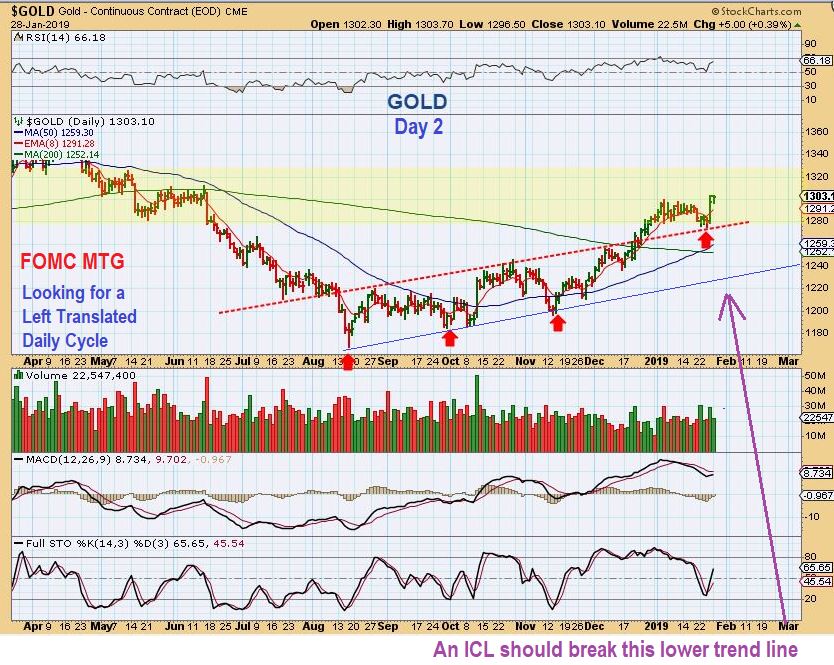
GOLD – So to visualize it, Gold CAN run higher , even until let’s say day 14, and then if it is 30+ days long, it is L.T. , so a drop from there to an ICL COULD look something like this. THIS IS VERY LIKELY, ALLOWING SOME MINERS TO RUN HIGHER. Now I want to also look at 2016…
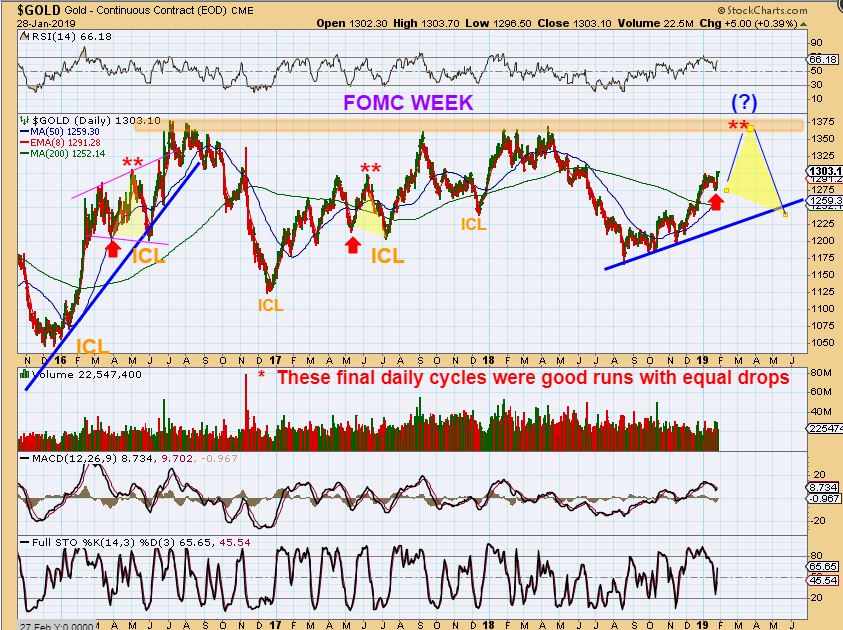
GOLD –
1. In 2016, after a small base, Gold ran STRAIGHT UP, and then it just went sideways for weeks to form an ICL in May (Eventually Breaking the trend line).
2. This current base was more sideways from the start, and the trend line is less vertical, so to break that trend line at an ICL, we’d need a steeper drop than 2016 if it runs higher now. ( This no longer resembles 2016 to me) .
.
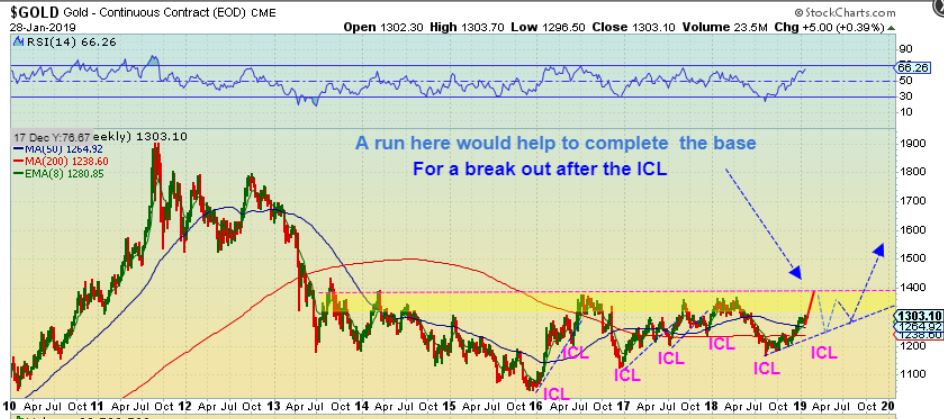
GOLD – A sharp run higher from here could also complete the top of the big picture ‘base building’. That would be followed by a higher low (ICL) and then the next intermediate Cycle breaks out & a strong multi week rally would be Very Bullish and profitable. This looks reasonable .
The above is obviously not etched in stone, but it makes sense. As time marches forward, the above example is simply 1 logical way that I could see all the pieces of the puzzle coming together fusing Cycles, Technical analysis, sentiment, etc. However What could it look like if GOLD begins to roll over L.T. sooner than later, like right after the FOMC Mtg?
,
GOLD FOMC DROP – This would be a normal L.T. Daily Cycle peak and roll over into an ICL, showing a roll over soon after the FOMC. The BIG PICTURE BASE would just be completed on the next run higher.
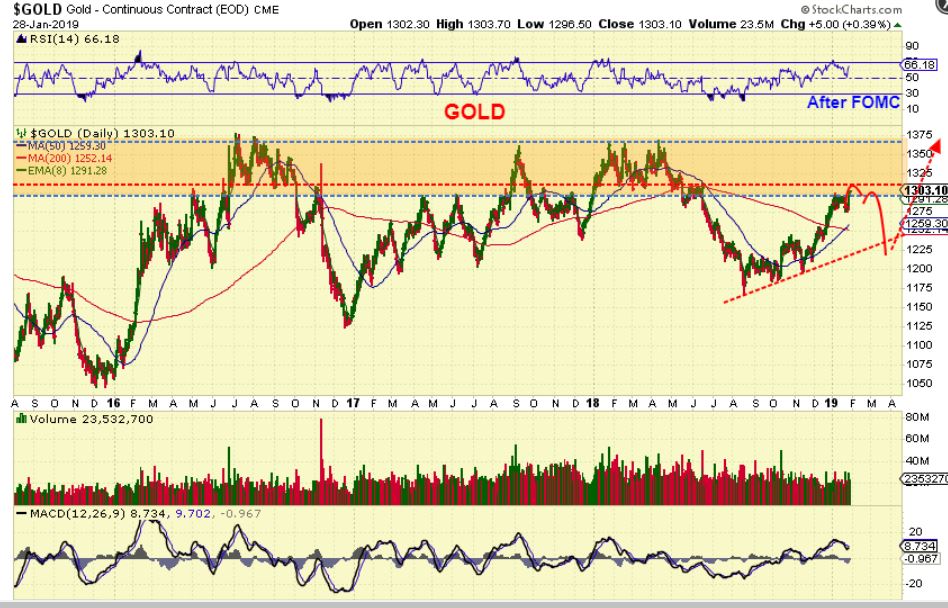
Let’s just take it one step at a time, and see what happens after the FOMC Mtg Wednesday. I will say that several Miners do look Bullish, so maybe that means that Gold POPS after the FOMC, and moves higher for a week or so. Again, we’ll see what happens after Wednesday.
.
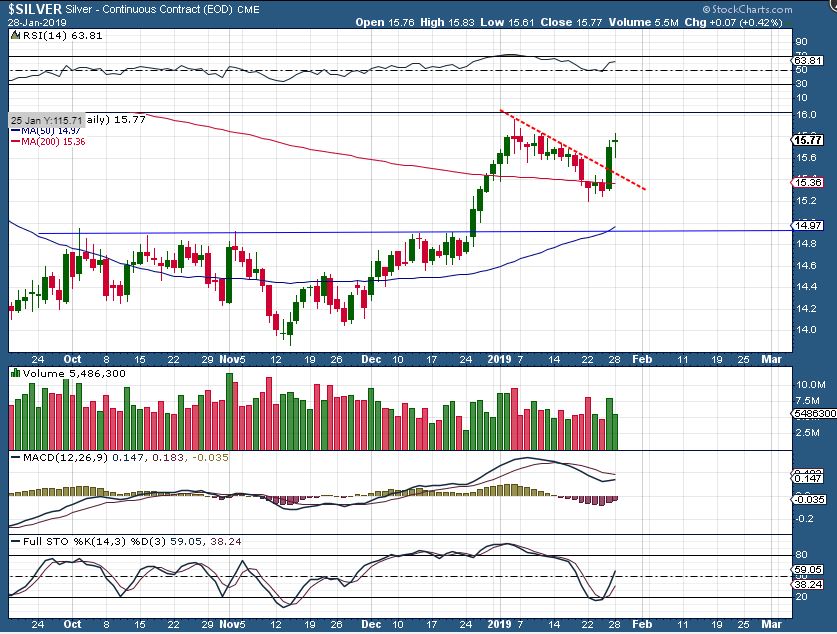
SILVER – Silver looks Bullish after crawling briefly along the 200 sma and bursting higher.
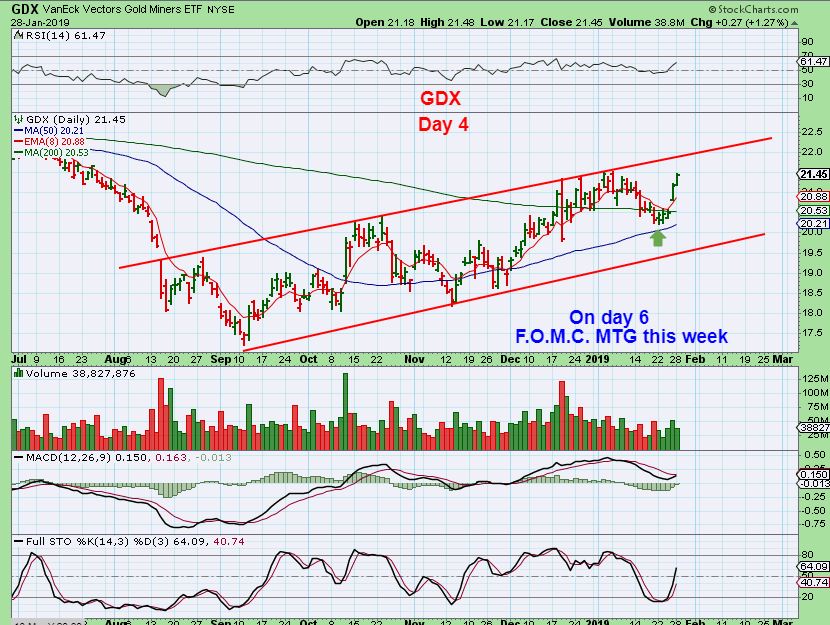
GDX – GDX held the 50 & 200 sma area. Is GDX going to tag the upper trend line, or break out like Gold did? We will have to wait and see, but for now, buying that DCL, you could raise your stops a little.
Monday really didn’t change anything from the weekend report, but if you are in any of the MJ Stocks, they are on fire! I also see some Miners that look set up to move higher, which is why I am thinking that we could get a push higher after the FOMC Mtg. Lets discuss a few things below after signing off. Enjoy your Tuesday trading.!
.
~ALEX
.
SOME INDIVIDUAL MINERS DO LOOK BULLISHLY SET UP FROM HERE. LET’s TAKE A LOOK.
.
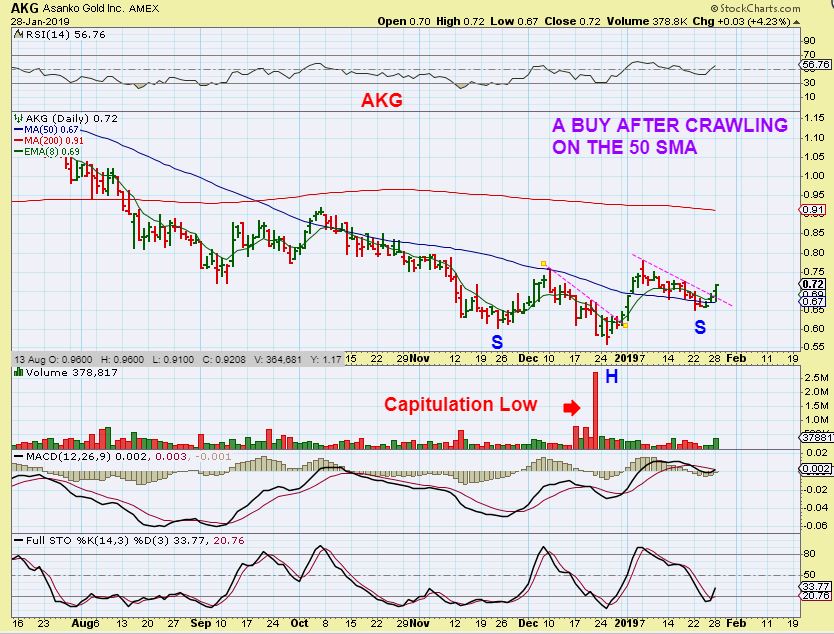
AKG – This is a BUY & a low risk entry, because you can place a stop under the 50 sma, and raise it as price rises. Many of these Miners have been running to the 200sma.
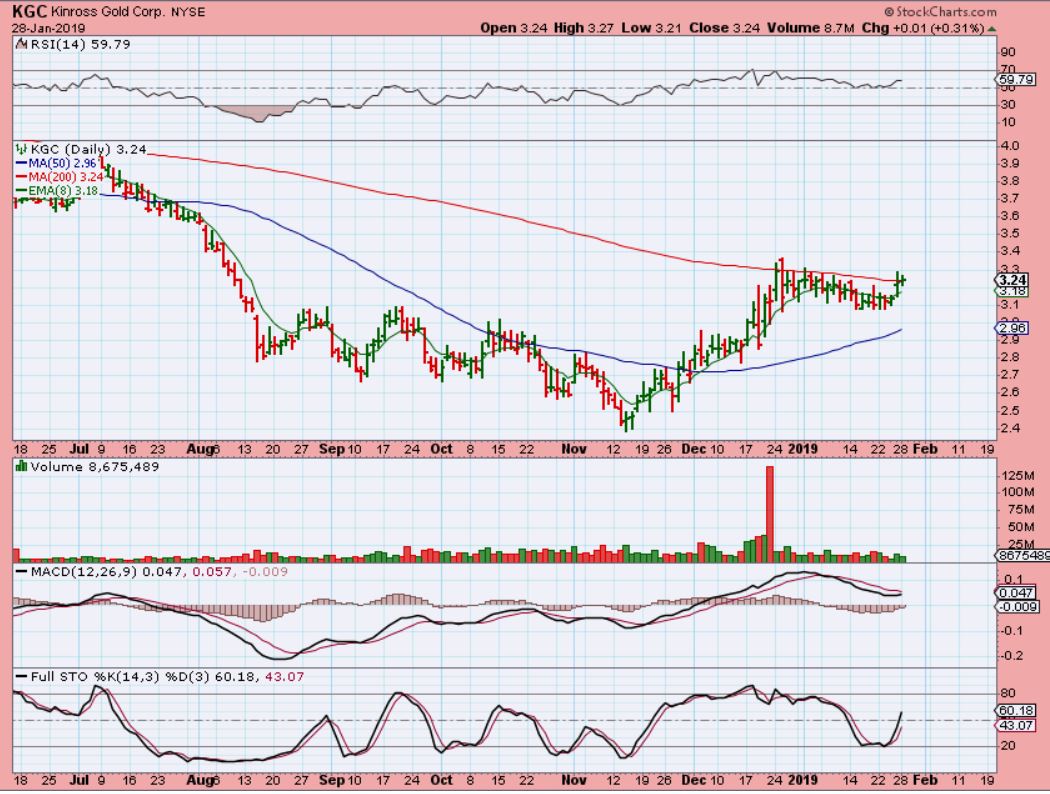
KGC – KGC is trying to break out too.
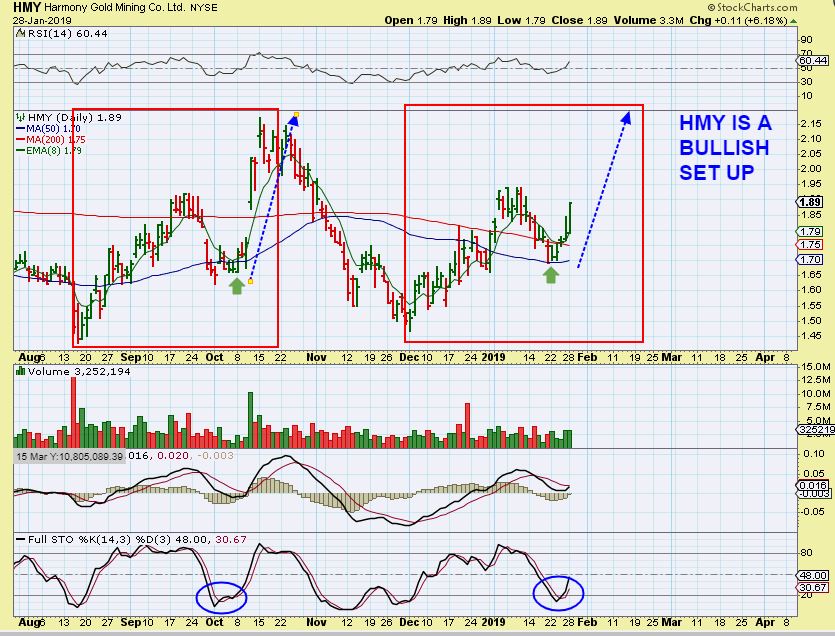
HMY – This is a bullish set up that found support at the 50 & 200sma. It did so even cleaner than it did in October.
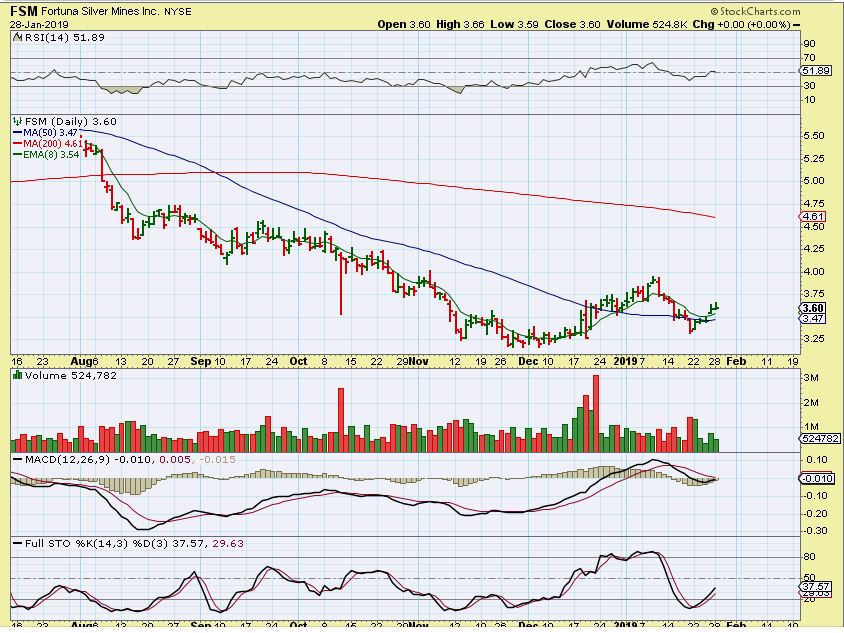
FSM – FSM and many other silver stocks are above the 50sma. These types of set ups are low risk entries, and Silver does look like it wants to push higher.
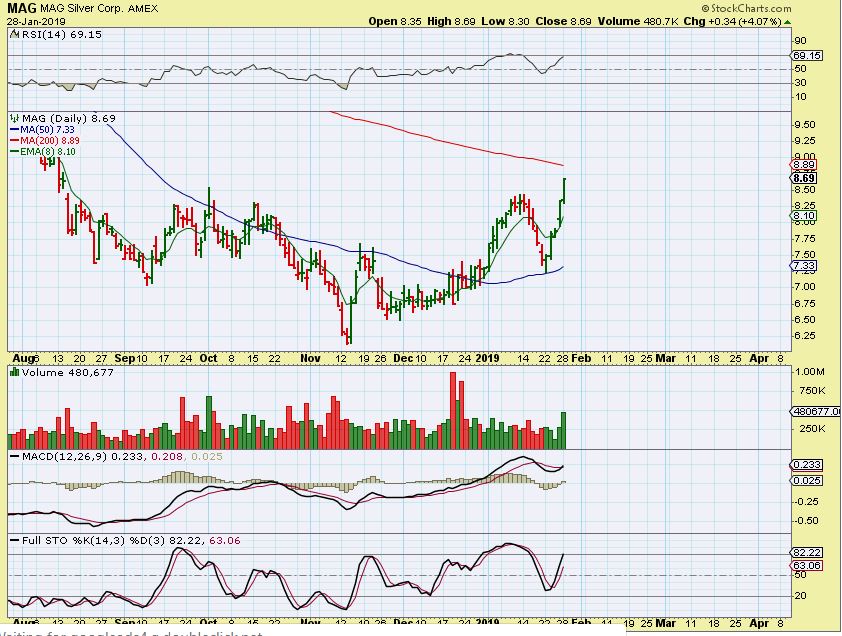
When MAG was alerted as a BUY Breaking the 50sma here, like so many Silver stocks are now, it…
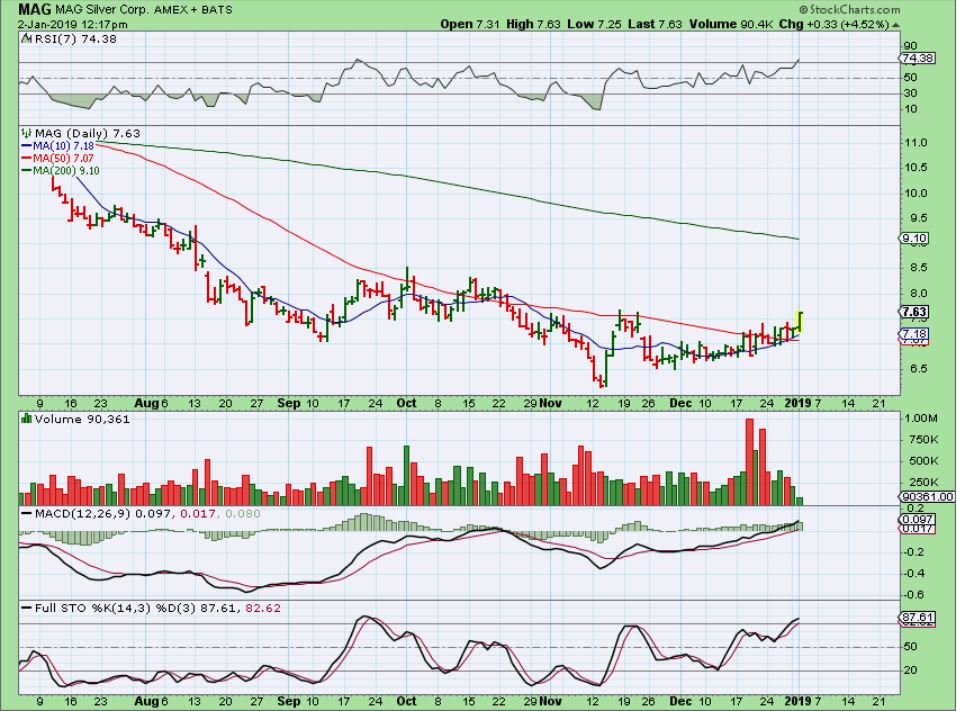
MAG – It ran toward the 200 sma, but then dropped to ‘back test’ the 50sma, and took off again.
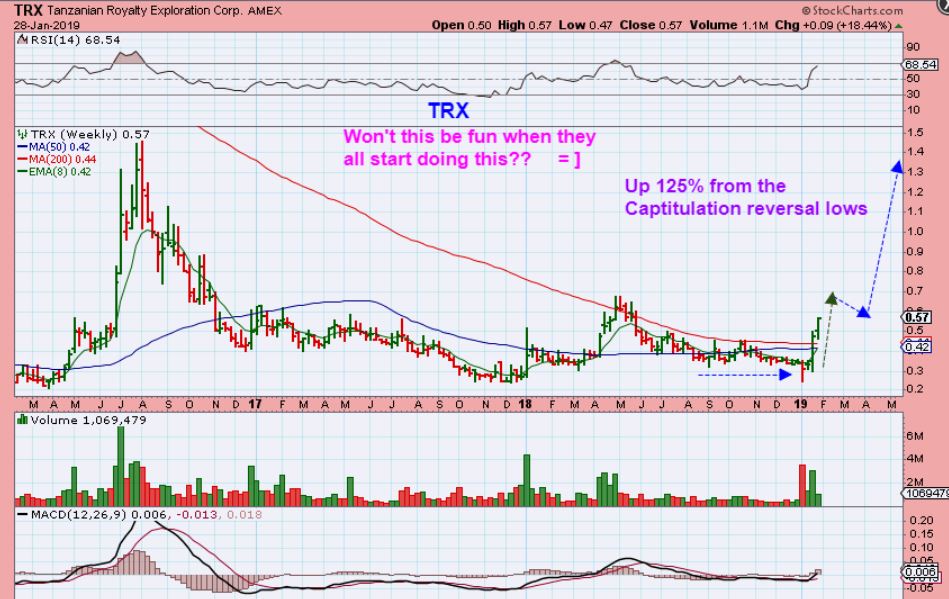
And YAY for our TRX WEEKLY RUN– After that capitulation reversal, TRX is up 125% in 3 weeks and 1 day : ) . This is now also a break out over the weekly 50 & 200 moving averages.
.
MJ ETF – I have been pushing these set ups and this ETF for a while now, and it is Playing out exactly as I expected. This set up was an easy low risk entry, and many of these set ups do not peak until the form a giant Cup. IT MAY OR MAY NOT BE A STRAIGHT UP RUN, BUT IT REMAINS BULLISH FOR NOW.
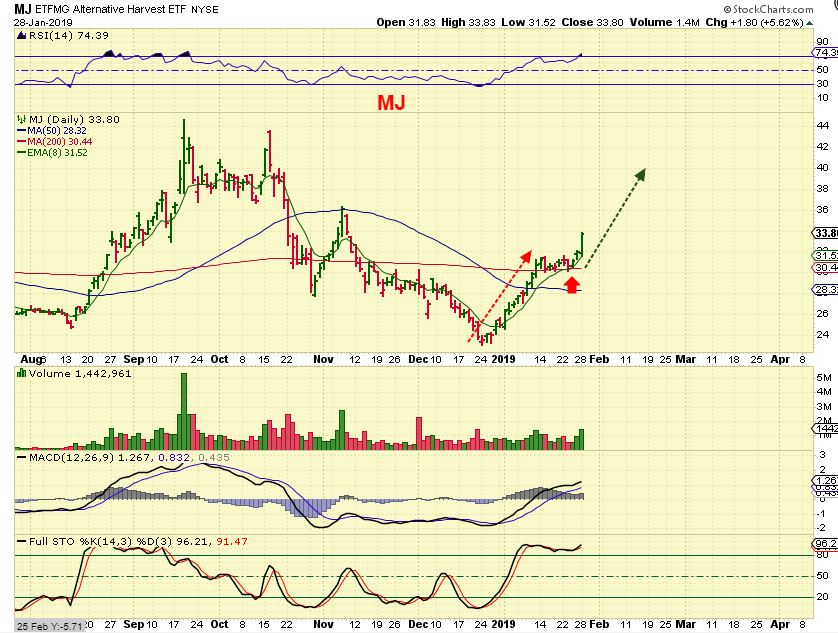
I WANT TO ( AGAIN) JUST SHOW THE READERS HERE HOW THESE MOVE, THEY ARE TRUSTWORTHY, THOUGH MANY ARE SIMPLY PENNY STOCKS AT THIS POINT.
.
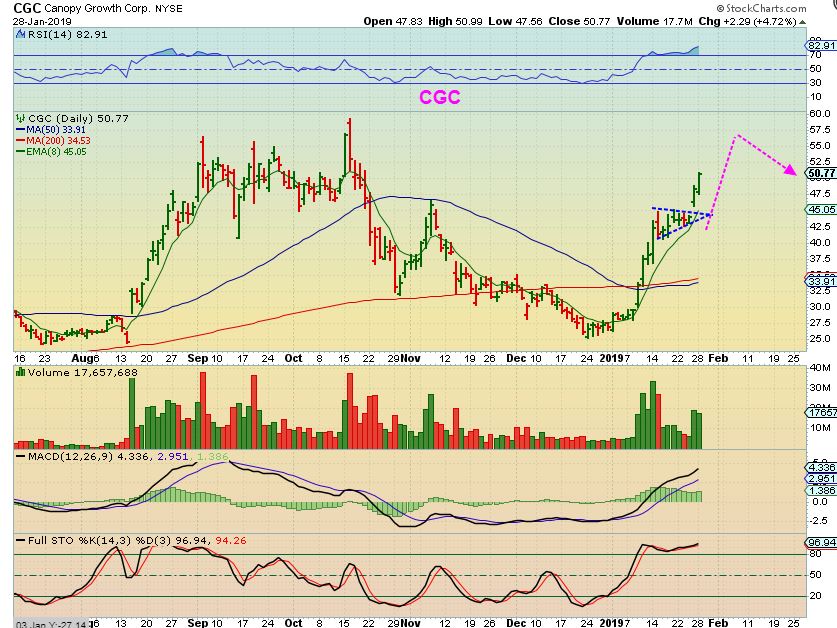
CGC – Forming a giant cup after a pause ( bull Flag) in the middle.
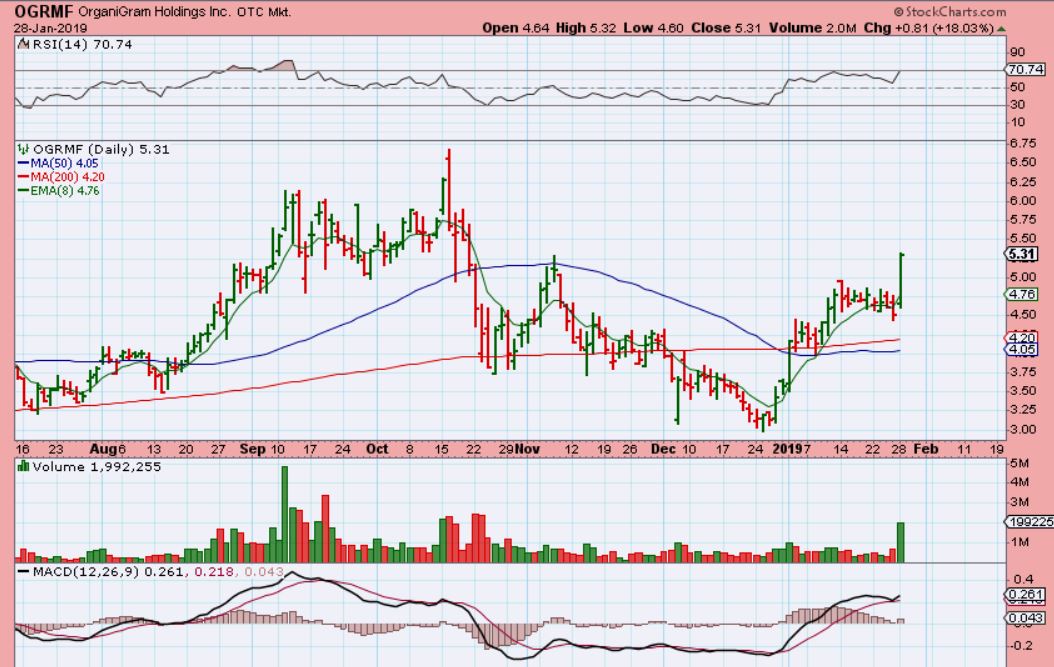
OGRMF – I posted this on Jan 10, as it started to form a cup & paused sideways on Support.
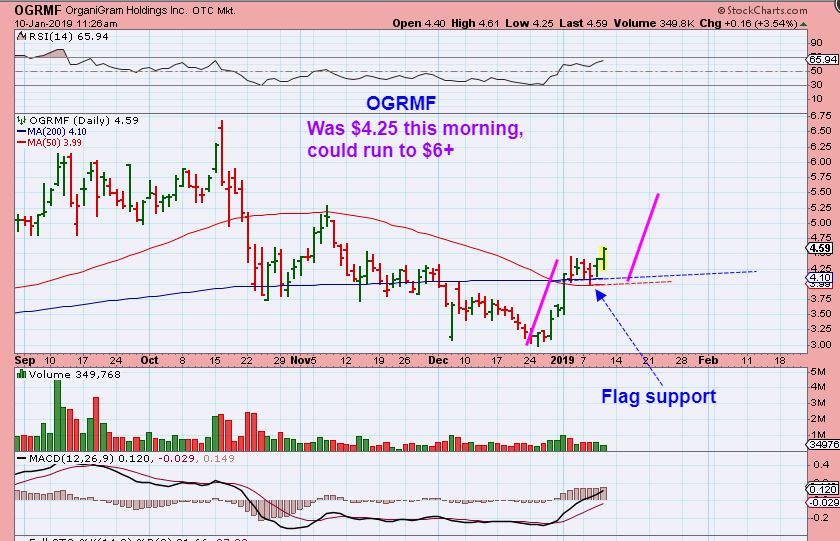
OGRMF – Well it moved off of support and then ran sideways for 2 weeks, but we see an 18% Pop with strong volume today. It will probably complete it’s cup soon.
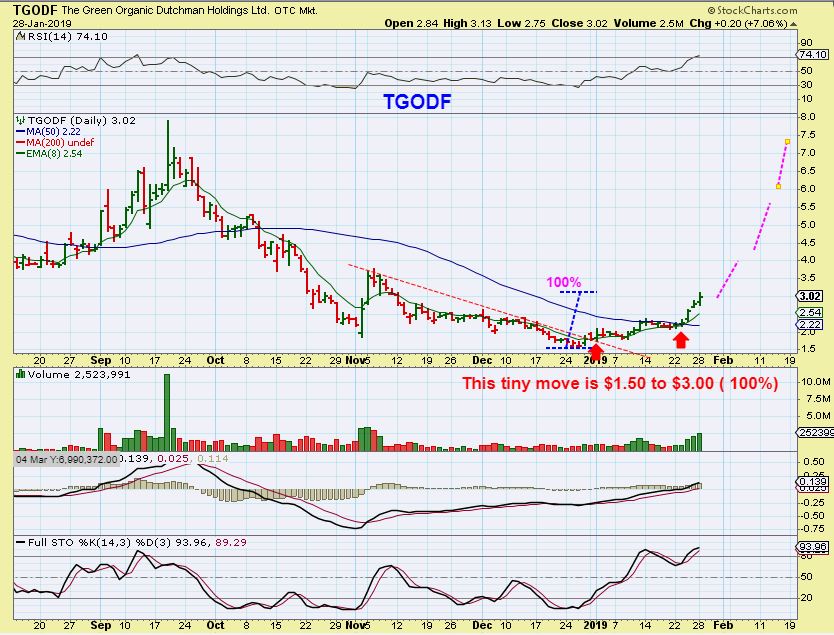
TGODF – This is also playing out well. If this forms a cup- Amazing gains! This will not be straight up, but if it happens, that’d be $1.50 to $7.50. For now I’ll watch how it acts around the 8 ema when it pulls back.
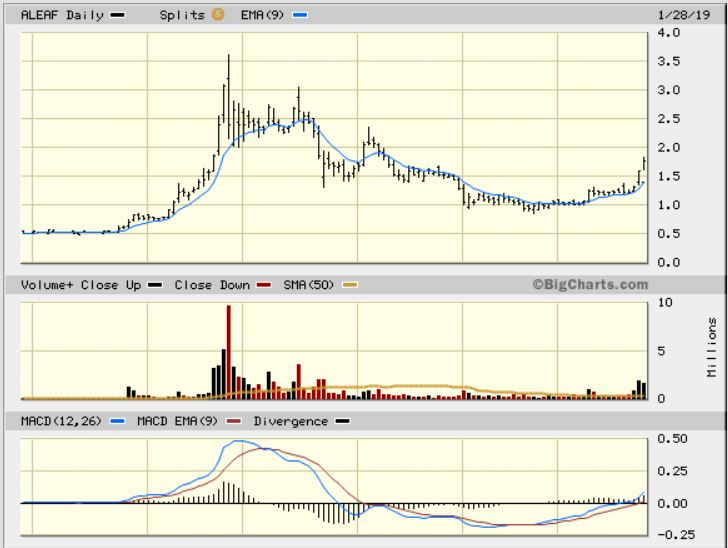
ALEAF was recommended at $1, and it almost hit $2 already ( 100%) , and I don’t think that it is finished yet. Again, many of these are forming Cups. Look at the left hand side of the chart, and you’ll see that they follow the 8 ema, but it doesn’t have to be straight up day after day after day.
.
SO WHAT MAY STILL CONSIDERED A LOW RISK ENTRY IN THIS SECTOR?
.
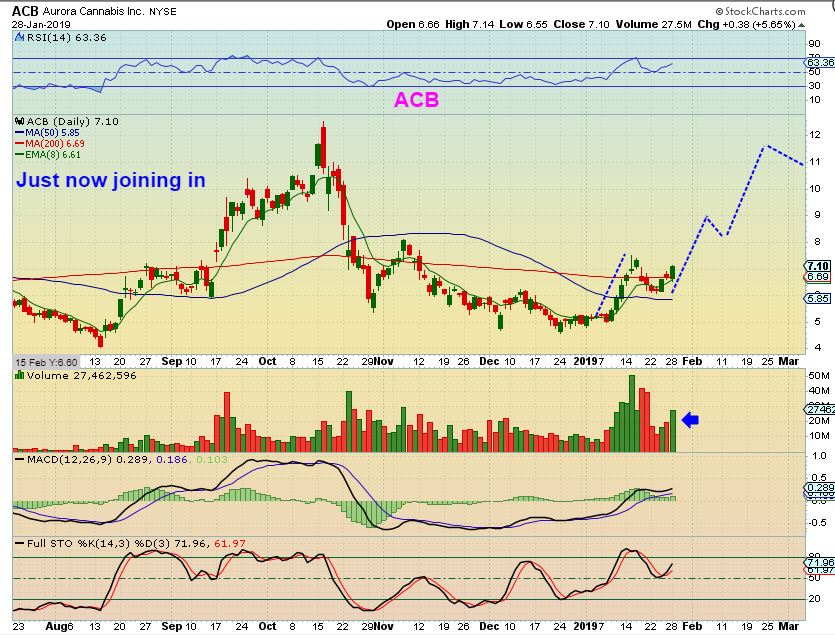
ACB – Just breaking back above the 200sma, I captured this 1/2 hr before the close. This is a low risk buy and if it forms that cup, Gains are great ( Trades on the NYSE).
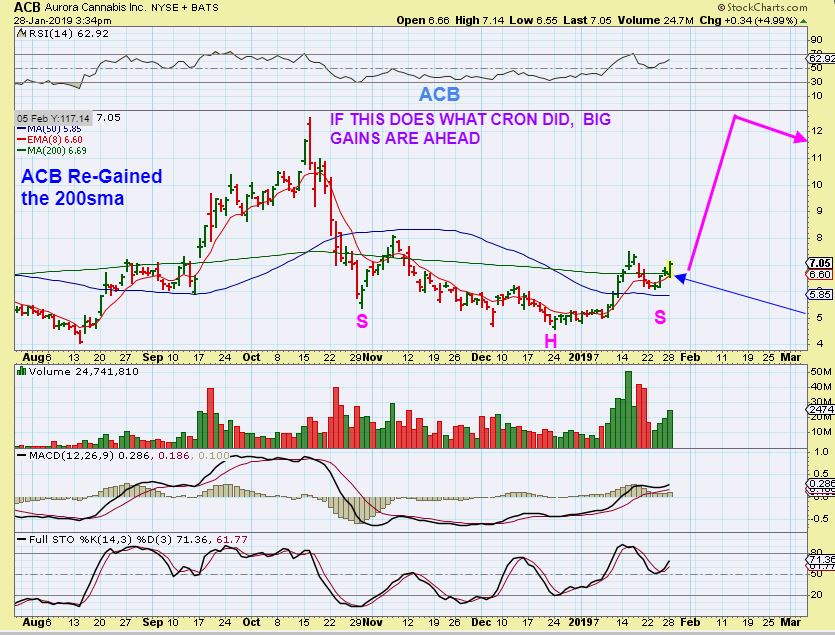
ACB – It closed with good volume, increasing daily. It is a buy.
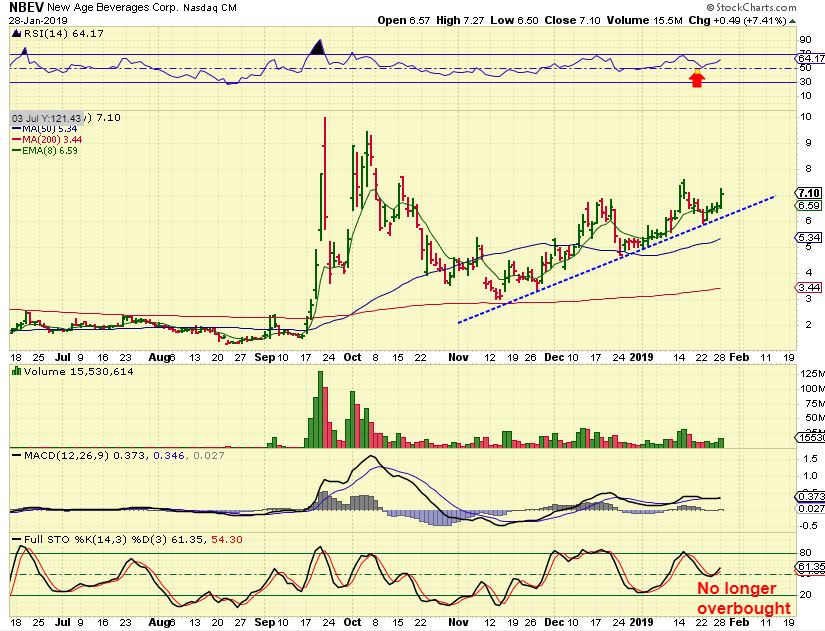
NBEV – Working its way higher.
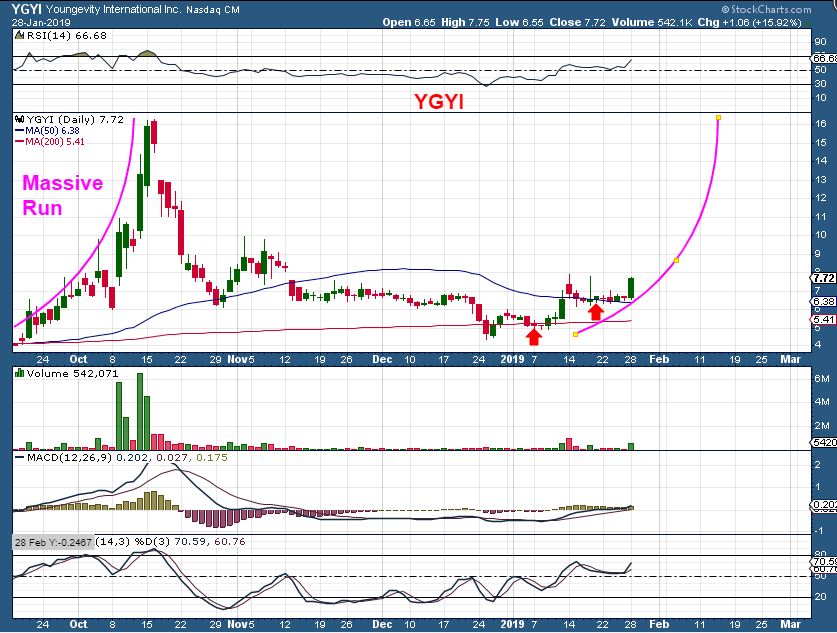
YGYI – After crawling sideways for 2 weeks along the 50sma, this Popped sharply Monday. If this were to repeat the Sept – Oct run, it would land on $16.
.
VVCIF – I mentioned that I bought VVCIF as it crawled along the 50sma, and in the comments Monday I said that I was adding as it broke out.
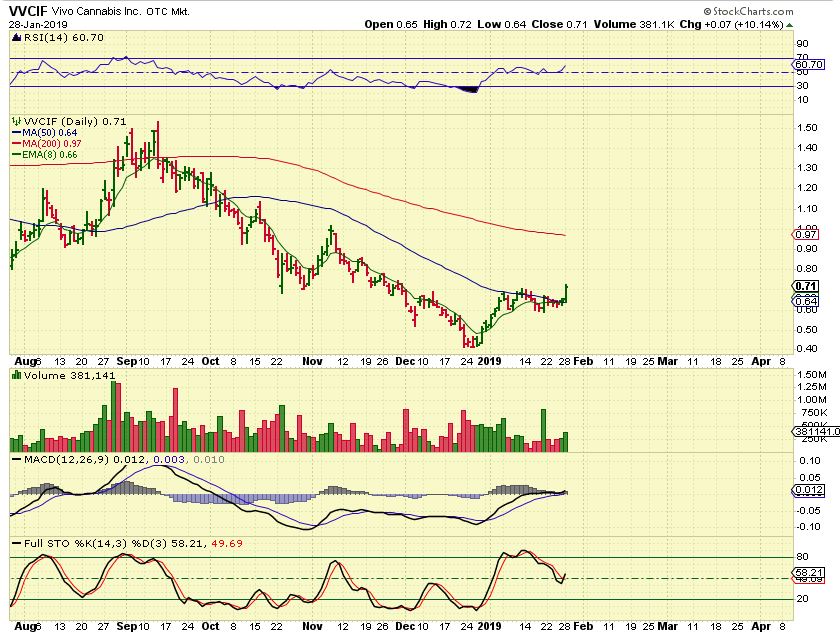
So this sector remains on fire, JUST HANG ON, they run along the 10sma often, they are fast and can be rewarding! I could show you several more set ups that look very Bullish.
.
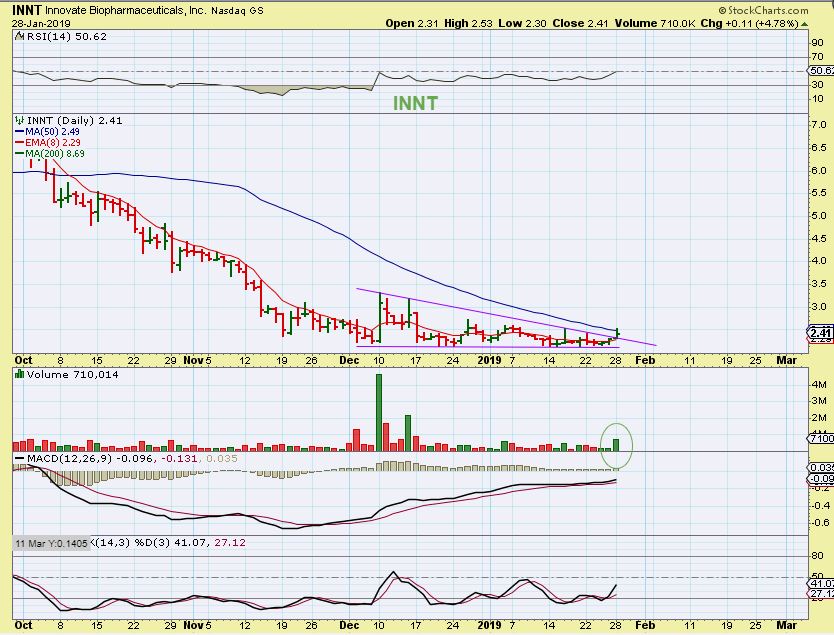
INNT – This is a Biotech stock that I have been watching fro 2 weeks. I finally think that this may be ready to POP over that 50sma. Buy it here or after it breaks out with a stop under recent base lows. As a Biotech stock, KNOW when they release earnings, surprises in Biotech often cause problems.