Jan 3rd 2019 – Catching The Bounce
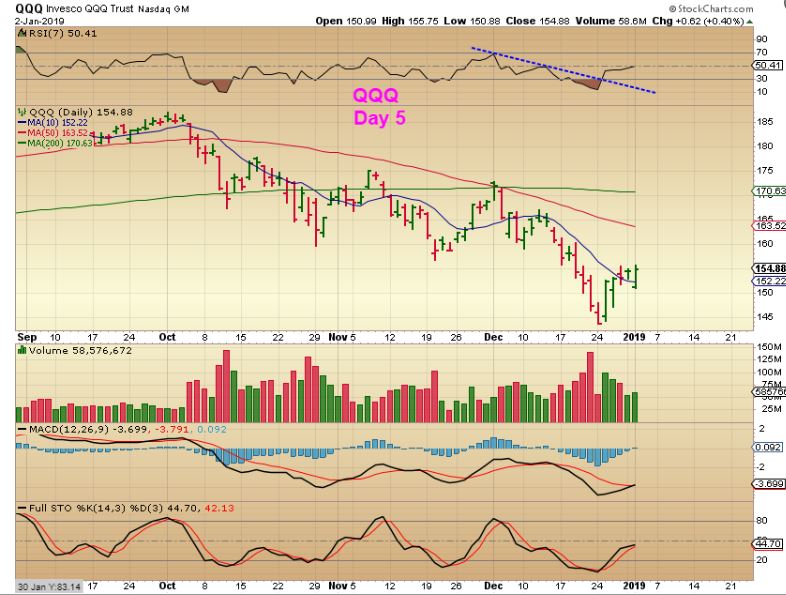
QQQ – Markets gapped down Wednesday, but reversed higher as the day went on. We have expected an ICL, and these lows should hold for a while, but it also may be choppy.
I AM RELEASING THE REPORT AT 8:30 a.m. Eastern Time. I was needed elsewhere last night, so IT WAS WRITTEN THIS MORNING FROM 5-8:30 basically, so I will not have time to proof read. Excuse any typos please. Thanks! 🙂
.
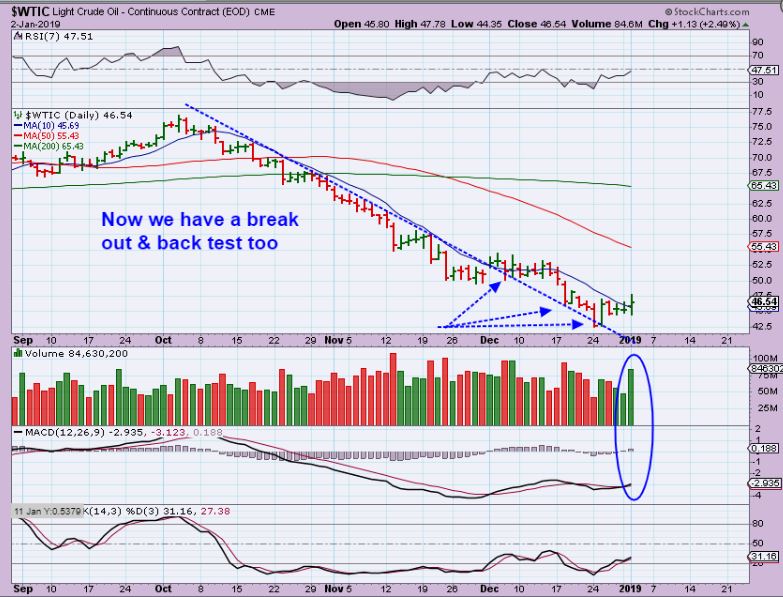
WTIC – Oil also gapped lower and then closed higher. Volume was strong ( Oil inventory may be released Thursday, due to the holiday Tuesday). This looks good, but Stay Frosty! Have stops at the lows.
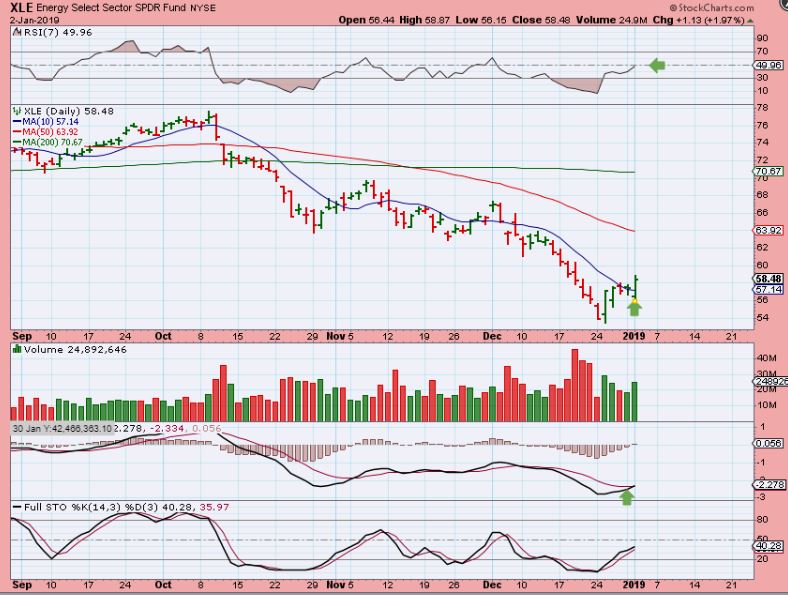
XLE – My Oil / Energy stocks opened lower by quite a bit, and then reversed to green by the end of the day.
OIH – OIH Looks to have broken a trend line. It did a false break on Dec 1, but this has a MACD cross & good volume. I’m hoping for short cover & Steady move higher ( Rather than the possible choppiness that we have seen).
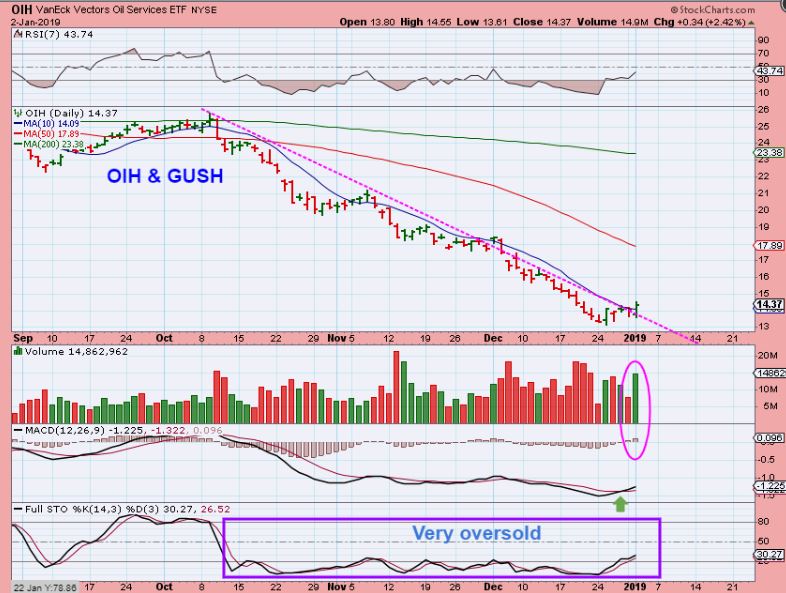
LOOKING AT SOME OF THESE ENERGY STOCKS POPPING OFF OF THE LOWS CAN BUILD CONFIDENCE IN THEIR RECENT LOWS. I BOUGHT FOR AT LEAST A SHORT TERM TRADE THAT COULD BE A GOOD %-GAINER. I WILL SEE HOW THIS PLAYS OUT DAILY AND DECIDE WHEN I WANT TO CASH IN. SOME MAY WANT TO HOLD ON LONGER.
.
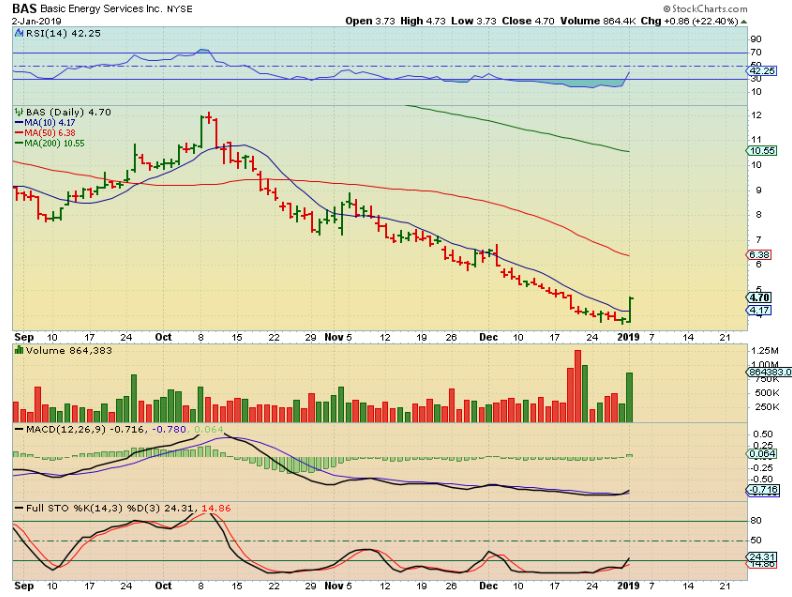
BAS – 22% POP Off the lows.
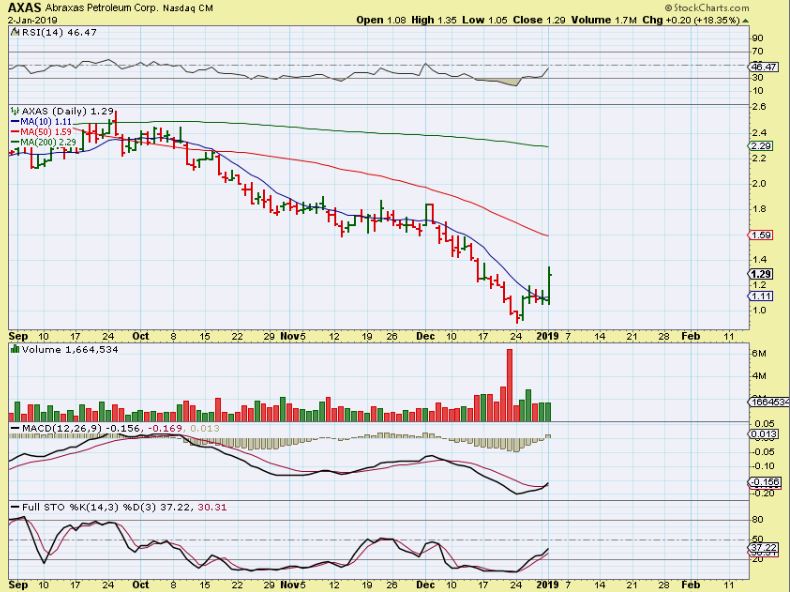
AXAS – Another 18% POP out of recent lows.
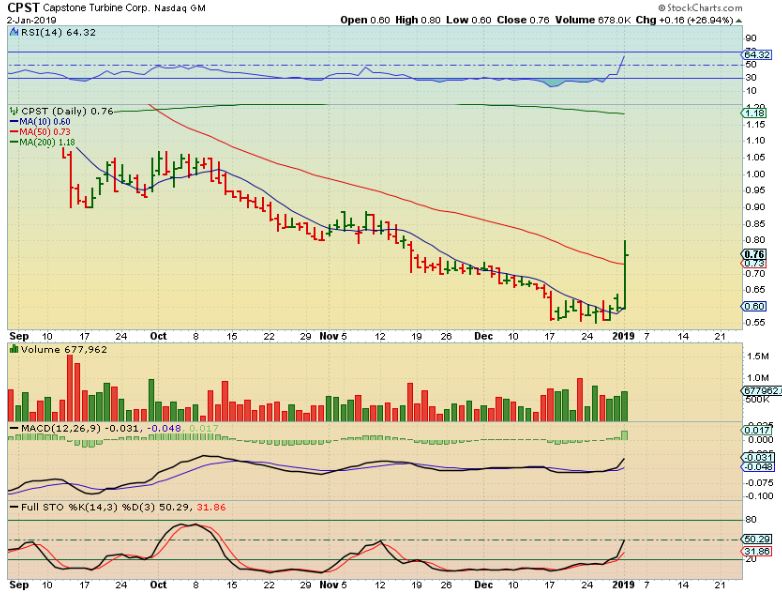
CPST – 28% POP out of that small base.
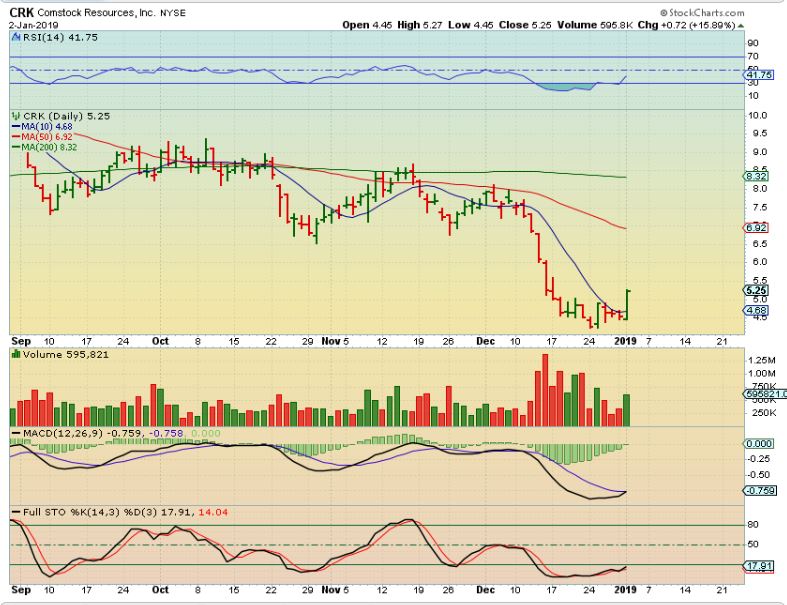
CRK – Another 19% POP, over the 10sma
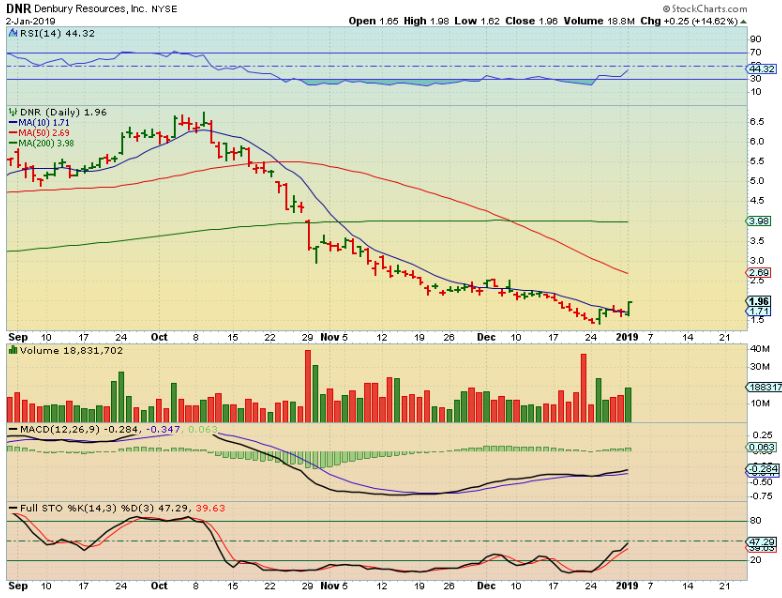
DNR – ANother 14% pop, over the 1o sma
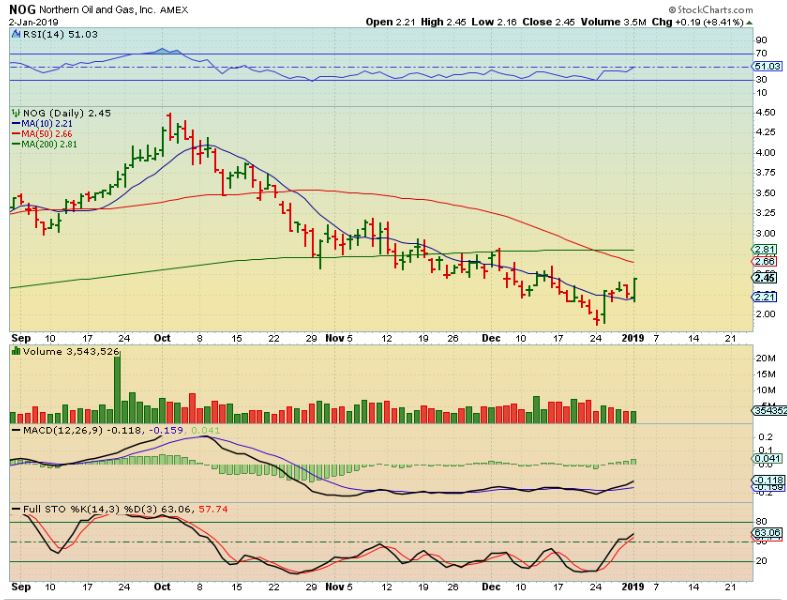
NOG – Another 8% POP
BAS – 22% POP
There are many more. So MANY in the Energy Sector are experiencing those nice %-Gains after a complete sell off / Beat down. We bought the lows, so far so good.
,
USD – The USD put in a strong reversal, and this looks to be a dcl. This would normally drop Gold, ESPECIALLY If Gold is on day 30+ of its 3rd daily cycle, but…
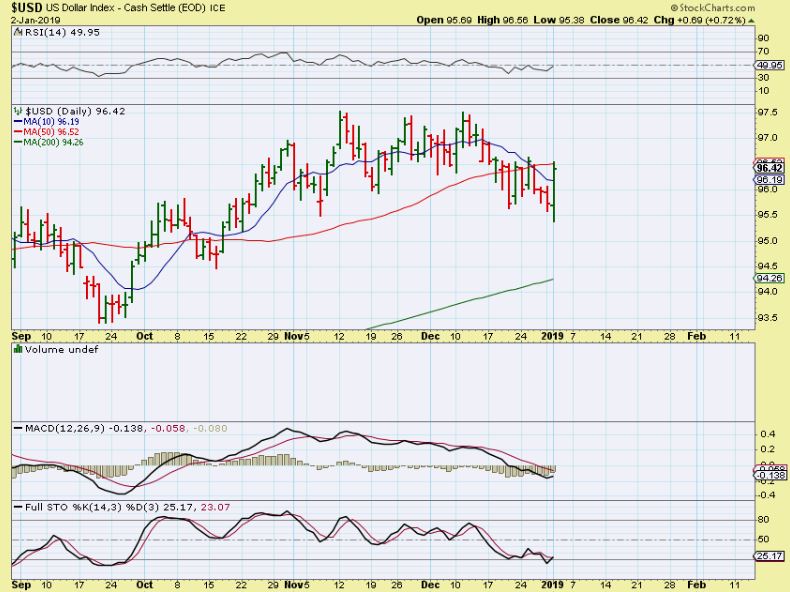
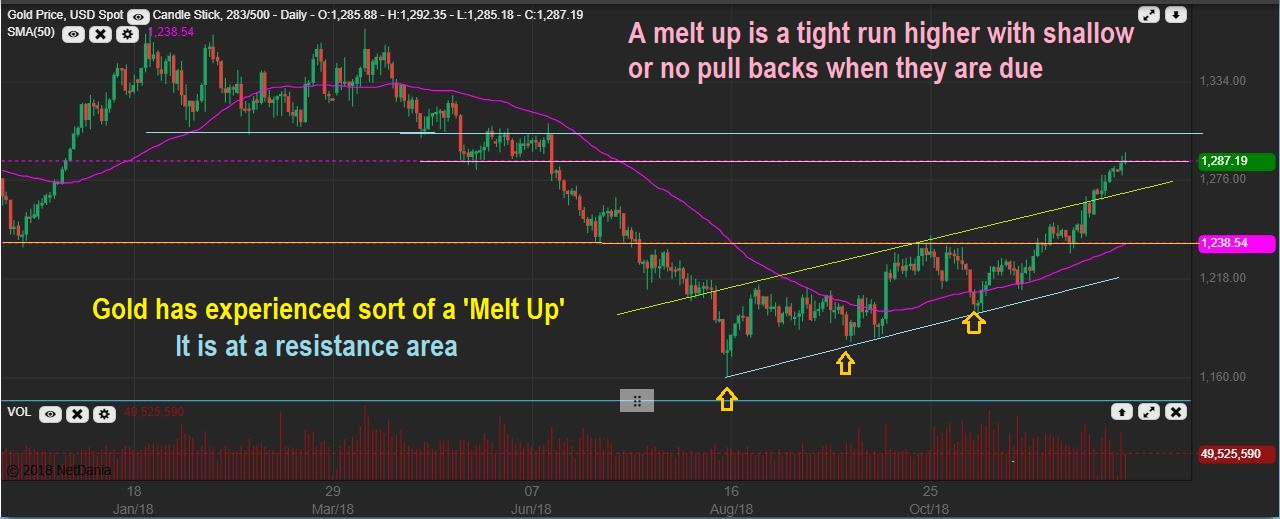
GOLD – Gold has been “Melting Up’ after breaking above prior resistance areas that formed a BASE. I discussed in my last report that even though we would normally expect GOLD to drop in a 303-36 Day daily cycle- this melt up can cause an extreme in the cycle count. We say OIL with an extremely long drop, and the Markets had an extremely sharp drop too. We are experiencing Extremes in the market.
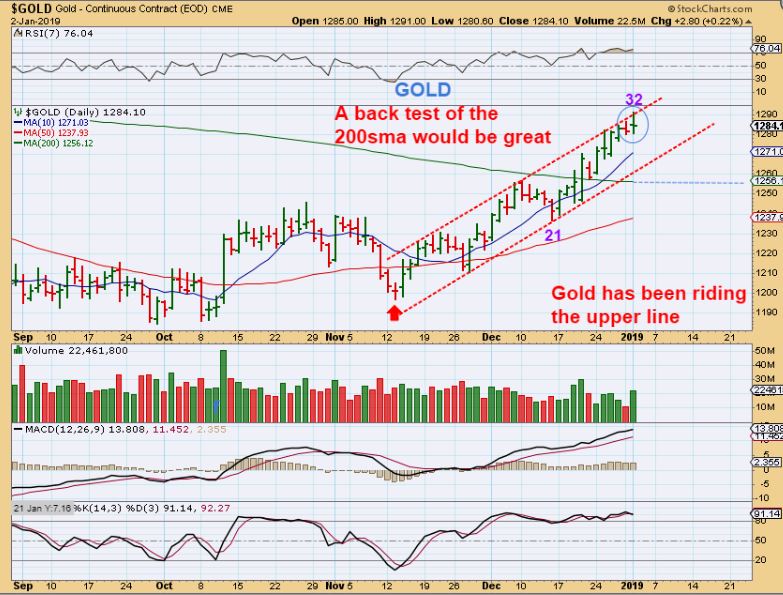
GOLD – Using stockcharts , it still looks to be climbing the upper trend line, but it still looks relentless once it broke the 200sma. That is a DOJI on day 32, NOW WE”LL SEE IF THE POP IN THE USD AND DAY 32 CAN START A DROP IN GOLD? We are due, but again, we have been seeing extremes.
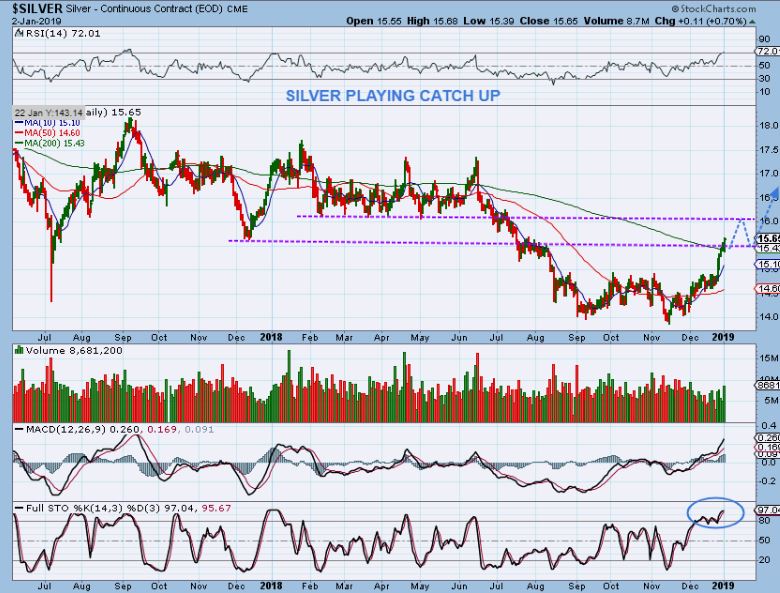
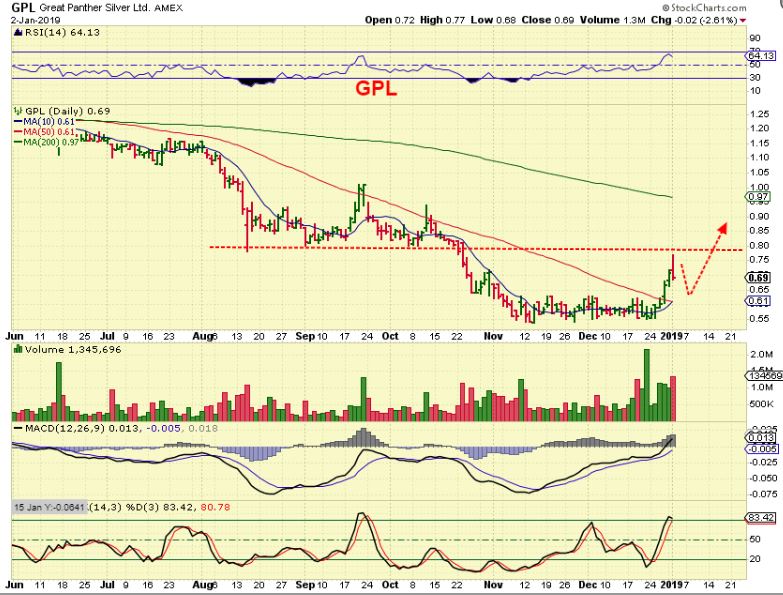
SILVER – Silver was inside of a base, but it broke out Last Friday and ran to the 200sma. IT ALSO BROKE OUT. I BOUGHT GPL DUE TO ITS BULLISH SET UP, BUT When it broke, many Silver stocks did not follow, but just yesterday a few more started to rise too. LETS TAKE A QUICK LOOK…
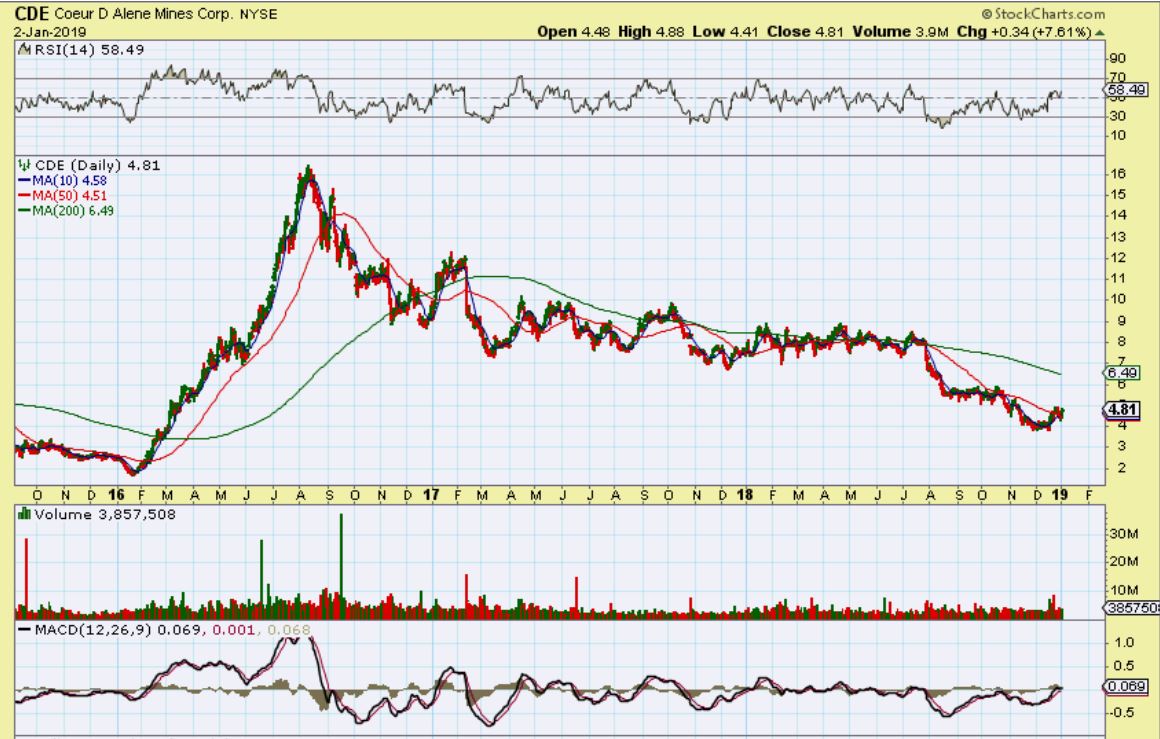
CDE ACTUALLY BROKE DOWN on DEC 28
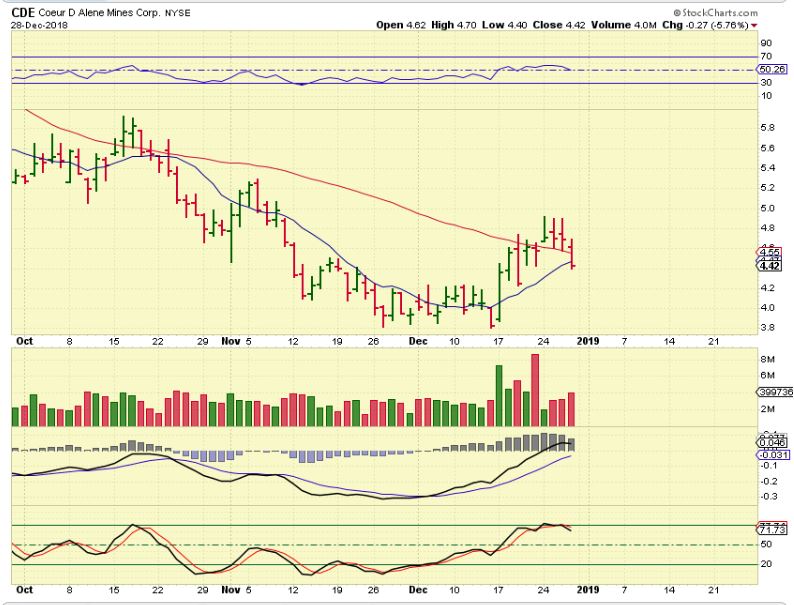
It then reversed , but didnt regain the 10sma or 50sma yet, but you could have bought this reversal with SILVER Breaking out
CDE Got 7% follow through and may just keep going. It is back over that resistance. Yesterdays report mentioned the Bigger picture view possibly in play, so this could be bought , In fact…
CDE- Take a step back and look at the Big Picture for CDE, and this looks quite Bullish breaking out now. Do we have Big Picture Buyers for CDE under $5 anybody? 🙂 This could run 100% over time and in 2016, well…
CDE – You can see $2 to $16 is an excellent run. The current move hardly shows up , but if things get going, you could buy this here, at $6 or $7 and still make good gains. 2019 looks to be a very promising year for Miners. If you bought the Sept ICL lows, but sold in the 2nd or 3rd daily cycle ( I traded in & out through that time) and now you are not holding Miners, you will still do excellent if we get the expected run higher. Buying Silver stocks may pay off, since they are still at their lows.
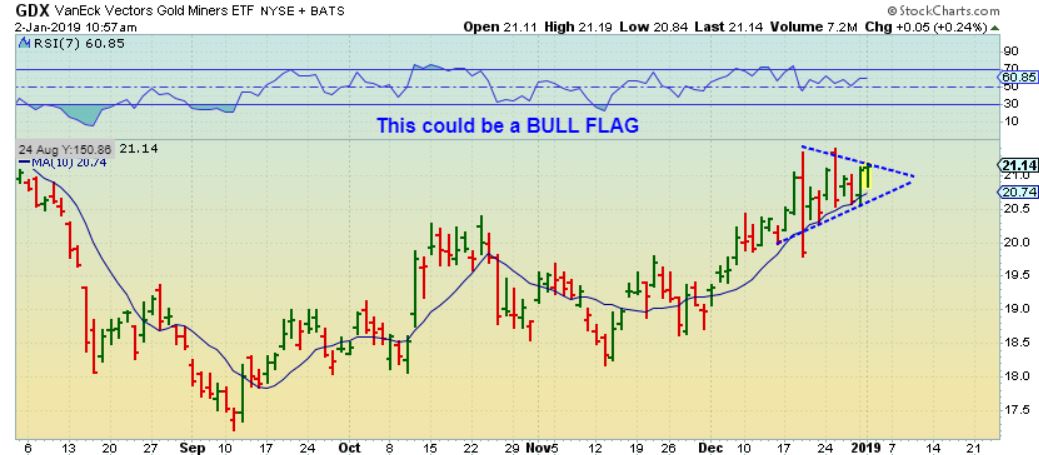
GDX – I grabbed this in the morning and posted in the comments that it is possible that MINERS are just forming a BULL FLAG over the 10sma. TRIANGLES DO OBSCURE CYCLE COUNTS, however another thing to note is this next chart…
GDX #1 – Normally I would consider calling day 24 a DCL, since it broke & closed below the 10sma, but when I learned cycles, I was taught that ” The cycle cant ‘Peak’ and put in a ‘Daily cycle low’ on the same day. IF IT DID, this would only be day 8, but again, I was told that cannot be a dcl. so…
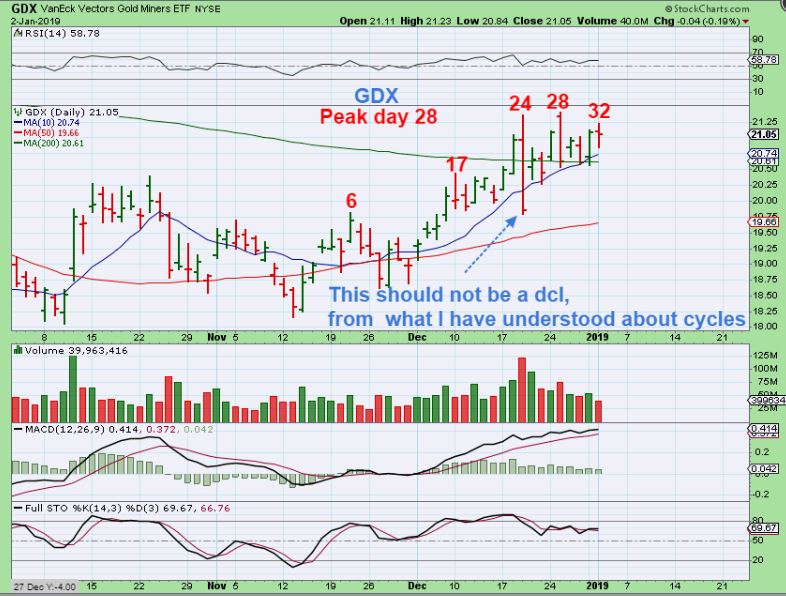
GDX #2 -DAY 28 is the peak so far, yet GOLD peaked yesterday again. With that we could say that the GDX:GOLD ratio is a bit bearish because Miners are not leading. A DCL is due. If GDX POPS out of a Bull Flag and runs, that would be a Bullish consolidation and the run should continue to the next resistance. GDX is holding above the 200sma, so you could buy this flag with a stop, but yes- it has been choppy and difficult.
GDXJ – Broke and closed above the 200sma. On FED WEDNESDAY, GDXJ Popped to the 200sma and sold off to the 50sma. It then started a choppy climb back to the 200sma as expected and mentioned in the reports since then, but now it has broken and closed above that 200sma. It has been very choppy , but that is a Bullish development.
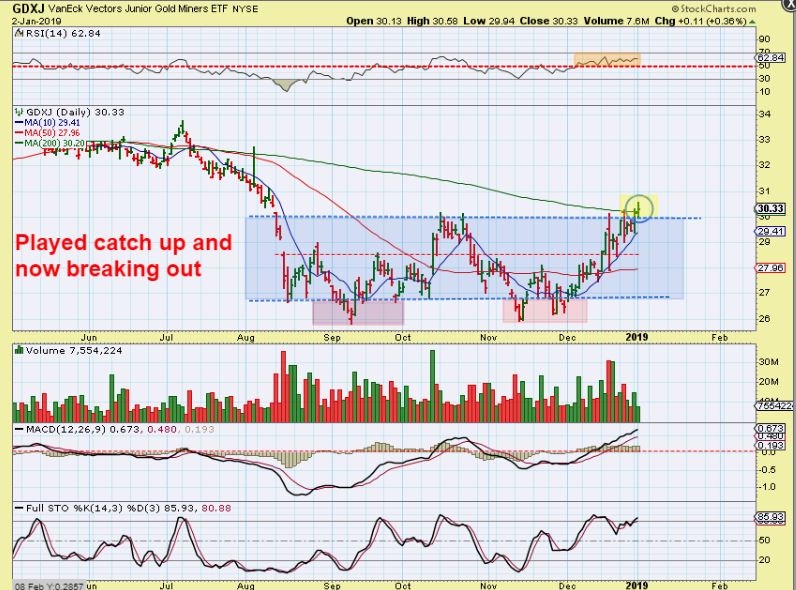
GDXJ SAME CHART- So this is a bullish development. The volume was very light, but breaking from a large base should lead to higher price over time, whether it stalls , pulls back, or just keeps crawling higher. Bases build energy for higher price.
.
WE HAVE BEEN DISCUSSING MANY MINERS ACTING BULLISHLY- I WANT TO LOOK AT A FEW MORE MINERS
.
ALO -I POINTED OUT THAT ALO COULD BREAK THIS BASE & RUN. THIS WAS DECEMBER 20
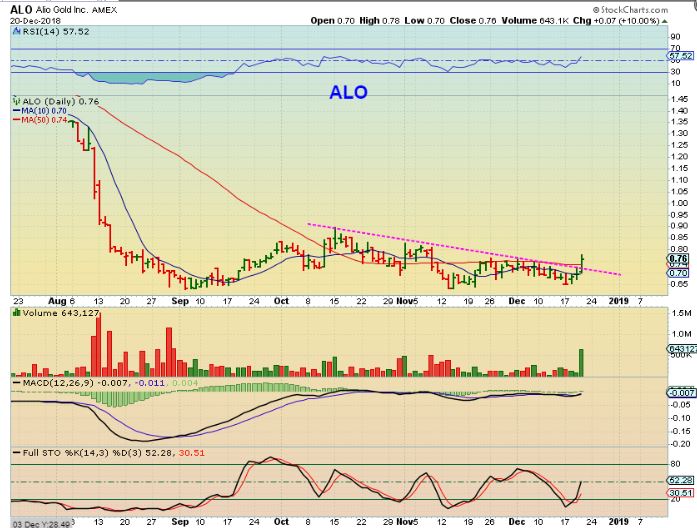
ALO – It has slowly been moving higher and is now above the base. THIS COULD RUN, but I also pint it out to say that…
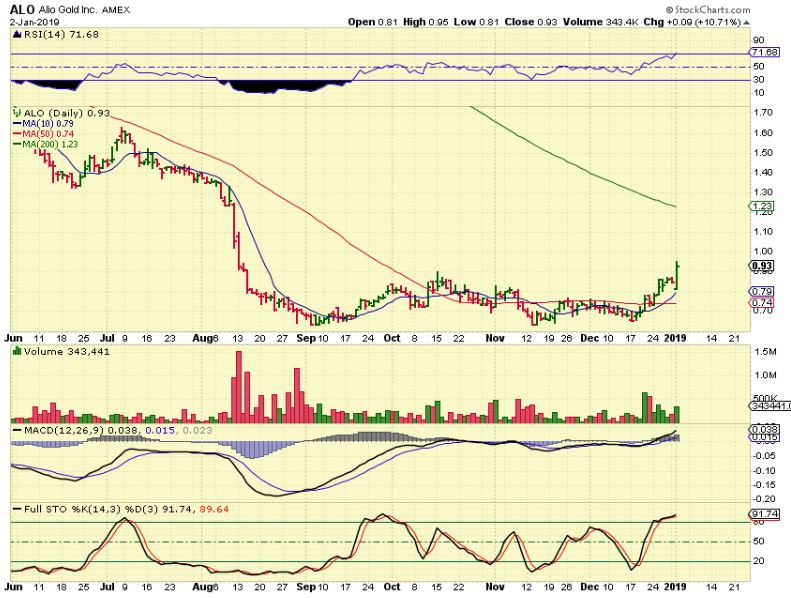
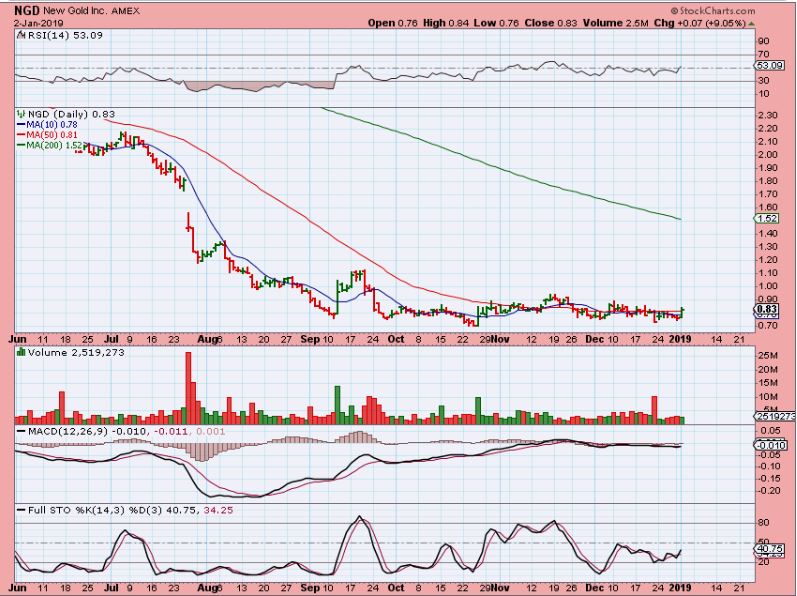
NGD LIKE ALO – NGD has a very similar base. This could be bought right at the lows, so you would have a low risk entry with a stop under the BASE, with the expectation that this will break the base & make great % gains over time. Even at what could be considered a low risk entry with a stop, There is additional risk with Miners when earnings come out, so please have a basket and not LARGE POSITIONS all in one stock.
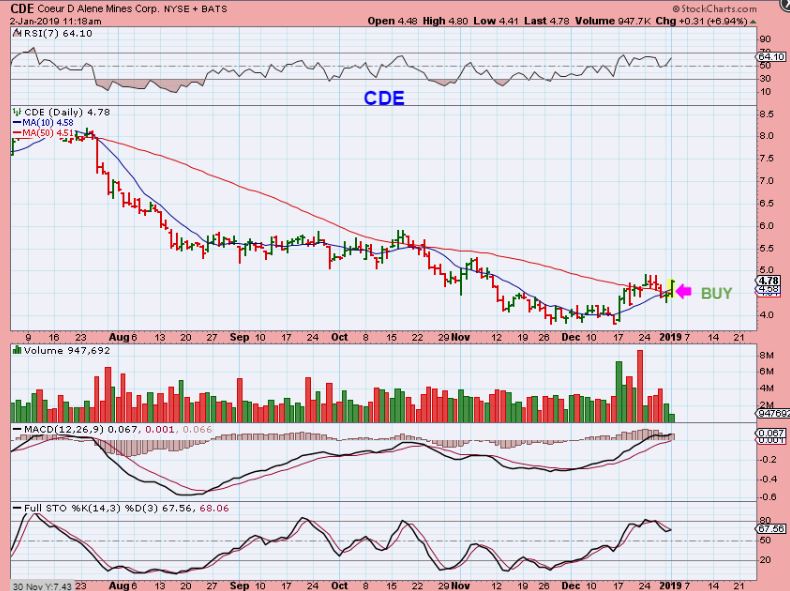
CDE- Again, I’d consider this a buy in this area.
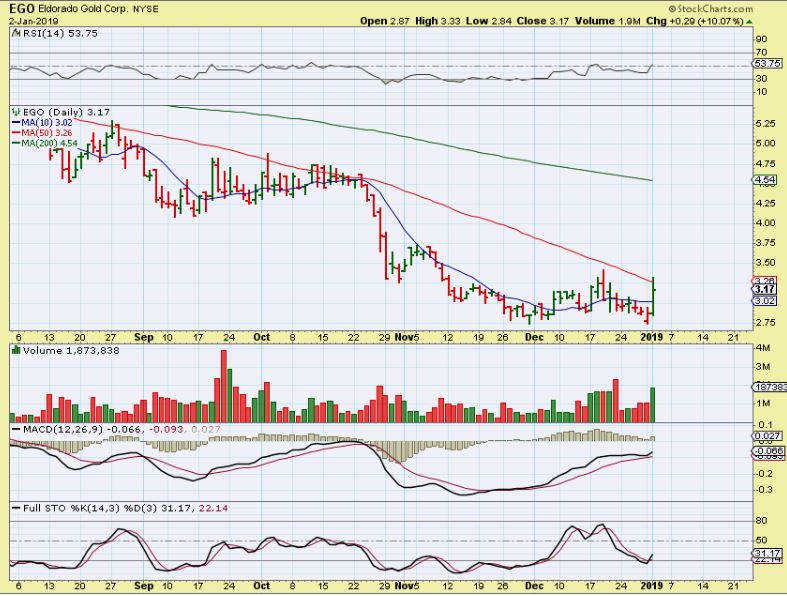
EGO – Right at the lows, EGO decided to start to play catch up. If it breaks above that 50sma, even EGO may start to play catch up. The MACD is excellent and this is a small constructive base.
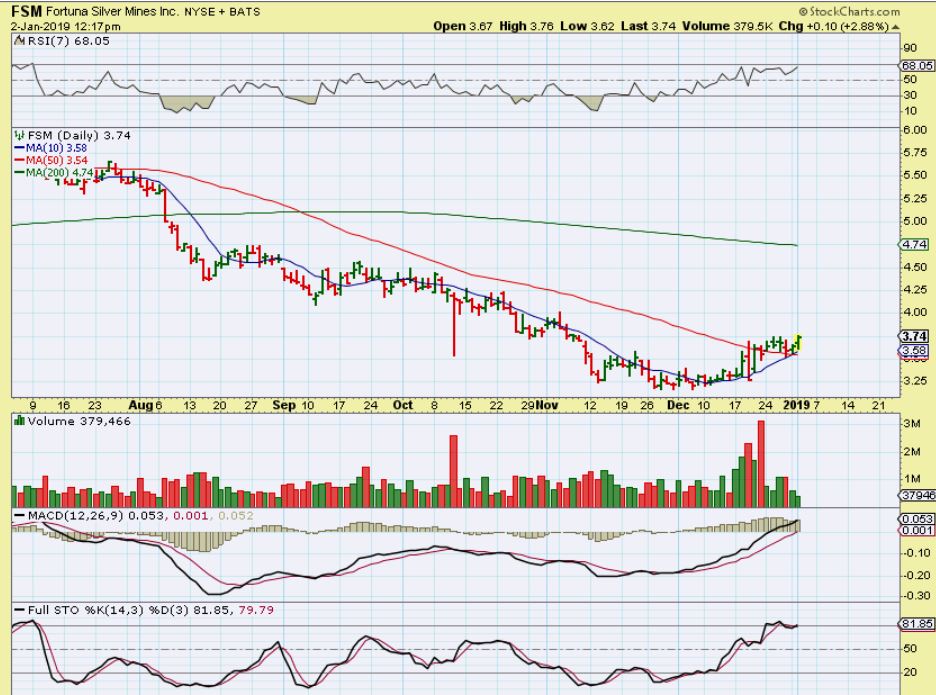
FSM – I bought FSM and it ducked under the 50sma Friday as Silver broke out, so I dumped it. Guess what- it looks great to me. This is a buy that may play catch up to Silvers break out. We are seeing a melt up in Gold, Catch up in Silver, and Miners vary . MANY SILVER STOCKS ARE STILL AT THEIR BASES. THEY WILL MAKE GOOD GAINS.
GPL – I sold mine near 70 cents (just under) for a quick trade. Yesterday it hit a resistance area and reversed. This will be a buy if it tags & reverses at the 50sma ( back test).
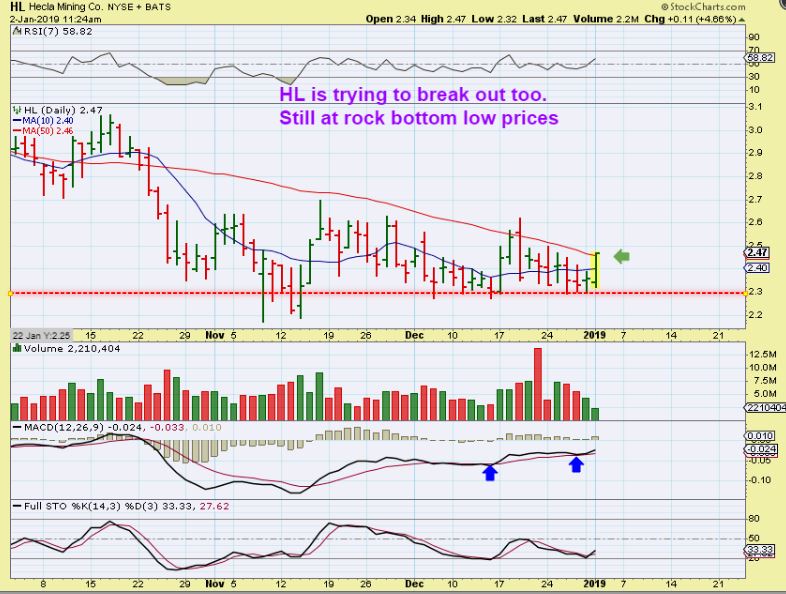
HL – I posted this as a buy in the comments section. I called it very cheap & oversold on the long term charts. HL is STILL AT THE LOWS, if you want a Miner in a base. It actually closed at $2.47 too.
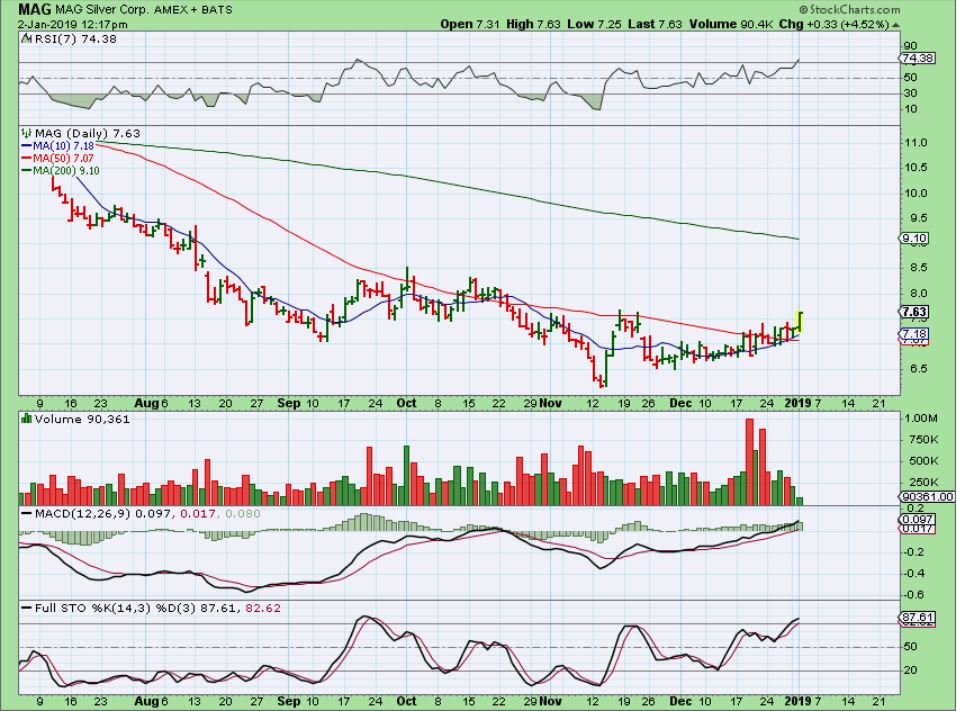
MAG – This was Midday yesterday. I also mentioned that I bought MAG over a week ago, but that was before the GOLD MELT UP, and due to the choppiness, I closed my position ( day 30 was also approaching, and Silver hadn’t broken out yet). Now that Silver broke the base, this may run to the 200sma. If we get a dcl, this may simply tag the 50sma as a back test.
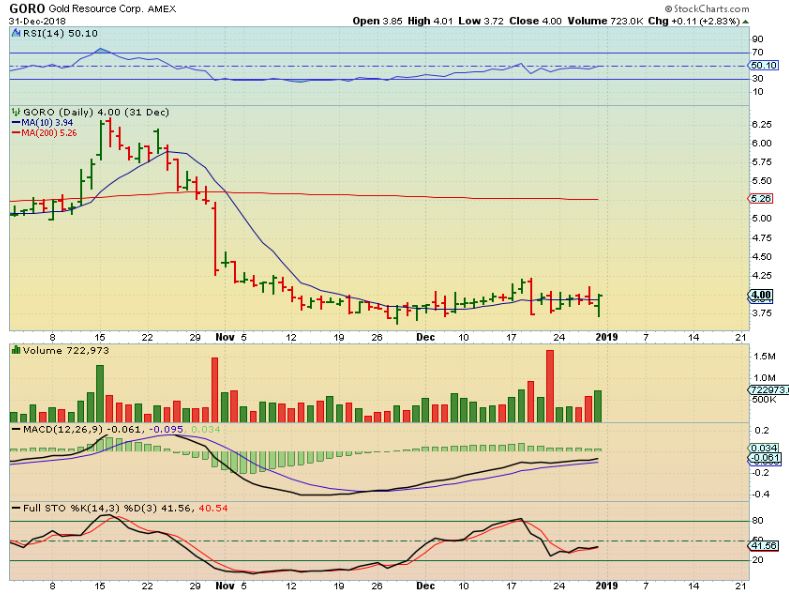
GORO – STILL AT THE LOWS ( I would watch this one a bit longer, but it has regained the 10sma in a base, and the 50sma is overhead- not shown)..
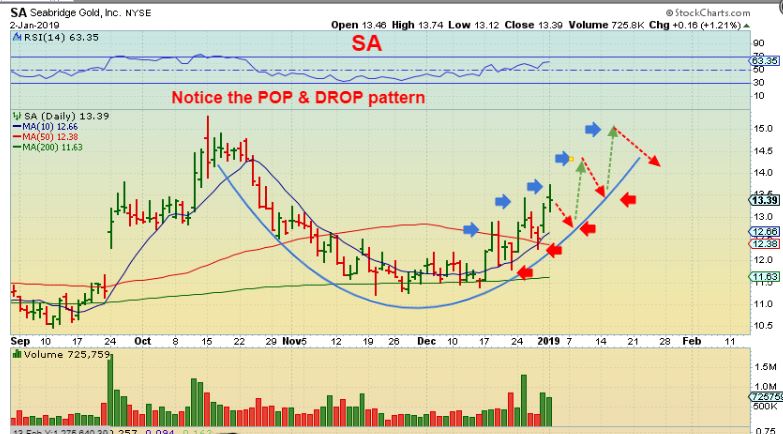
SA – SA POPPED & WAS A BUY breaking the down trend..
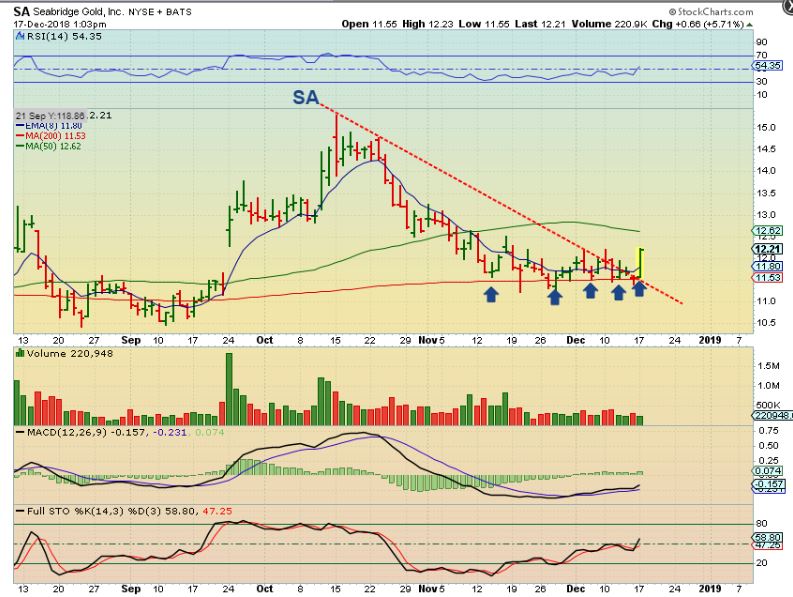
SA – I pointed this out Monday in the comments section…
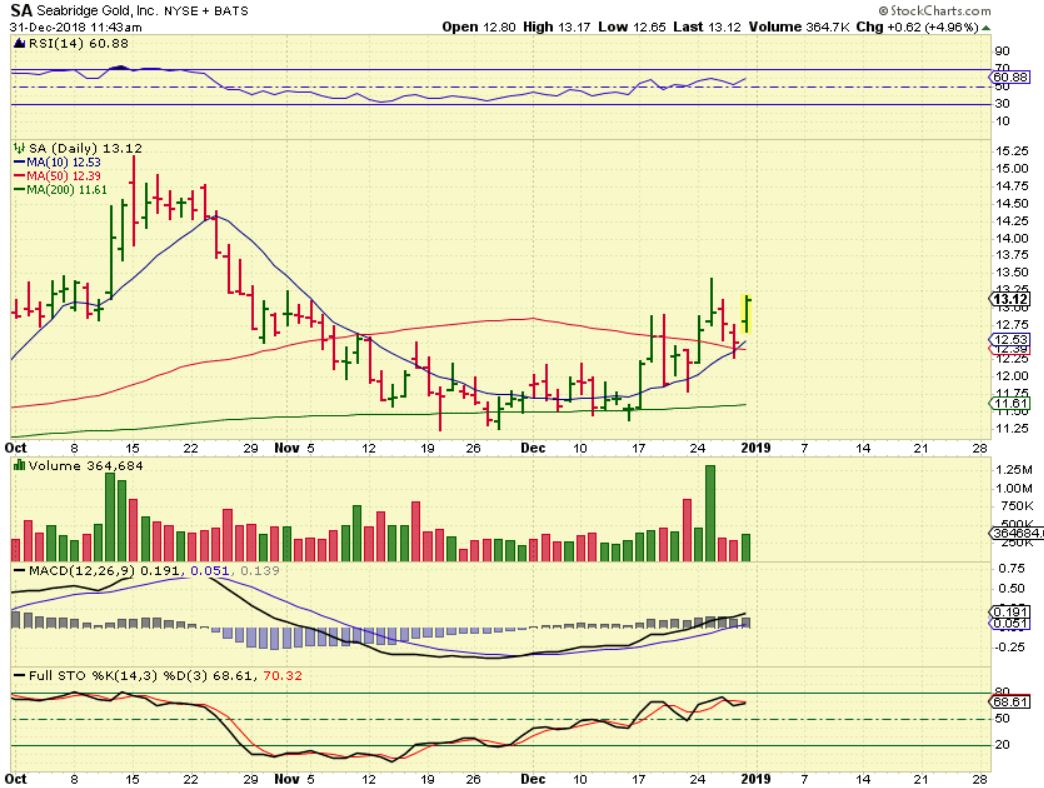
SA – it POPS, and pulls back for 2 days, POPS and pulls back. It may just ride up the cup and 10sma similar to this. I like was asked about it stalling yesterday with Gold at new highs , and I still it. It may just do its own choppy climb.
General Markets have a swing low, Oil has a swing Low & energy trades have been making gains so far, the USD looks like a dcl. Gold ignored it and Silver & Miners are bullishly moving higher, though choppy at times. I will have a few more trade ideas below . Enjoy your Thursday trading!
.
~ALEX
.
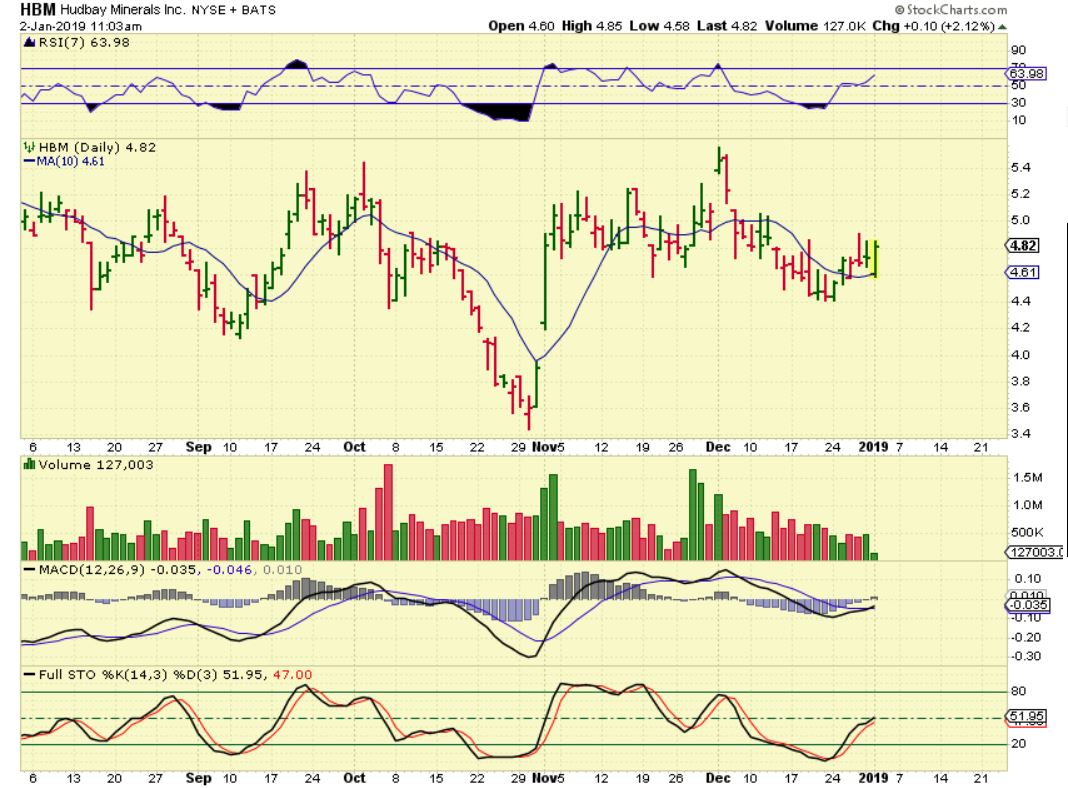
HBM – Copper was down but WRN , TGB, HBM , FCX Popped. This could be an inverse H&S on HBM, and looks bullish, even though Copper DROPPED. Something to keep an eye on. I’m not buying here yet…
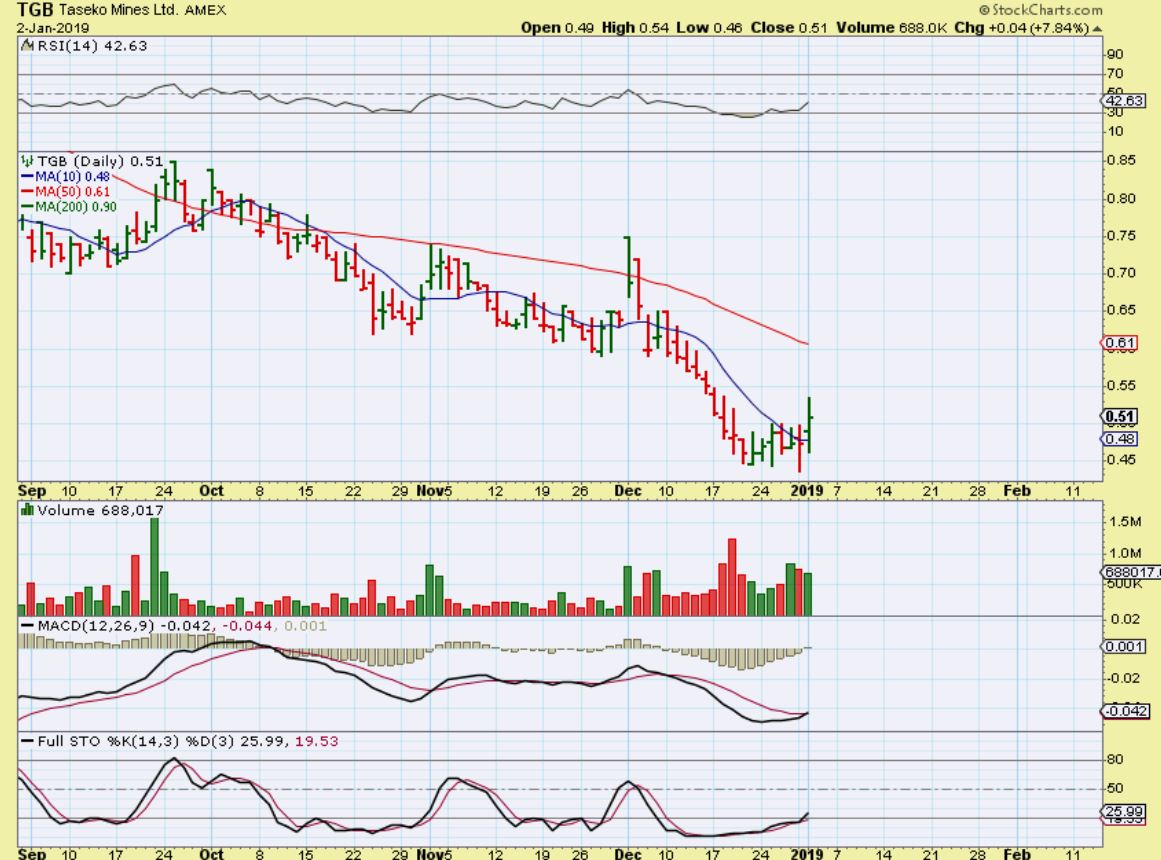
TGB – TGB also Popped with Copper dropping, so I am keeping an eye on this area.
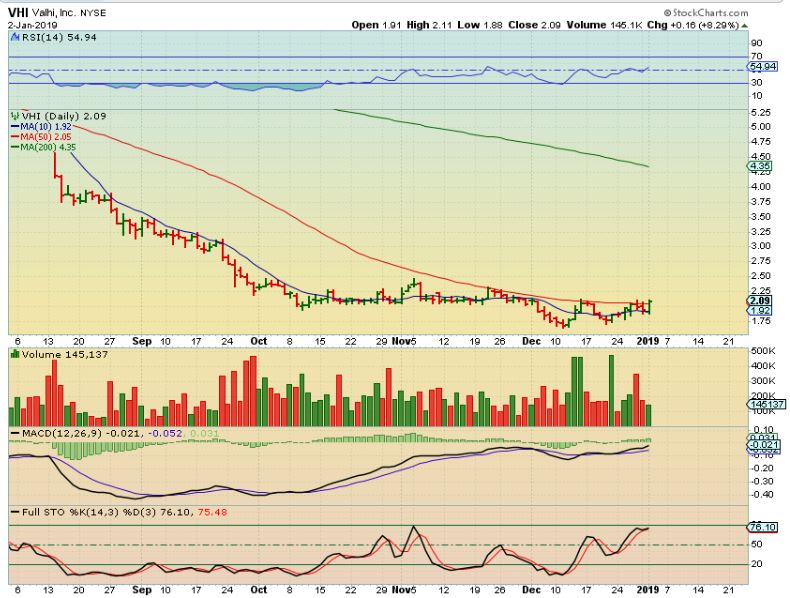
VHI – I bought and still own this. Above the 50sma it could run higher out of a solid looking base (Barring any bad surprises).
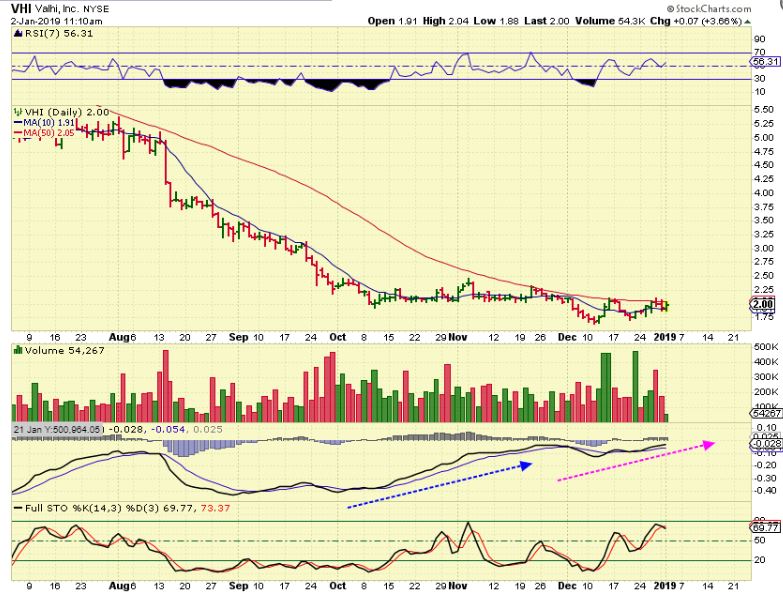
VHI – It closed above that 50sma. I added a little bit to my starter position. The MACD is climbing.
BRZU – Back in November, I used a couple of charts to show that BRZU seemed to have bottomed and had a large run from $15 to $32. It then pulled back to $28 as a buy. From there it actually went sideways and stagnant & crawled along under the 200sma…
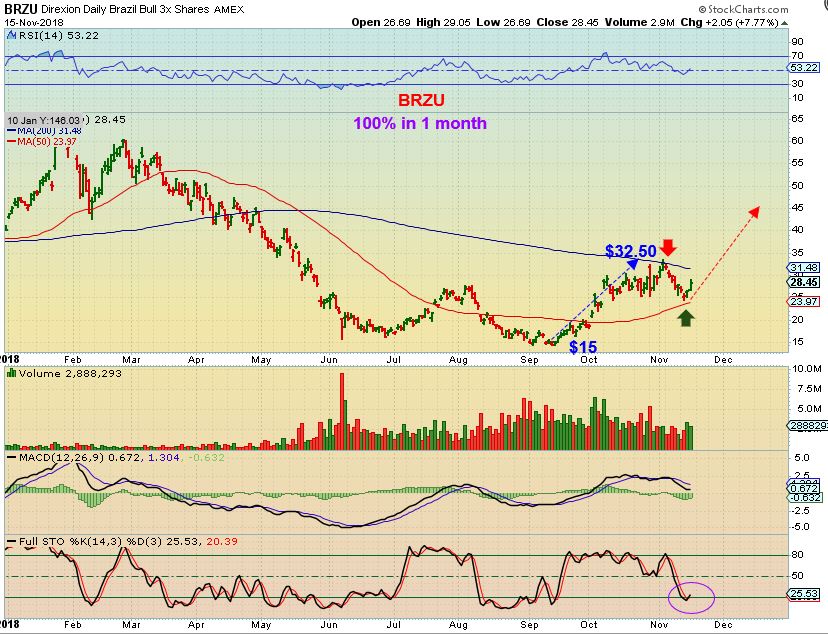
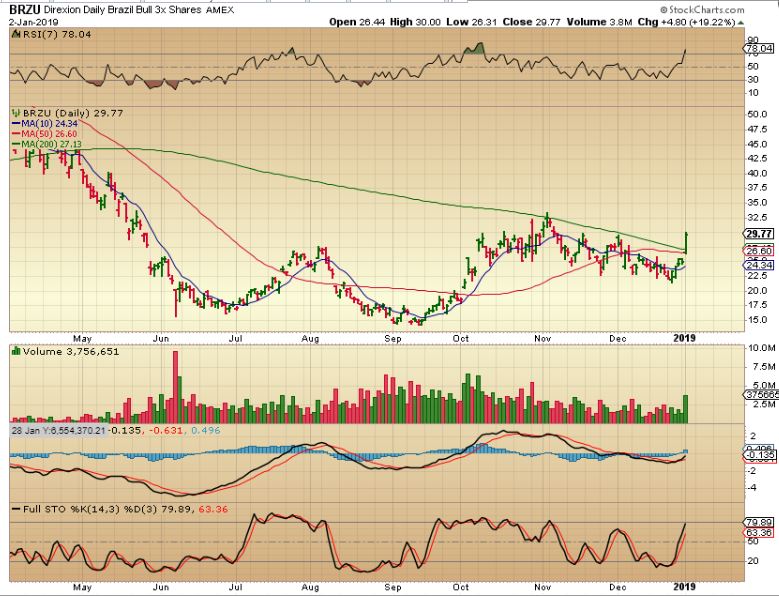
BRZU – Until yesterday. BRAZIL is now breaking out again. It is not usually an easy ride, it can be choppy, but I would buy a pull back if we got one from here. It may just take off & run.
In a recent report I mentioned that I was seeing things in the MJ sector that looked to be shaping up Bullishly. I said that I would be watching, and then I said that I had been buying a few. I also have been posting in the comments about various stocks recently. Progress was really evident yesterday…
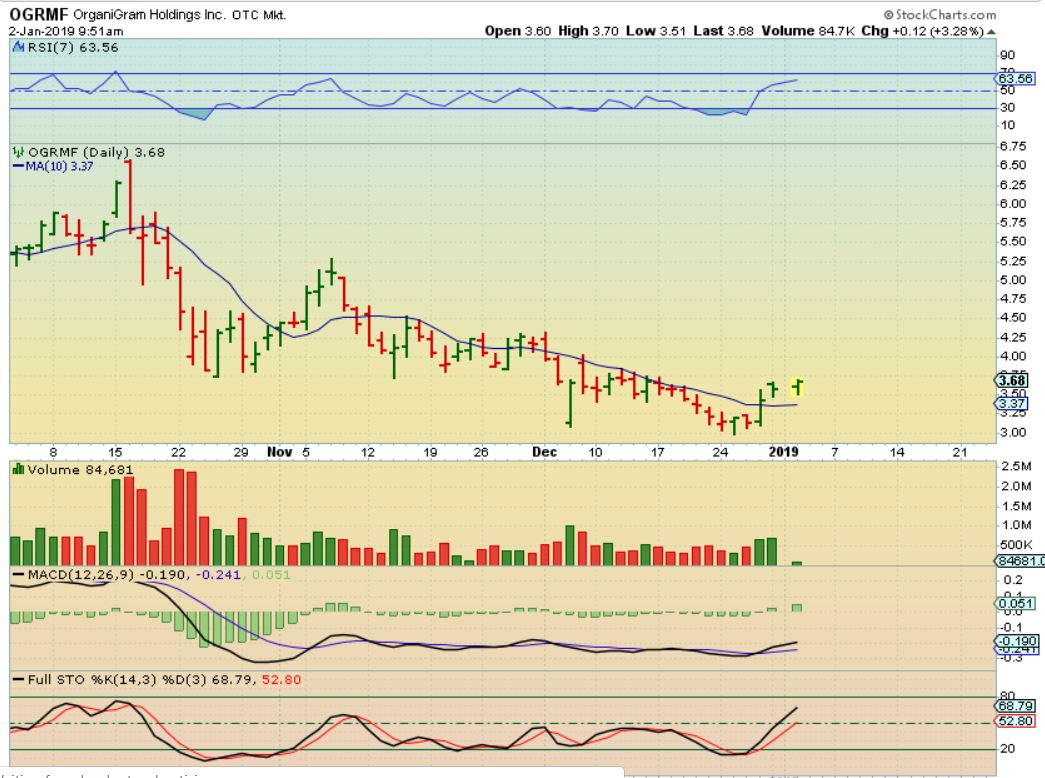
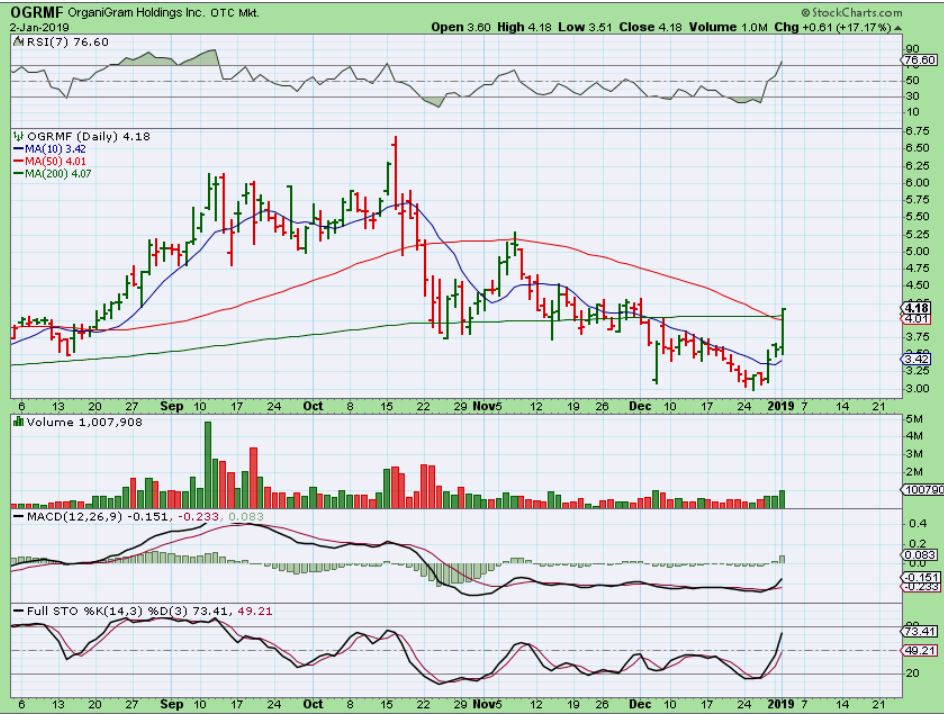
OGRMF – I posted this at 10 am. A pop and holding the 10sma.
OGRMF – It shoy up 13% and tagged resistance at the 50 & 200sma. Can it break through?
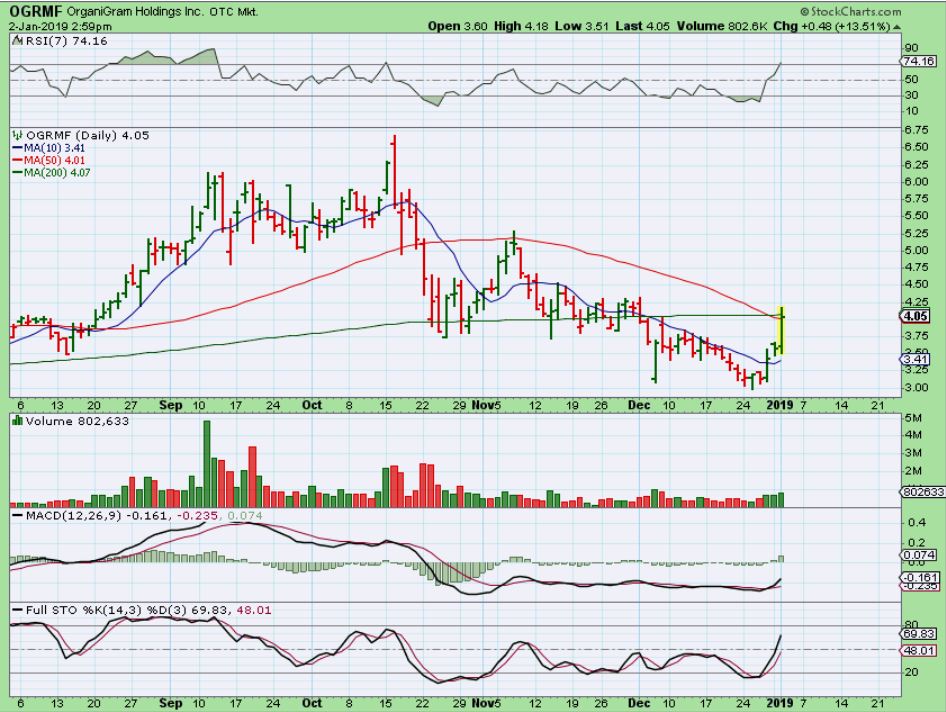
OGRMF – It did by the close. These are strong when they run.
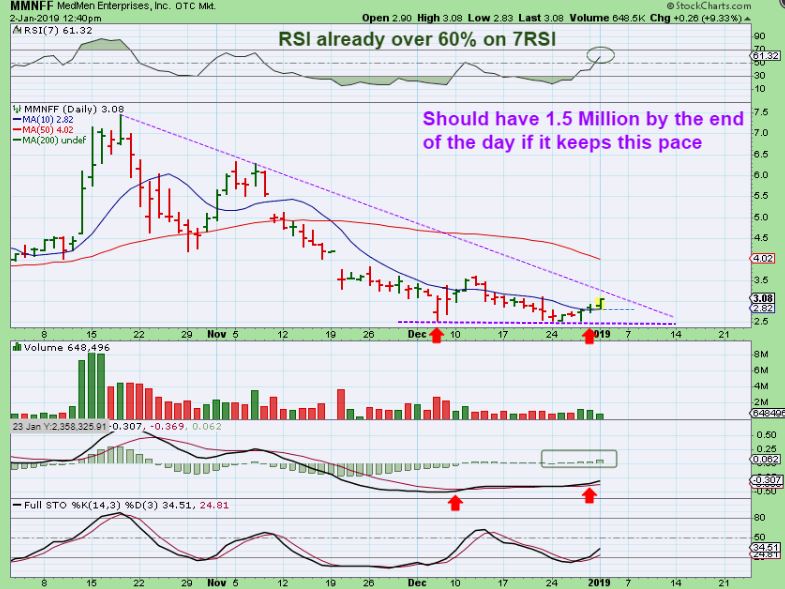
MMNFF – TAMMIE asked what I thought of the chart for MMNFF? I mentioned that I just bought it and posted this chart. I liked the double bottom base, and I liked the company. I calculated that it would have near 1.5 Million by the close, that would be Good for this stock moving out of a base…
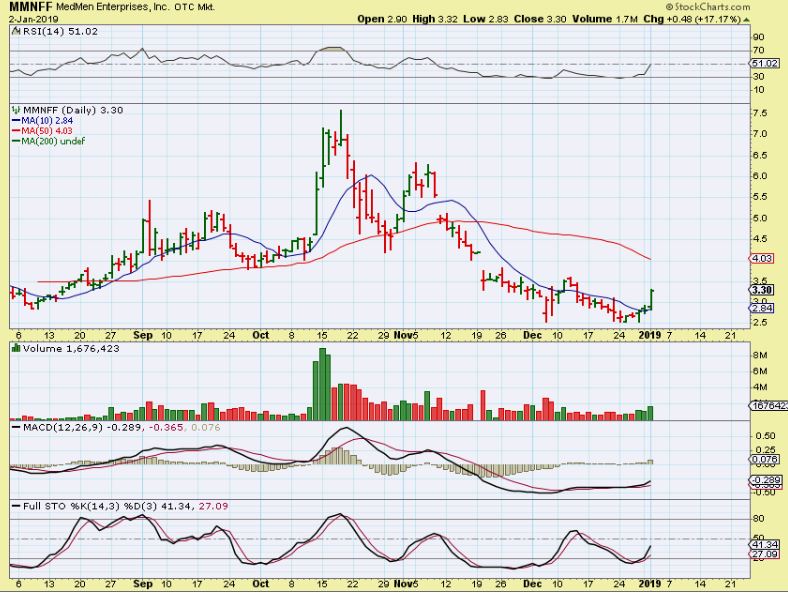
MMNFF – It continued higher and closed up with 1.7 Million volume. I will see if it tags the 50 sma, but many of these are just breaking out higher. When these run, they can really get going.
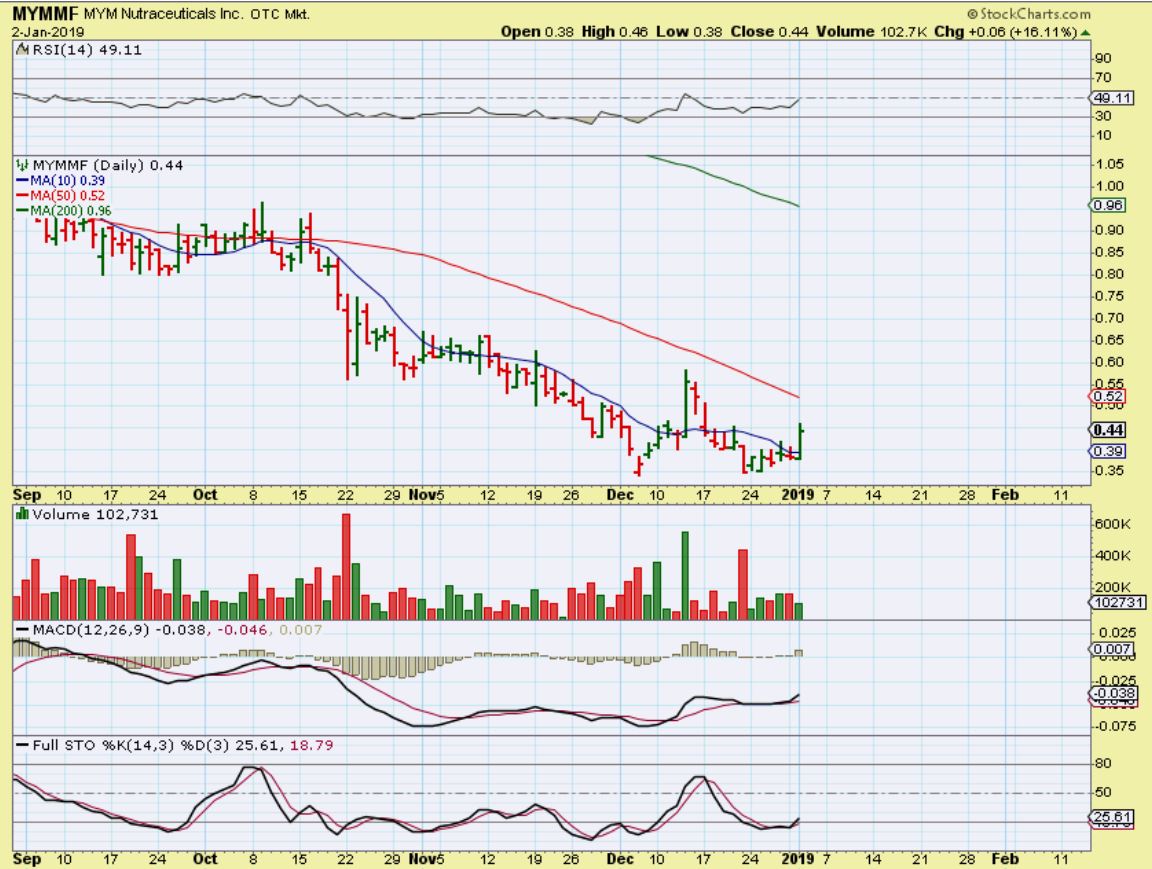
Yesterday, this whole sector caught fire, and I saw many companies up 15-30% actually, great for a few good day trades – trades that may last 1-4 days, but if the set ups continue to form and look right, I will post charts with entries. You can TRADERS CAN SEE CHARTS OF TGODF , MJNA, IMLFF, SPRWF, ISOLF, MYMMF , ATTBF (double bottom?) , NXXTF, VVCIF, and so many others if you have your own watch list made up. Here is MYMMF for example…
MYMMF – So this popped 16%, but it popped more than that 2 weeks ago. This is why I say that the set ups may be 1-4 days. Until these progress and set up further, maybe form a btter base or back test supports, they are short term trades that MIGHT play out longer term. Nice MACD.