December 26th – A Report Discussing The Miners
Monday was only a 1/2 day of trading, and in my weekend I mentioned that I found something interesting pertaining to the Miners that I thought was important to share at this time, so I want to devote most of this report to that discussion.
Let’s just briefly discuss Mondays trading:
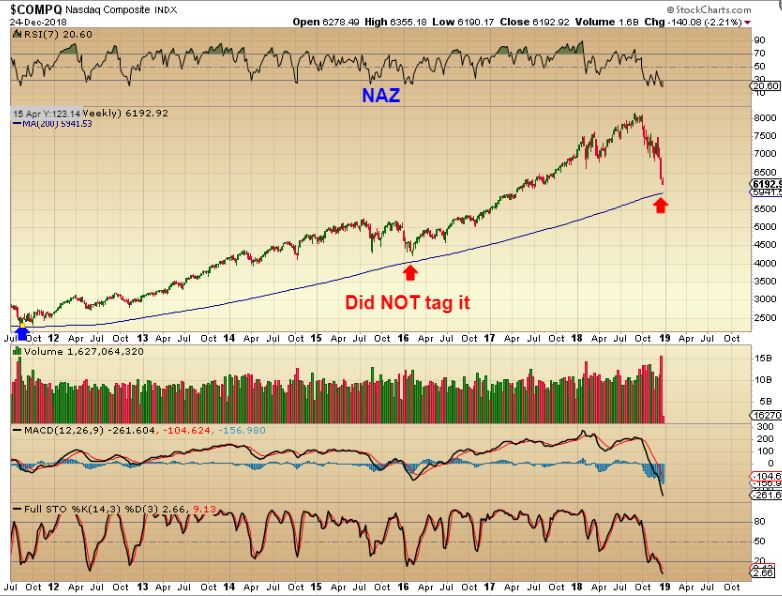
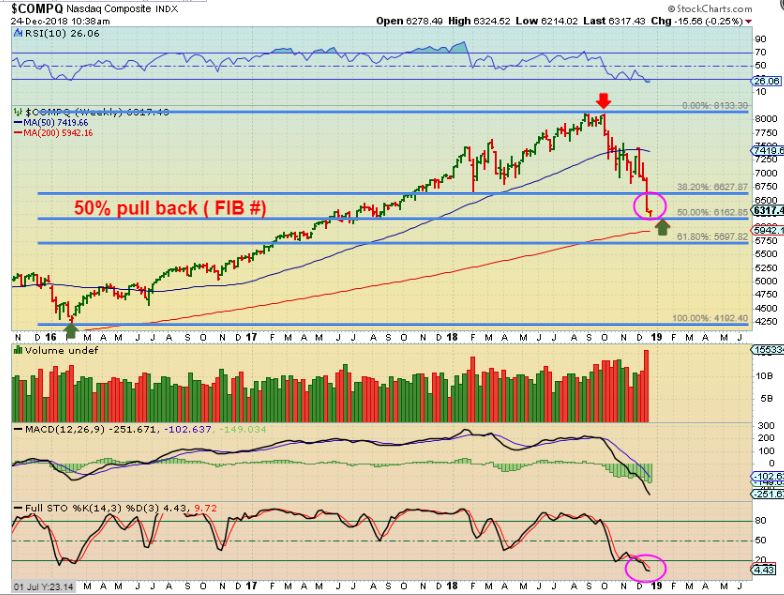
I am seeing the NASDAQ drop to a 50% retrace with capitulation type volume, as seen in Februarys ICL (lows). Could it tag the 200 week ma? Yes, but it actually did NOT tag it in early 2016.
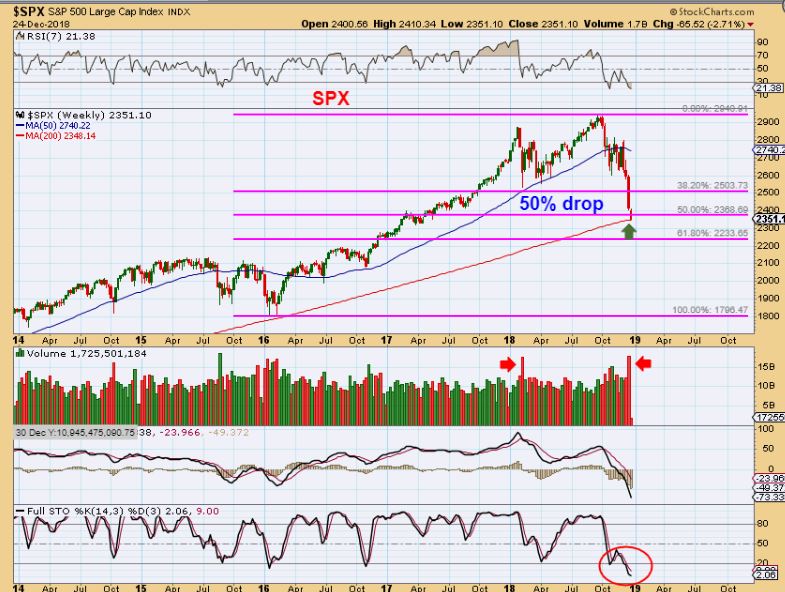
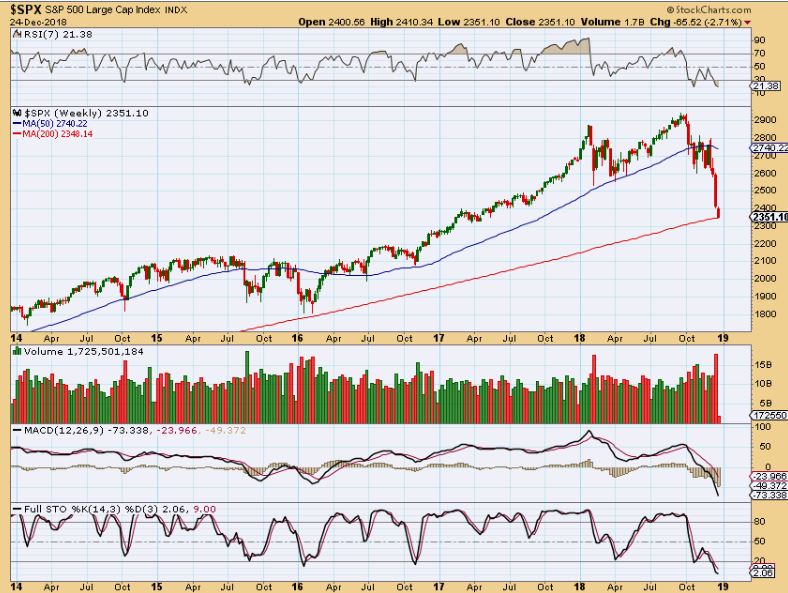
SPX – The SPX actually landed right on the 200 weekly ma, like it did in early 2016. That is roughly a 50% Fib retrace too. Notice the capitulation type volume ( a flush out) similar to the Feb lows. I think that the ICL is very close to a meaningful bounce.
When I look at the Equity Market Sentiment ( FEAR AND PANIC), and I look at the Puts Call ratio, I Look at the cycle count, the Fib #’s, The number of stocks trading below the 50 & 200sma, and a number of other things etc etc etc, it really looks like we are very close to an ICL. I will have to watch how the first 2 daily cycle play out from there, but a snap back rally seems overdue. A 1-2 month rally in the General Markets would also fit in with a pull back for Gold into the next Gold ICL.
.
NOW TO THE PRECIOUS METALS-
.
GOLD – Gold moved higher Monday, and Gold has been bullish after putting in a base of choppy sideways action in September & October. Let’s zoom in…
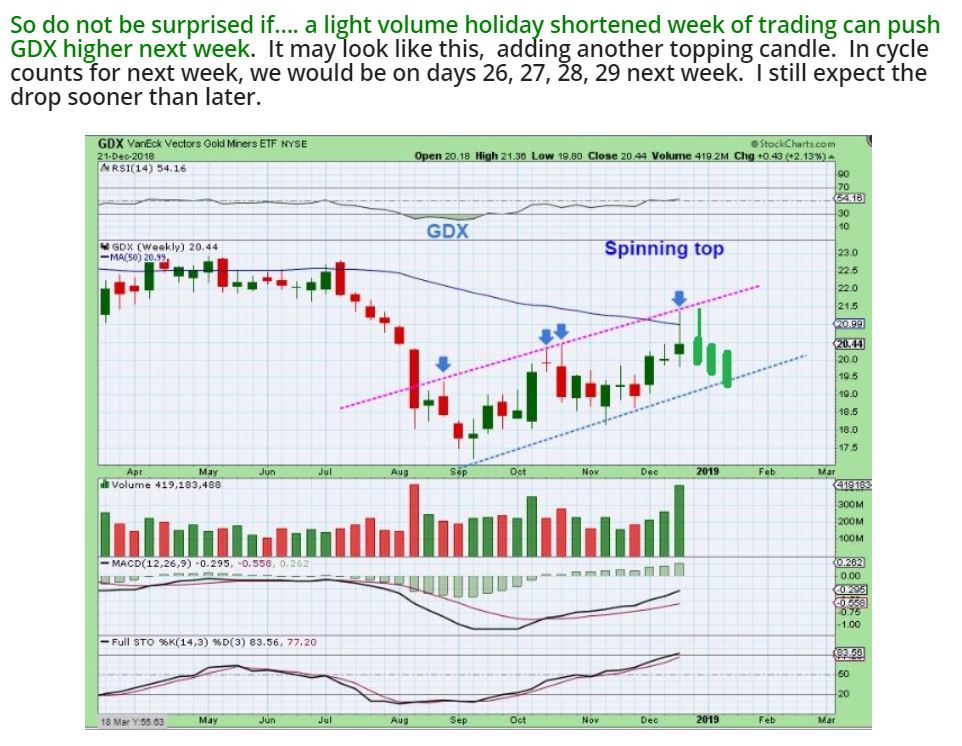
This was from the weekend report : A higher high in Gold is still possible
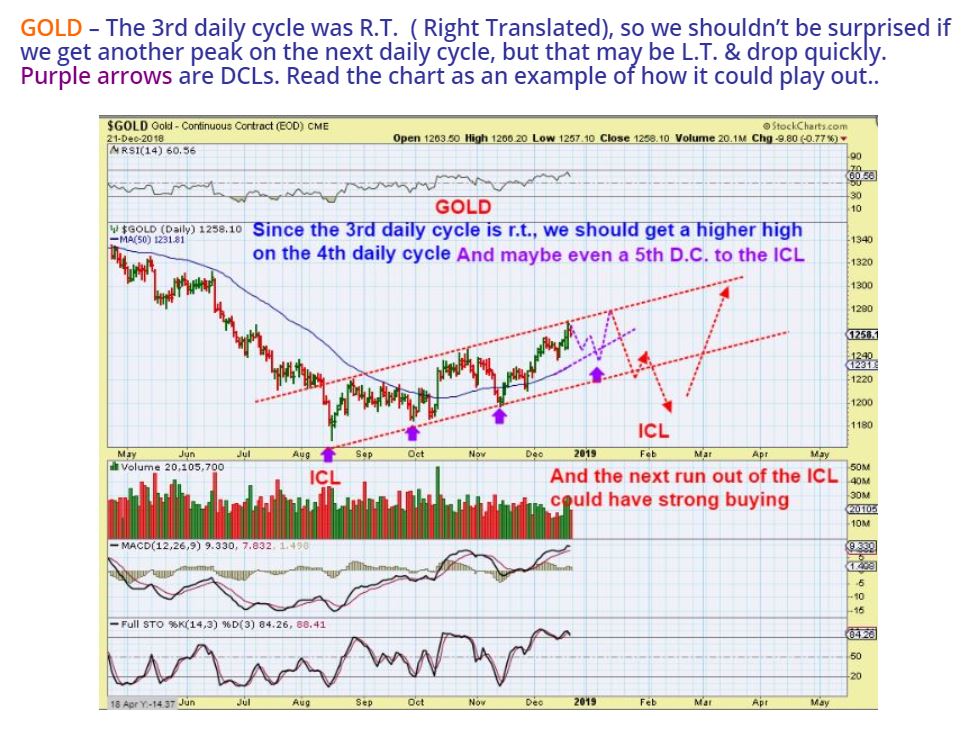
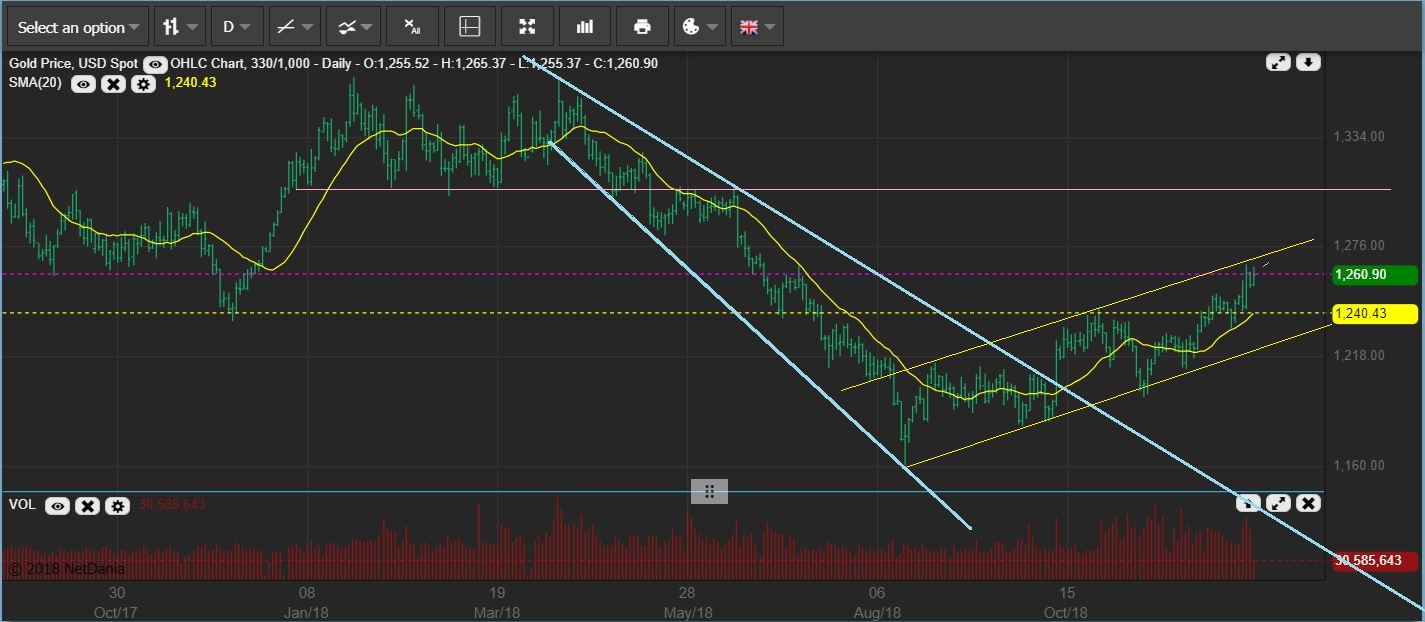
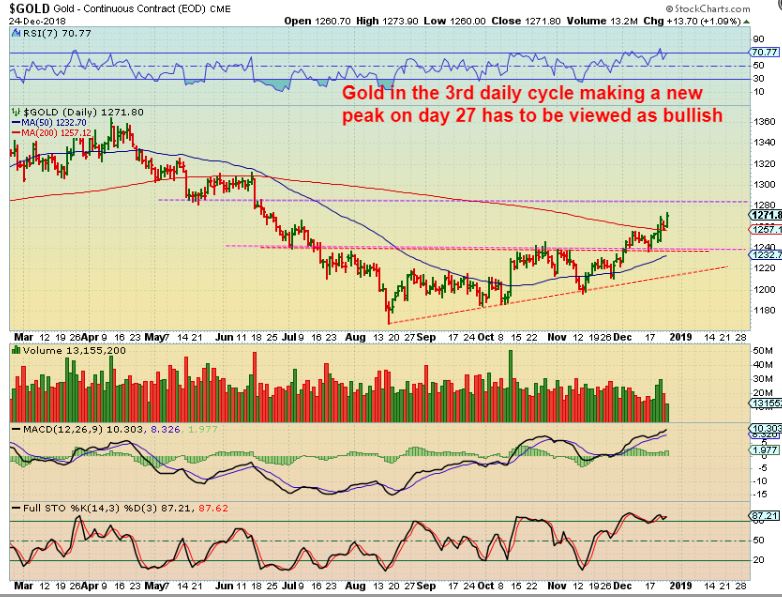
So as GOLD continued higher, it has now broken above the daily 200sma. This has to be viewed as bullish, since this 3rd daily cycle looks far more bullish than that ‘weak’ looking first one. The 2nd daily cycle actually Popped, went sideways, and dropped sharply too. This has stair stepped higher right out of a base. So right now, GOLD is acting Bullishly, but I still have to expect a drop to a Daily Cycle Low. Let me draw how that may look…
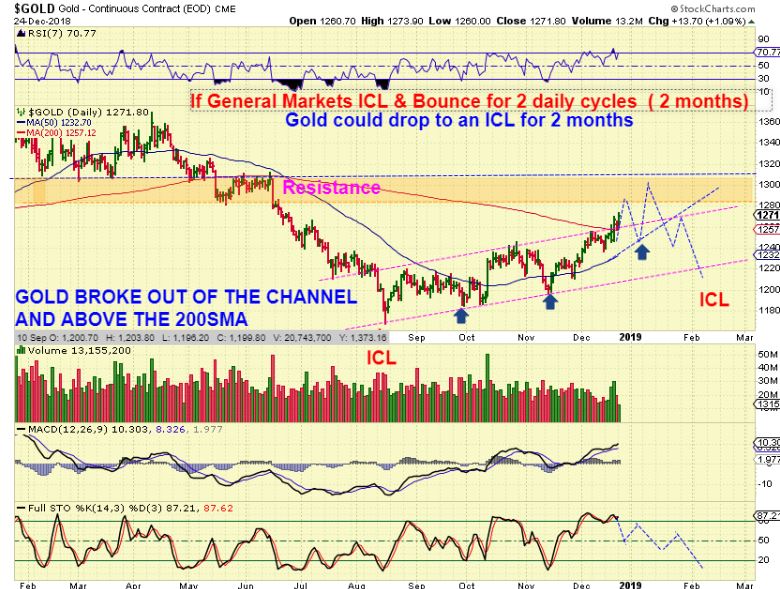
GOLD – Gold can push a bit higher, but if the markets bounce into February out of an ICL, with 2 daily cycles out of that ICL, Gold may drop back into February as shown. If GOLD just continues higher with the Market bounce, then something more bullish is happening, and that is what I want to discuss.
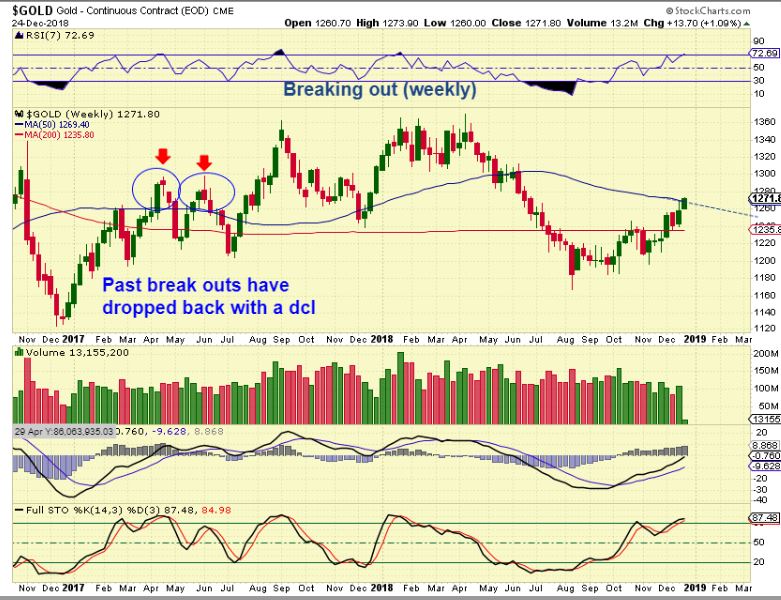
As of MONDAY, GOLD is pushing above that WEEKLY 50sma. That is viewed as Bullish, but I have circled 2 similar moves that still dropped back under it into their dcl, so I am still expecting that Gold can do a false break out and drop here like it did back then. We should know soon enough, but this has been a strong 3rd daily cycle. .
GDX DAILY as of Monday – I did mention that we could get 2 tags of the upper trend line, but it is impressive that GDX closed above the 200sma after all this time, when it also put in such a choppy bottom.
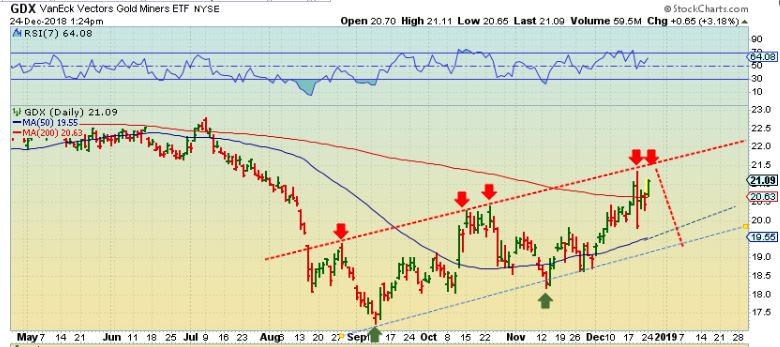
In Fact, I put this in the weekend report. I was discussing how GDX could make a new high, HOWEVER, I said light volume holiday trading. GDX & GDXJ had STRONG VOLUME for a 1/2 day holiday trading session.
.
SO NOW THIS IS THE PART THAT I SAVED FOR THIS REPORT. I WANTED TO GO BACK AND LOOK AT PAST ICL TO ICL MOVES WITHIN A BULL MARKET, AND FOUND IMPORTANT AND INTERESTING SIMILARITIES TO WHAT WE SEE NOW …
.
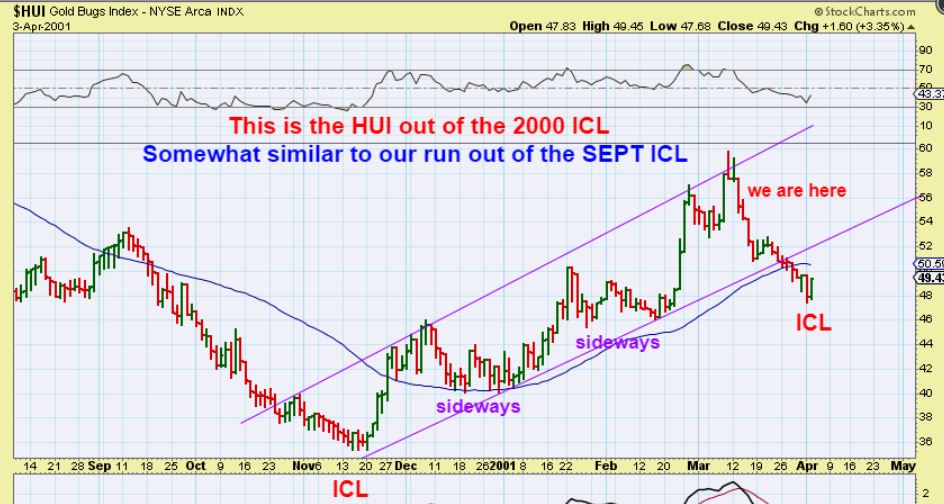
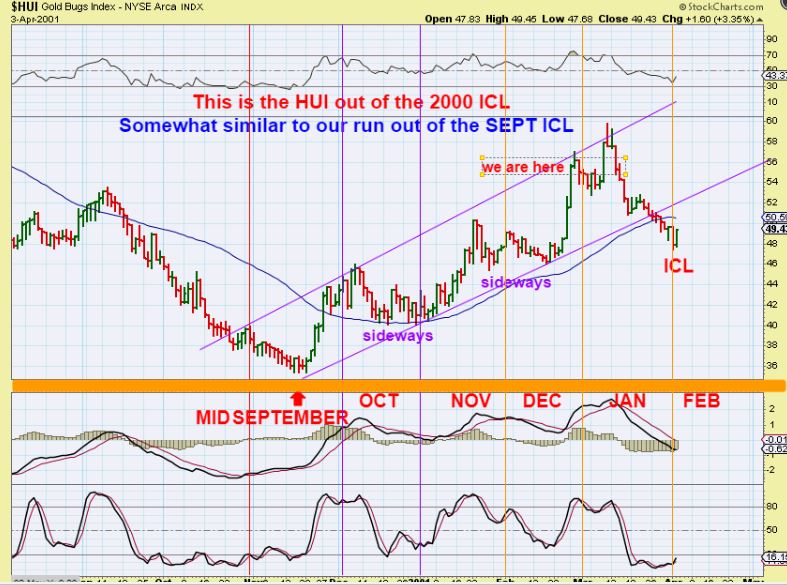
HUI ICL at the 2000 lows– To me, this looks fairly similar to what we have seen in the GDX move out of the Sept ICL.
1. It went sideways and was choppy after an initial pop higher out of the ICL (lows).
2. The 2nd daily cycle did the same, a Pop with a choppy sideways move .
3. Then was a 3rd daily cycle that ran to a new peak. a double top. What came next?
4. A drop to an ICL in that 3rd daily cycles low. See the chart…
,
To be clear: I’m NOT saying these are Twins so they will do the exact same thing. I just want to examine how this type of situation played out in the past, and we can look to see if it happens again, so let’s continue….
.
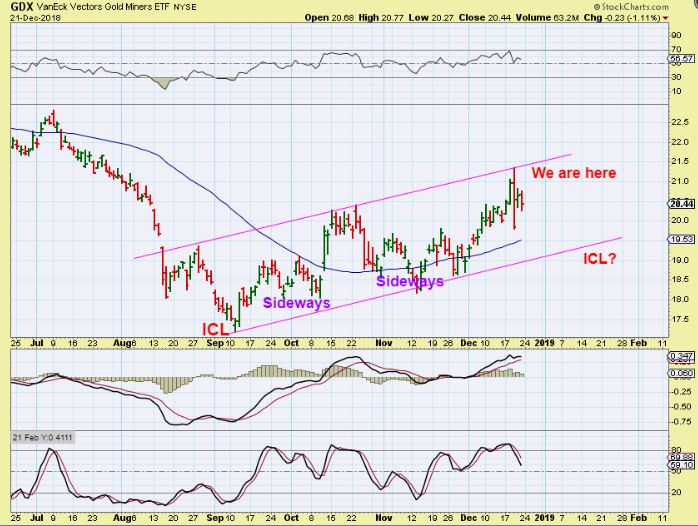
SIMILAR, RIGHT? : Here I have placed our current move in GDX on top of that HUI chart out of the 2000 ICL. Do you see the similarities in our current Move for GDX , and the 2000 HUI Move also below this chart? Compare the 2 charts together. It still dropped to an ICL, yet bullishly it was a much higher ICL.
.
BREAK – IT – DOWN
.
HUI 2000 lows– Now if I change the dates of that HUI chart to match our SEPT ICL, the next ICL would come near the end of January (if these were that similar). That would align with Golds ICL 5+ months after the August ICL. Obviously this is not an exact science, but it is a comparison to what DID happen out of an ICL in 2000 with now.
.
Now let me take a step back on that 2000 ICL
.
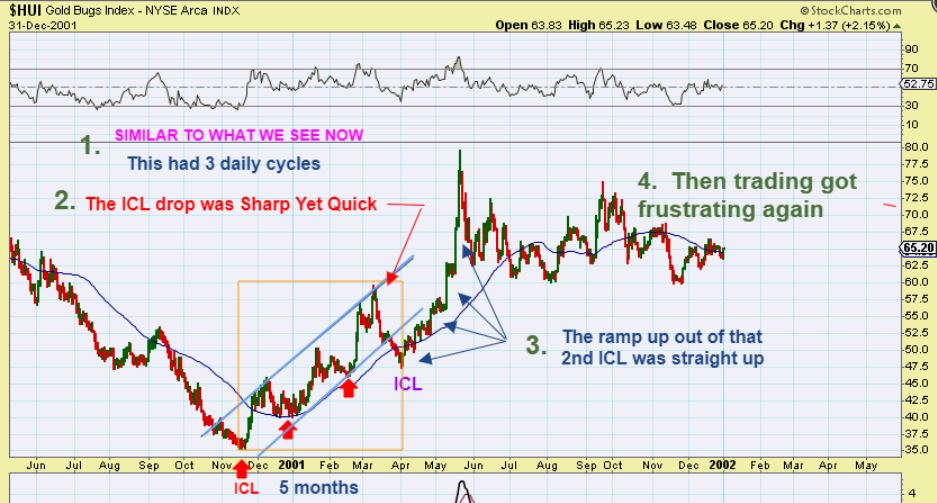
HUI 2000 lows– After that 2nd ICL, these Miners Ramped up very sharply, so that could be next. Unfortunately, they then went sideways again for the next few daily cycles, but at least they held those gains well. Read the chart 1,2,3,4 …
HUI 2000 lows– Stepping even further back, the next ramp up was incredible, very steep. This whole entire run may be the same as or even better than the one we got in 2016. Not as straight up for 6 months, but more sustained & enduring. The ICL’s keep forming much higher than the first ICL too.
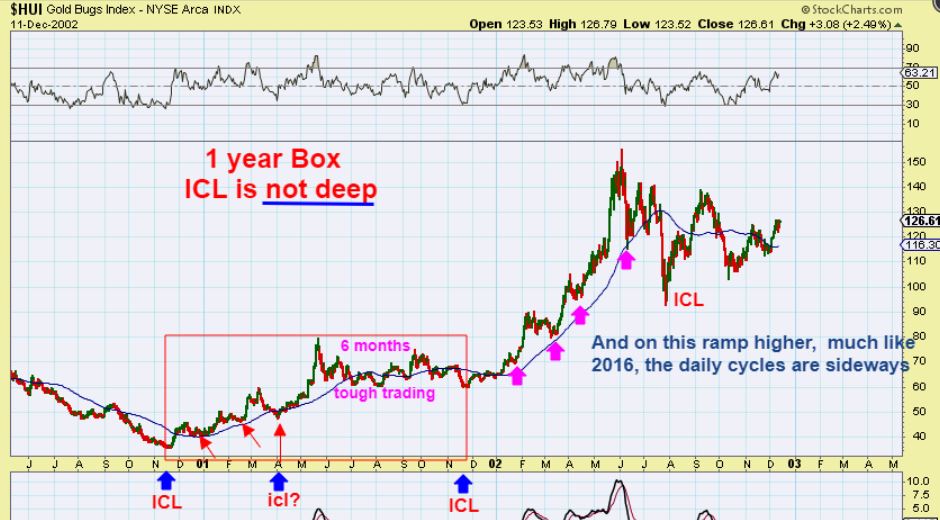
So this is a very Bullish way of looking at the current move out of the lows in Miners and trying to understand how the Bull Run can play out over the next year or 2. Yes, there are Pull backs in Bull runs, and yes it may get choppy, but the overall gains can also be incredible, especially in individual Miners.
.
The same chart – Finally , I just wanted to point out that the Miners can be very choppy and sideways, even in a Bull Run. We just saw the first 2 daily cycles out of our September ICL as very choppy and difficult to enjoy. The 3rd daily cycle ran higher.
This above Big Picture view of an actual ICL that started Golds multi-year Bull run can help us to see where we possibly would be in the Big Picture view of things. As you can see, there are going to be pull backs along the way. We will see DCLs and ICLs along the way, even as the Bull runs higher, and these would be great places to buy or add to positions.
.
~ALEX
.
SIDENOTES:
This is a live 7 a.m. Eastern time shot of Gold. Golds climb went from sideways chop to more of a steeper incline. It is not at a resistance area yet, so it does look like Gold can move higher. I mentioned before that the nice round number of 1300 is now a possible target. On a daily chart, gold is at new Dec Highs and GDX is not, so we’ll see if Miners follow Gold to new Dec highs too.
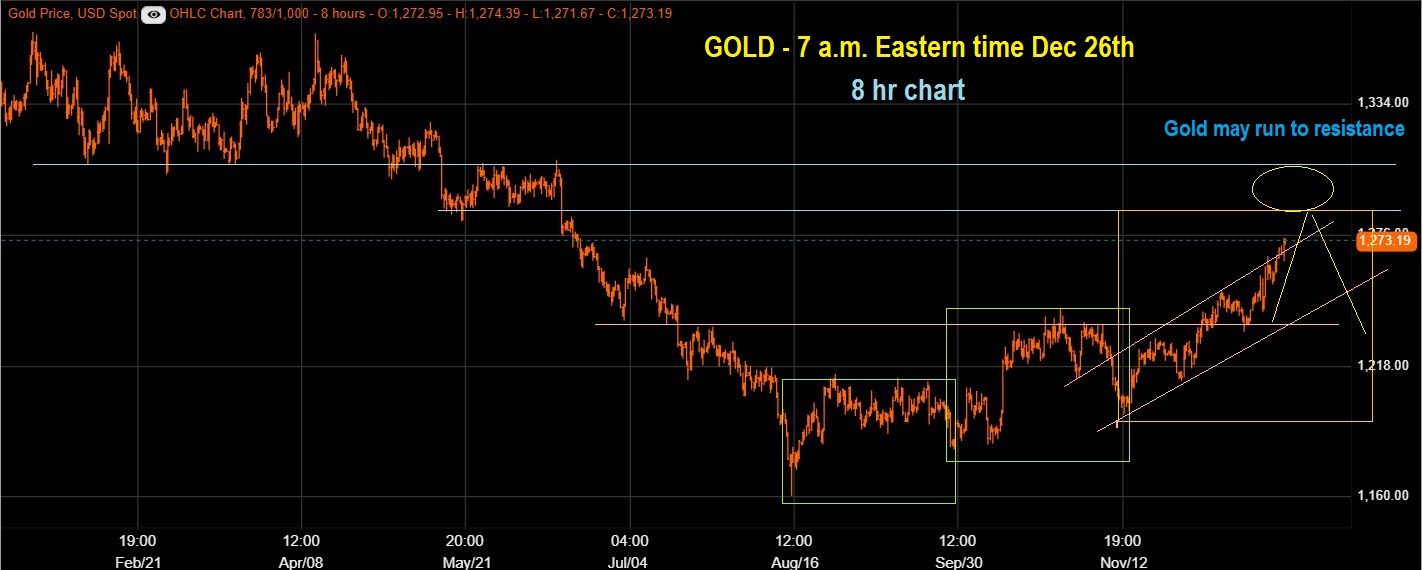
I mentioned in recent reports that Gold could run through this holiday week ( End of December), but I was surprised at how strong the volume was the 1/2 day before Christmas. I would then expect that Gold begins to drop in the 30 day + area of this daily cycle. If this continuation in Gold does happen, that is a very bullish 3rd daily cycle ( Similar to 2000 ICL, which ended with a spike higher). That could push Gold closer to the 1300 area. At the same time, if the Market puts in a low, Gold could begin its drop at that time too.
2000 ICL– Notice the double top spike labelled we are here.
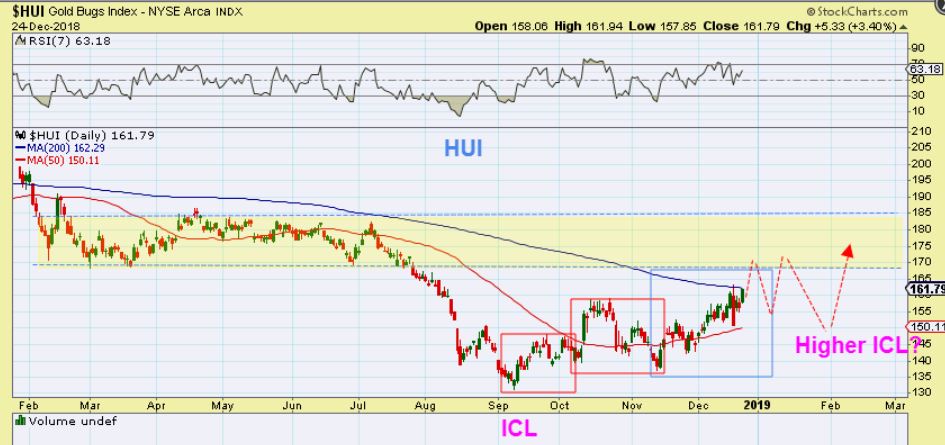
HUI – If the 200 sma gives way for the HUI, it does look like it can move a little higher in its 3rd daily cycle, before it runs into a heavier resistance area other than that 200sma. Between the 200sma and that resistance there is little resistance.
.
We’ll see what GOLD does today, especially if the SPX bounces off of that 200 weekly ma area….
.
SPX – Notice again how the SPX tagged that 200 weekly ma, similar to when it bottomed in 2016…
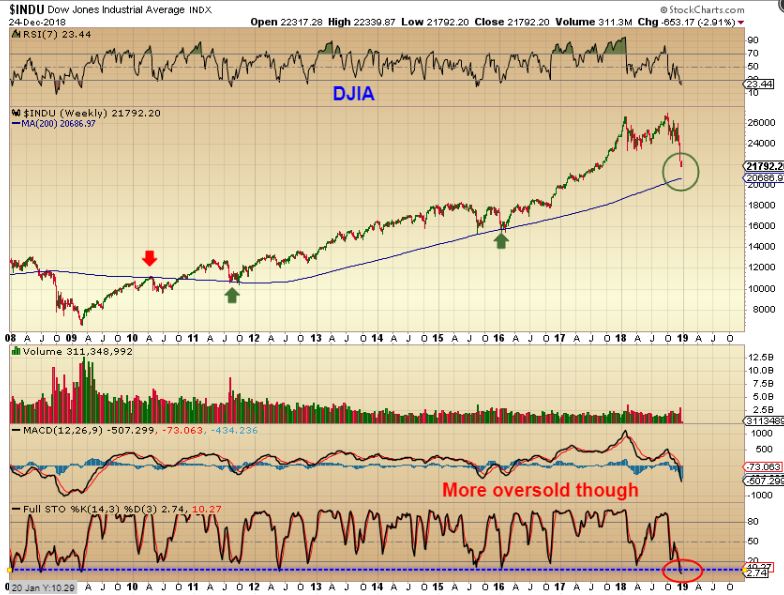
DJIA – The DJIA is not there yet, but maybe it doesn’t have to get there, because …
NASDAQ – In the past the NASDAQ didn’t get down to the 200 ma in 2016 or now (yet). This drop has been very fast and steep, I think it is a flush out that should put in a good bounce soon (ICL).