
December 27th – Things Are Lining Up
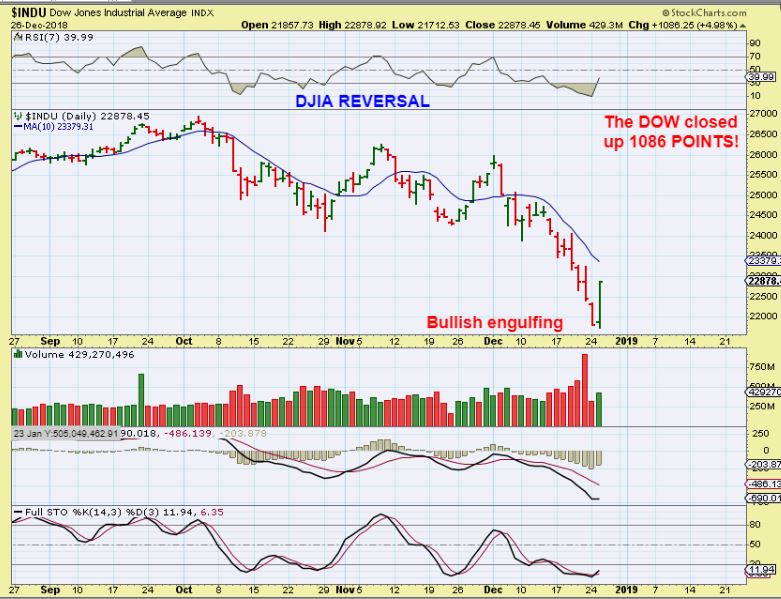
The DJIA was up over 1000 points yesterday! Now that’s a bounce, in fact, I believe that it was the largest up day in the DJIA….Ever. I want to review what I mentioned in my last report. I had about 6 charts of the General Markets, so if you need to go back and review them all, I had a few in the beginning, and a few at the close…
.
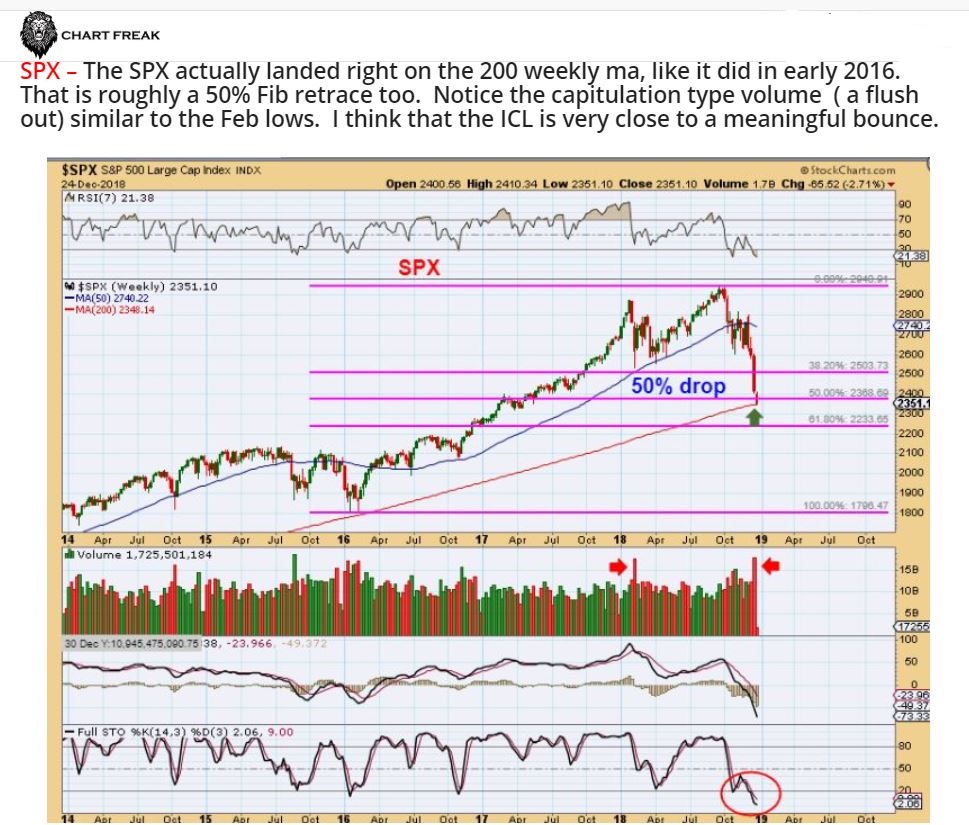
I pointed out the Capitulation type volume, 50 % Fib retrace, the 200 weekly MA, etc . and then stated…
After that SPX chart, I wrote this:
.
” When I look at the Equity Market Sentiment ( FEAR AND PANIC), and I look at the Puts Call ratio, I Look at the cycle count, the Fib #’s, The number of stocks trading below the 50 & 200sma, and a number of other things etc etc etc, it really looks like we are very close to an ICL. I will have to watch how the first 2 daily cycle play out from there, but a snap back rally seems overdue. A 1-2 month rally in the General Markets would also fit in with a pull back for Gold into the next Gold ICL.”
.
Wednesday, we saw the DJIA rally up 1000 Points! – Well, that sounds pretty awesome, but it does feel like the Dow has also been giving up about 600 every few days, so is this what we have been waiting for?
Let’s discuss how things seem to be LINING UP…
As mentioned, the Put /Call ratio, Fear sentiment levels, the capitulation type volume, etc does seem to indicate that we are at the ICL. I often say that we should wait for a confirmed swing low, but in technical analysis, this is a BUY, with a tight stop under Wednesdays low. Let’s take a look…
.
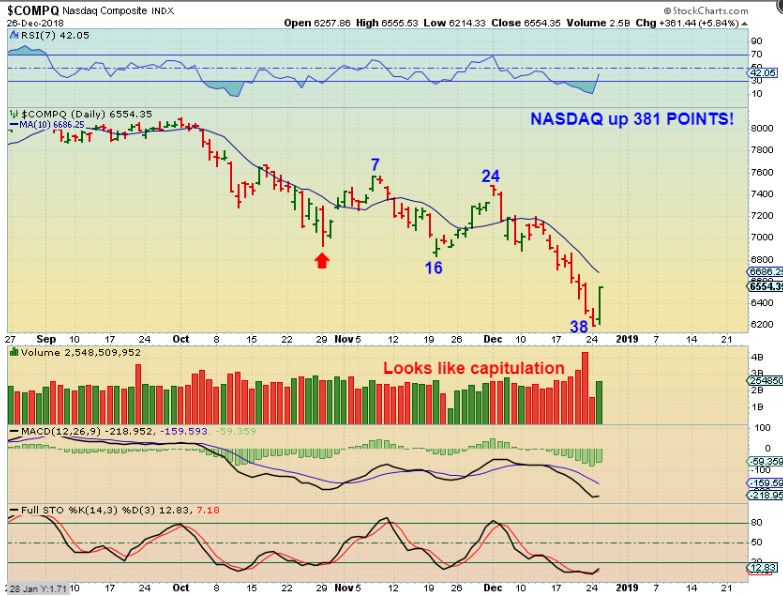
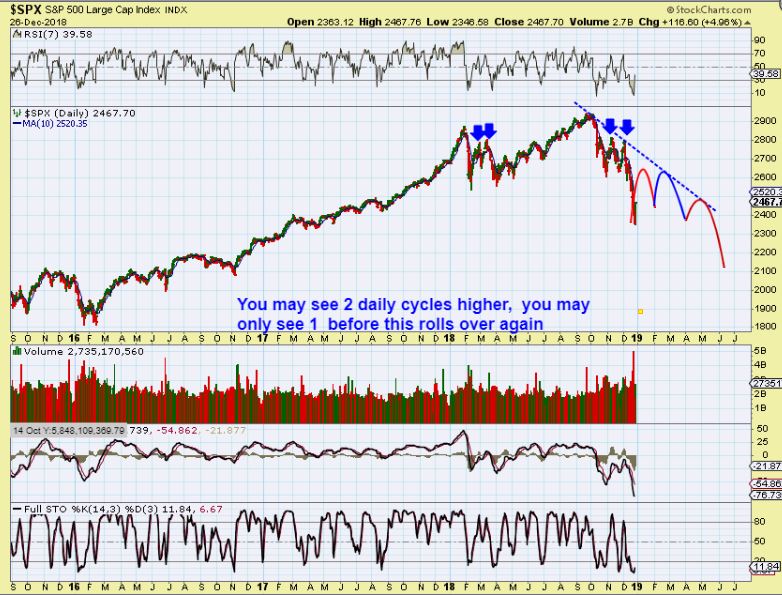
The NASDAQ was up 381 Points – That is a swing low and we did see capitulation type panic wash out selling. On day 38, that is almost surely the ICL.
I posted this chart midday to show a swing low in the General Markets, Oil was up, Energy stocks finally joined in, The USD put in a swing low, and Precious Metals were slowly dropping own. That symbiotic relationship that we often see was kicking in.
THIS IS WHY I SAY THAT THINGS SEEM TO BE LINING UP. THIS IS what we have been watching for basically. Whether you wanted a pull back in Miners to be able to buy, or you wanted a low in the General Markets or the Beaten down Energy / Oil stocks, things now seem to be lining up. Continuing on…
.
SPX– Again the SPX has now reversed at an important fib number. Notice that the weekly stochastics and RSI 7 on the weekly charts look very similar now to the lows in 2016.
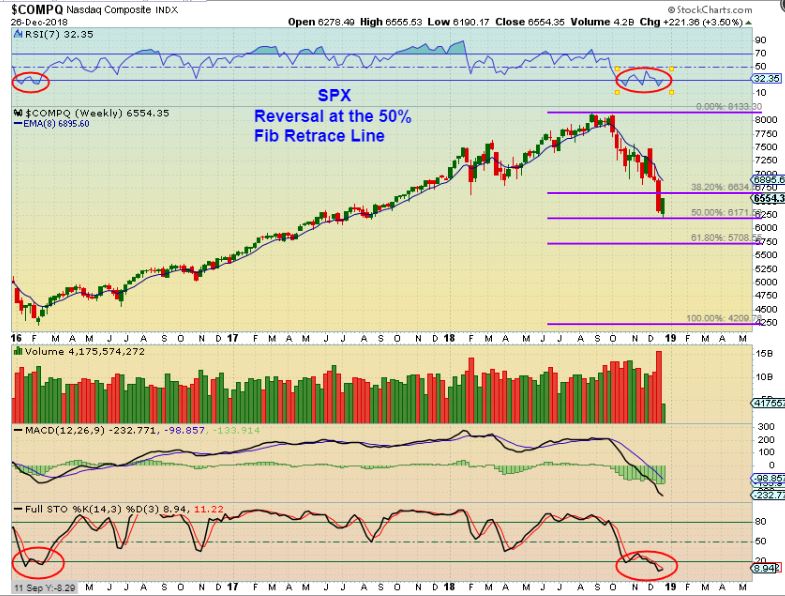
SPX BIG PICTURE: I am NOT saying that we now rally in a bull market for a few more years. This rally can be a multi-week bounce that then continues down.
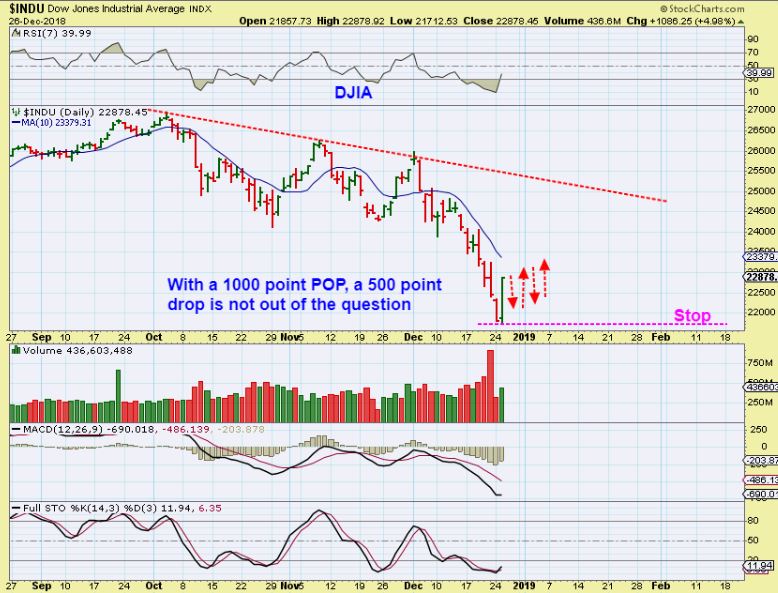
DJIA – NOTE: You should also know that a 1000 point POP can be followed by a large Drop. More Chop. With big moves , you can get more chop.
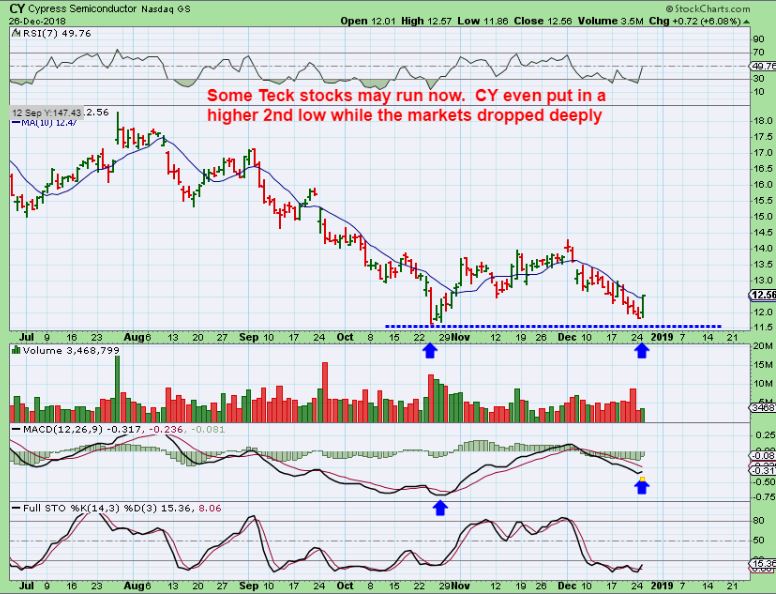
Summary: I have been thinking that the next lows should be an ICL, and that could lead to a sharp snap back rally in the first daily cycle. I mentioned that I would trade it, but also want to see how the first 1-2 daily cycles play out. You may want to look up your BEATEN DOWN Favorite stocks, and see if they reversed and look ready to move higher. Some will grab TQQQ or UPRO for a bounce, others may trade stocks like CY, MU, SQ, FB, TWTR, AMZN, or others that you think may put in a good bounce. For example:
.
CY– NOT SELLING WITH THE MARKETS ANYMORE. I like to see Double bottoms when the markets were selling straight down, because that could be a sign of all the sellers being out or buyers stepping in early. The stock market just sold off hard in October- December. Cy did not.
.
WHAT ABOUT OIL?
.
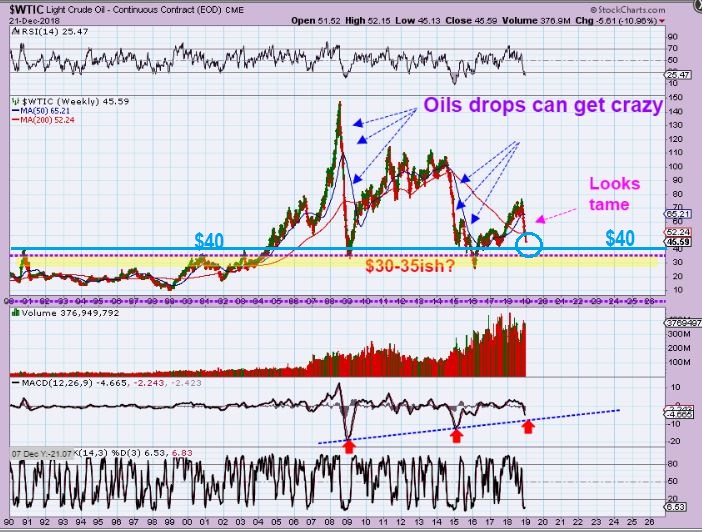
Last week OIL was $51 down to $45.59 on this chart- I was looking at how sharply and quickly OIL can drop. It dropped from $80 to $45 here, but past sell offs were massive. Support looked to be at $35-$40 ish. I said that it would not surprise me to see OIL drop to those support levels. Well…
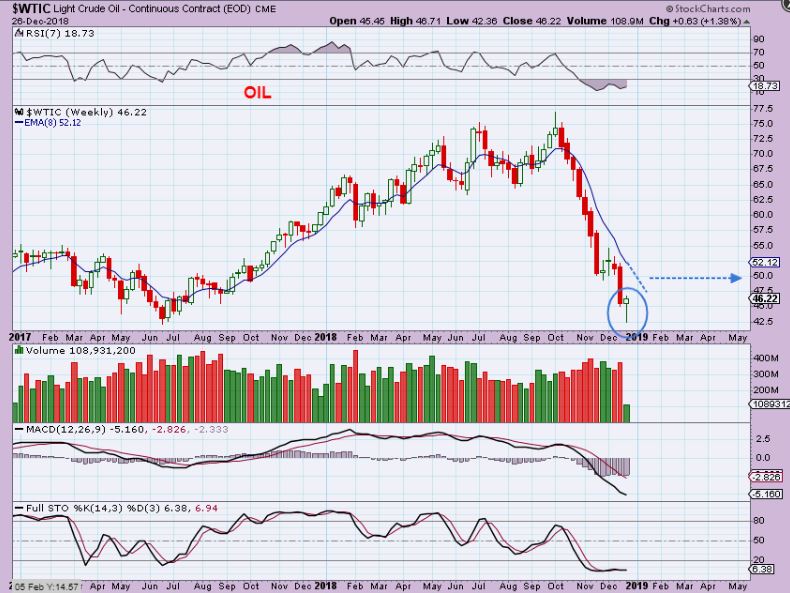
WTIC – Oil dropped to the $42 area Wednesday and put in a solid reversal candle. As it started to reverse, I always look to see if the Oil / Energy stocks are also turning up, and lately they have not followed Oil bounces recently. THIS TIME THEY DID, Oil stocks were following OIL reversal & The General Markets reversal higher, so I want to look closer.
Is this Oil drop to the $42 area perhaps enough? Perhaps it is, it was in June 2017, and …
.
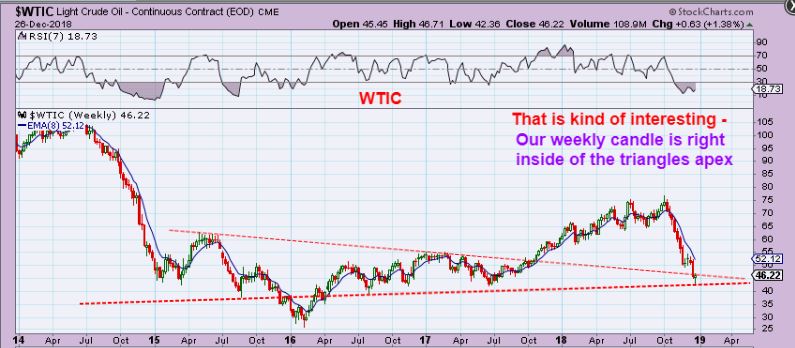
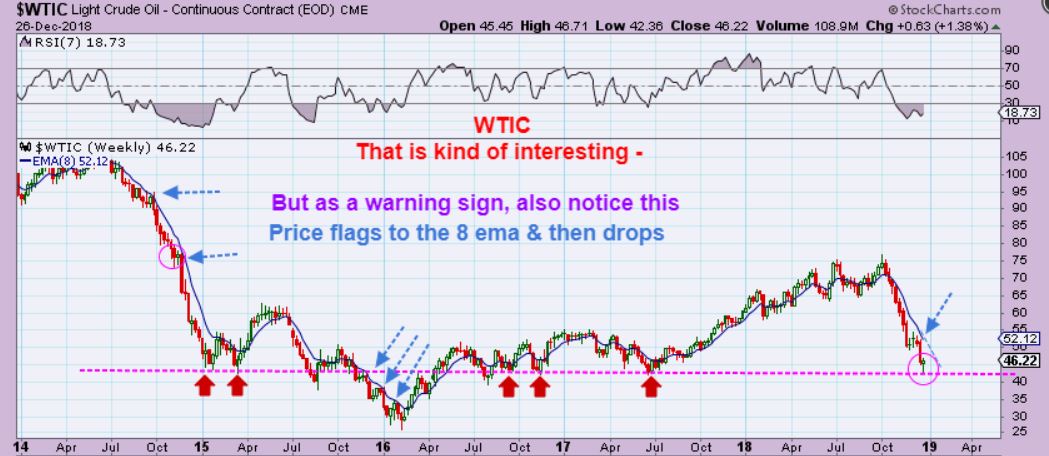
WTIC – I thought that this looked interesting. Oil landed inside of the Apex of a possible triangle support, so let’s zoom in.
.
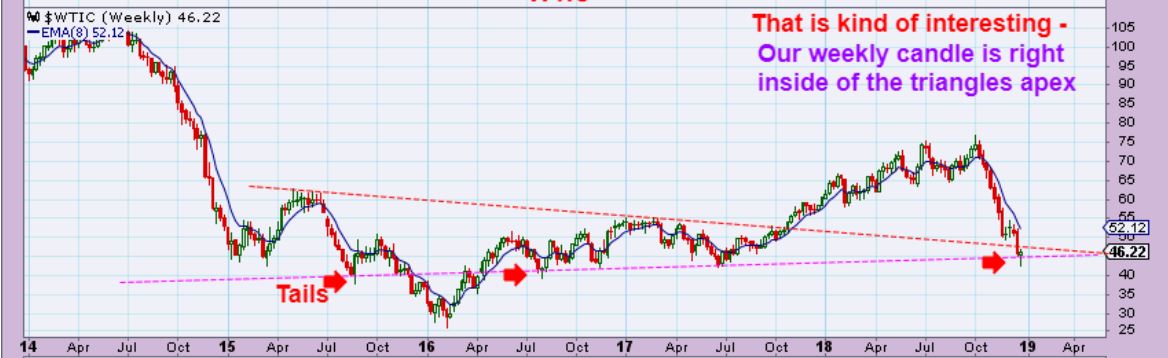
WTIC – Oil dropped below the lower trend line and put in a candle wick (tails) , similar to past lows. So yes, This COULD be the next low for Oil, but look at the past lows. I’m just not sure if we’ll get a strong rally or not, since past lows were just slower multi week bounces.
.
I mentioned in the comments / chat area that I had purchased Oil / Energy Stocks. That is short term for now. I do not like to form a perma-bull bias. I feel that it is important to look at all legitimate possibilities, if there are other possibilities that stand out, so I will point this less bullish one too.
.
WTIC – In the past, I see that Oils move out of the lows has ‘Paused’ for maybe 2 weeks & tagged the 8 ema weekly. Look at the drop at the end of 2016 as a solid example ( 3 blue arrows). It tagged the 8 weekly ema & DROPPED repeatedly, so I want us to be aware of that. We also just did it last November, when I got stopped out, so I will watch that area going forward. THIS MAGENTA LINE DOES LOOK LIKE A POSSIBLE SUPPORT AREA & REVERSAL HOWEVER.
.
XLE – We have a weekly reversal on the XLE
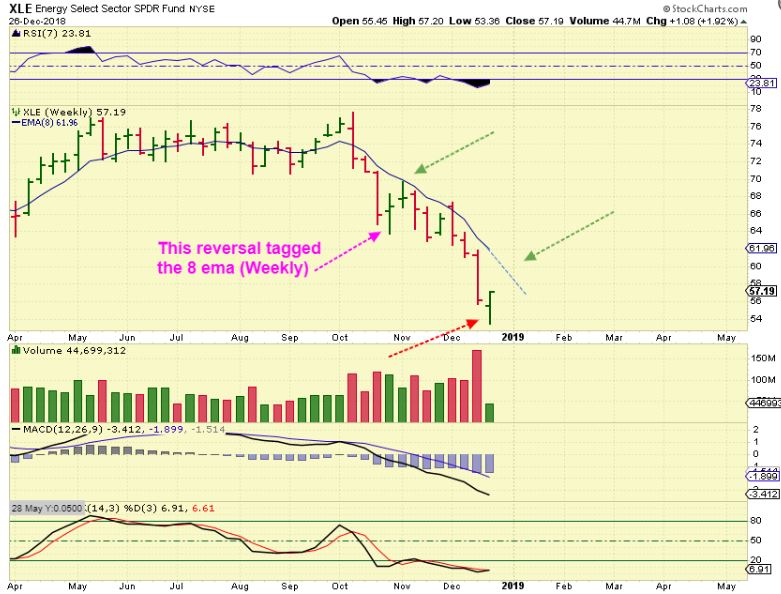
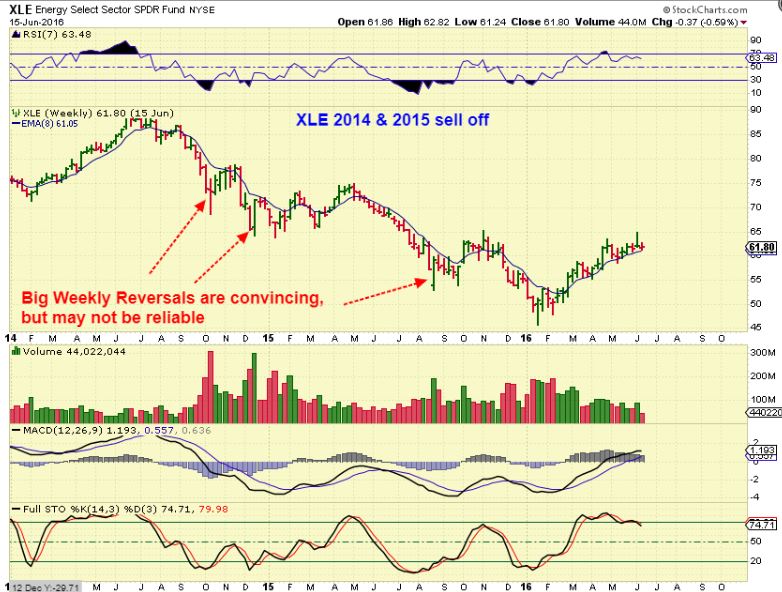
XLE – NOTICE: Past reversals did not always rally straight up. Time will tell if we have a solid longer term low? Or just a multi-week bounce. I’m in the GUSH trade and often sell 1/2 on the way up. Watch the 10ma weekly ( or 8 ema).
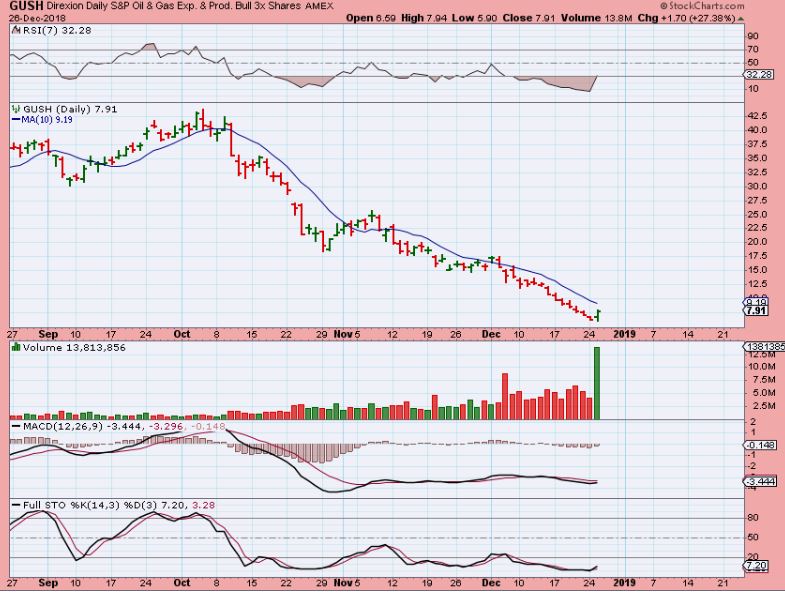
GUSH – I grabbed this chart 2 hours into trading after I bought GUSH near $6.50. Look at the BIG VOLUME REVERSAL after a long steady sell off. Those are often capitulation type lows, the volume was 2 hrs of trading. .
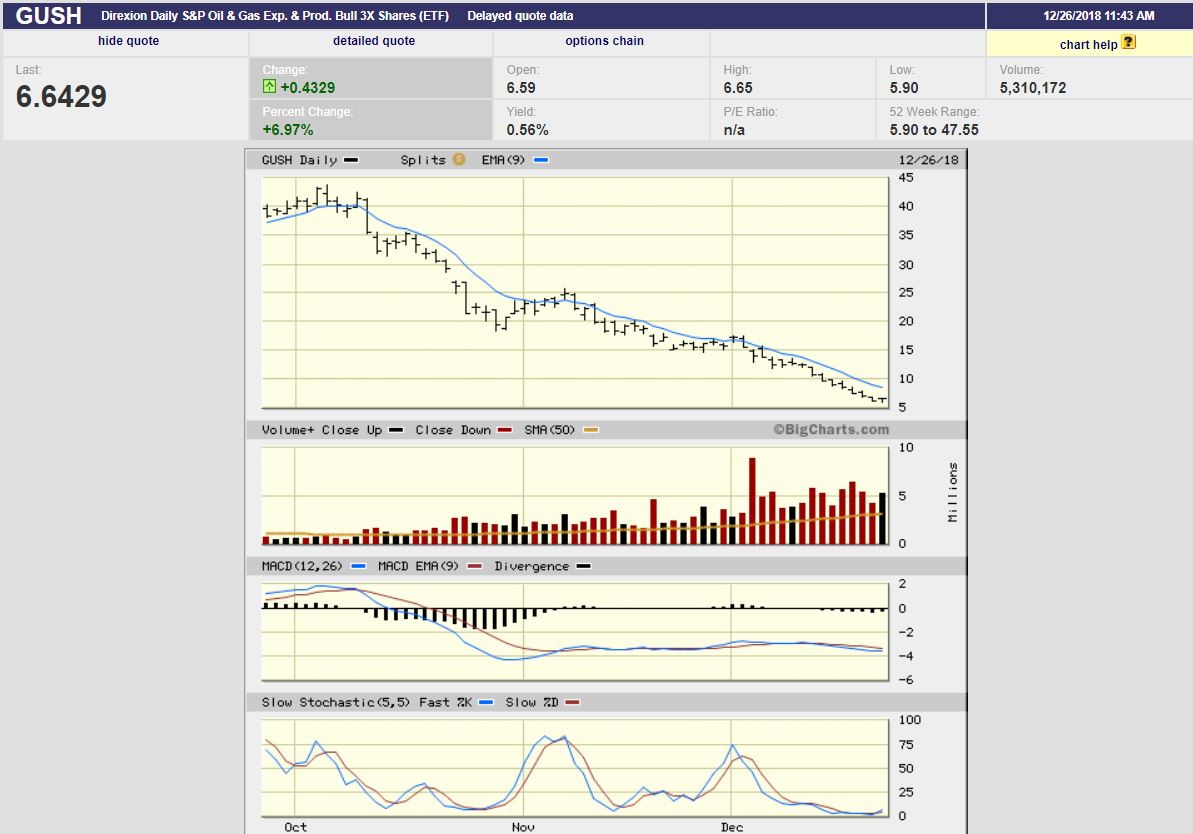
GUSH -Now look at the volume. Gush almost closed at $8 and the volume was Massive. It is already almost at the 10 weekly ma, I would love a break out and run.
UWT – 3 hrs into trading, Oils 3x etf UWT looked similar to XLE, and it closed higher at $9.61 ( also see OILU below ).
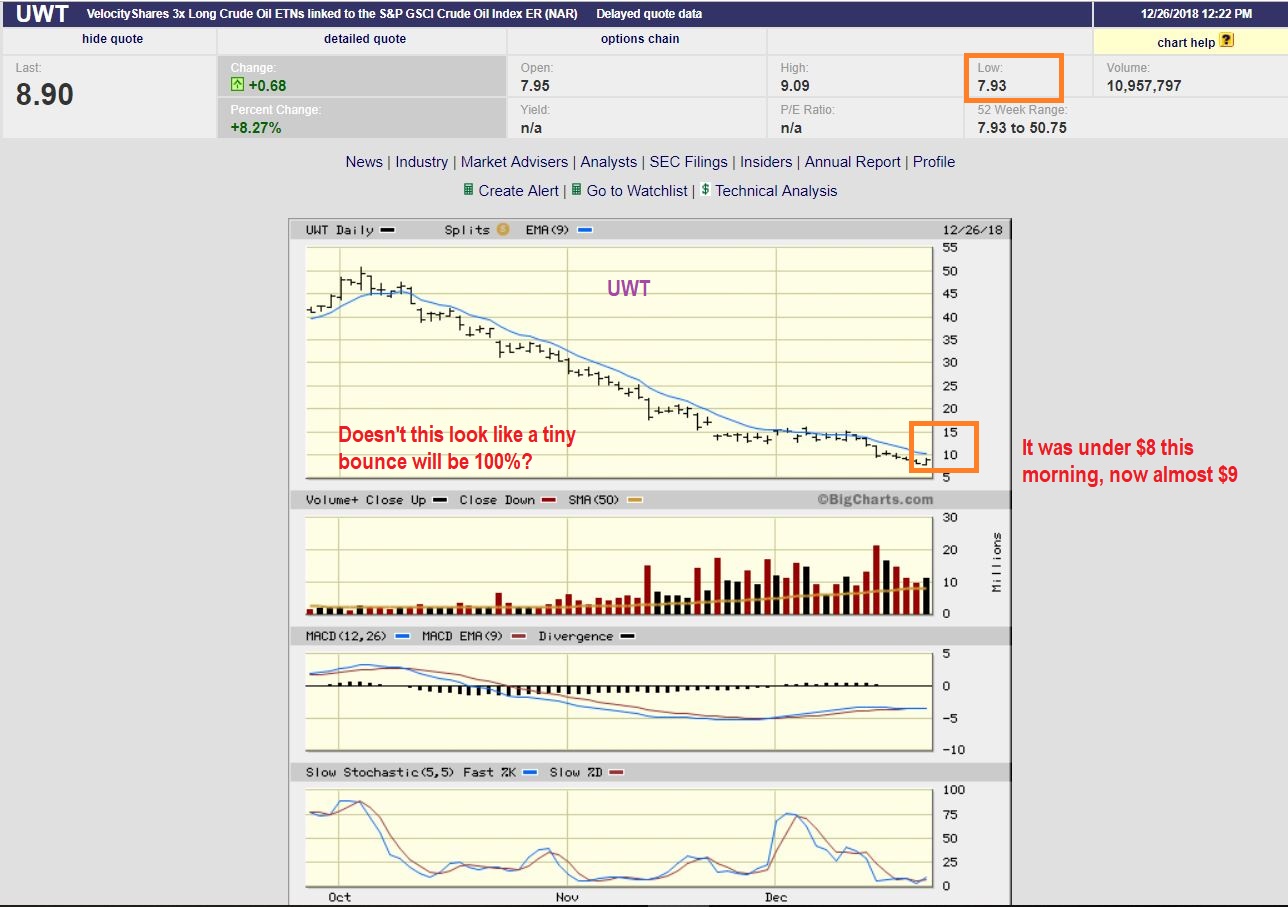
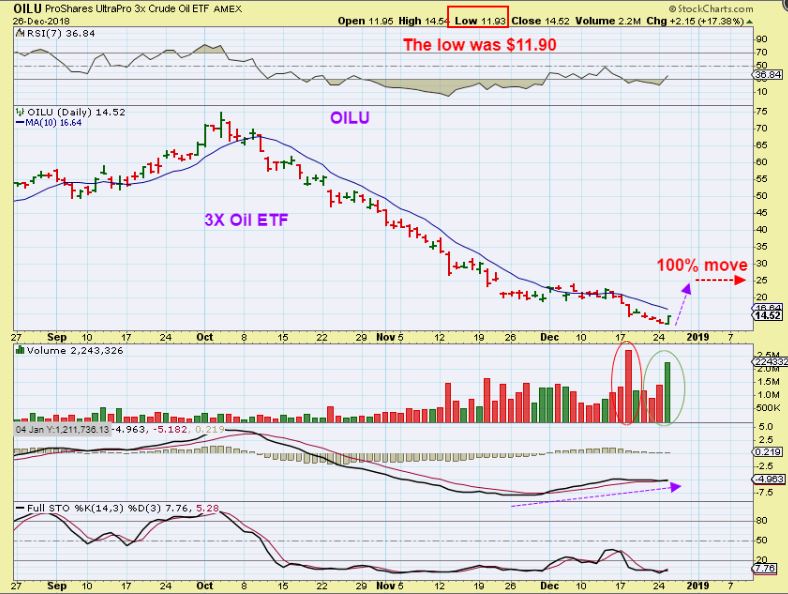
OILU – A small bounce in Oil could make for big gains. I’m not saying that this WILL move up 100%, I am simply showing how quickly it could make gains IF OIL follows through higher.
.
LESSON:
.
OILU 3x etf : Same chart. I still have people tell me that they are buying leverage ( OILU, JNUG, NUGT, JDST, TQQQ, etc) and are ‘fine with just holding it through a sell off’. NO, NO, NO please. What if you bought this in October? This dropped from $75 to $11!! Even $40 to $11 is awful. Wait, Even $20 to $11 happened in about the last 5 days! LET YOUR STOPS WORK, OR YOU CAN VERY QUICKLY GET DEVASTATED IN LEVERAGE.
.
Do you recall that I Bought A GUSH reversal in October near $19? I sold later, but what if I just wanted to ride this dip out? What if I said, ” I expect lows in Oil soon enough, so I’ll just hang on. ” ? Well, Gush dropped from that $19 to $6 in a month. PLEASE DO NOT PLAY 3x ETFs if you ride your losses down. Stops MUST be used on leverage.
.
So, yesterday I bought the reversal in OIL / ENERGY Stocks as well as GUSH. I will use a stop, trail a stop, and possibly sell if this doesn’t make good progress over the next few days & weeks. Several Stocks were so oversold, that they were up 5% by the time I entered, and they closed up 20+%- so we may see large amounts of buying and short cover. This was a post in the comments section midday, discussing potentials.
.
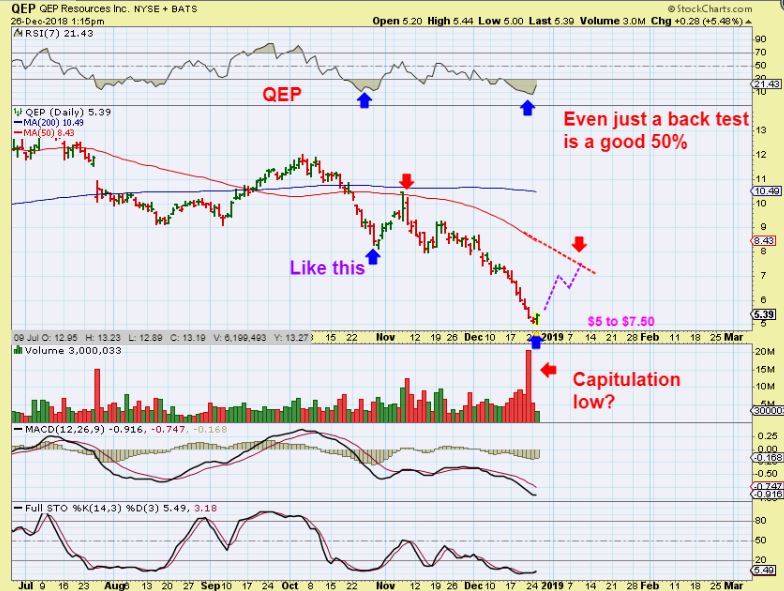
QEP – I was trying to point out that even just a good short covering bounce should be worth it.
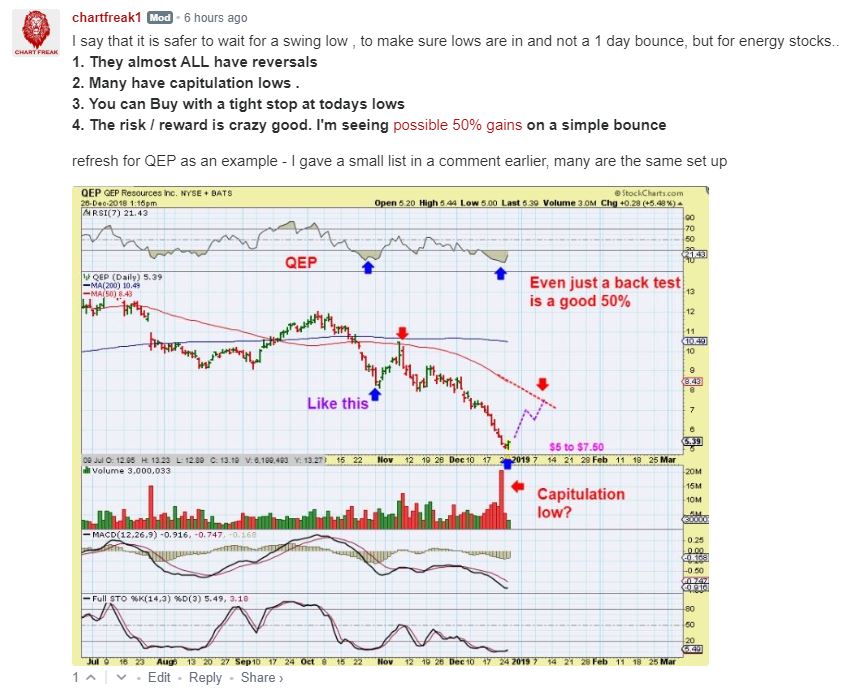
So again, this was QEP up 5% Midday- I bought it, and this one only closed up 10%. A rally or ‘bounce’ in these could lead to larger gains. Even the November bounce was $8 to $10.50 (50sma tag).
DNR – When I mentioned these Energy Stocks in the comments, they were up 5%, DNR closed up 24%. So even a small short covering bounce to the 50sma is a 100% gain. They do need stops though.
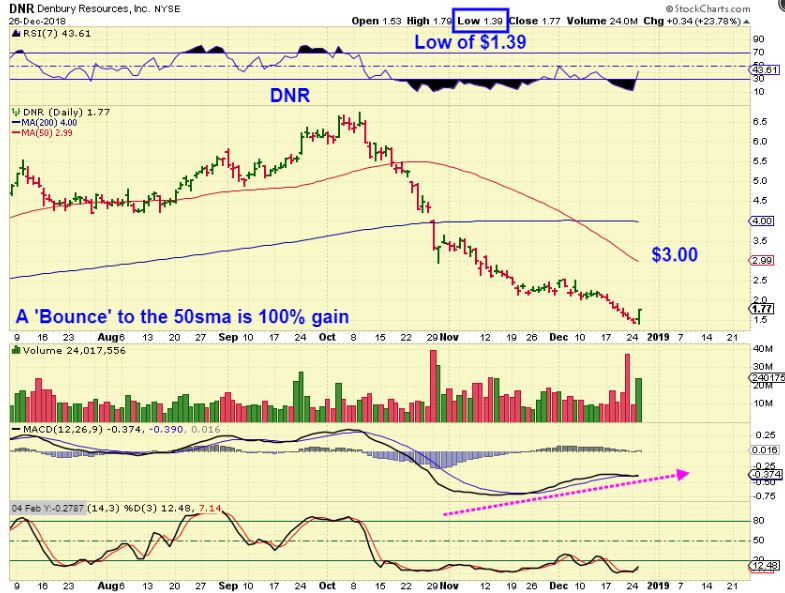
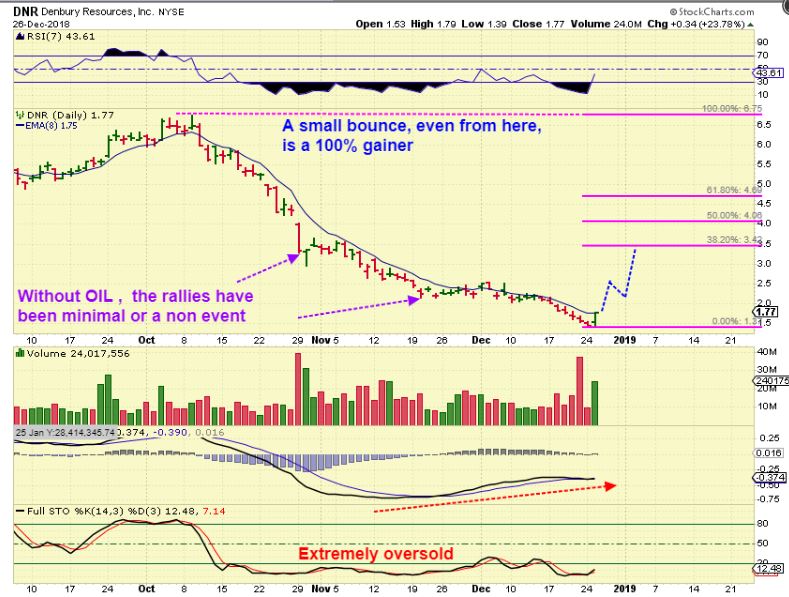
DNR – I also see the 38.2% Fib bounce as 100% from the current price, but if OIL doesn’t continue to push higher, it is unknown or unlikely that these will run as nicely as that.
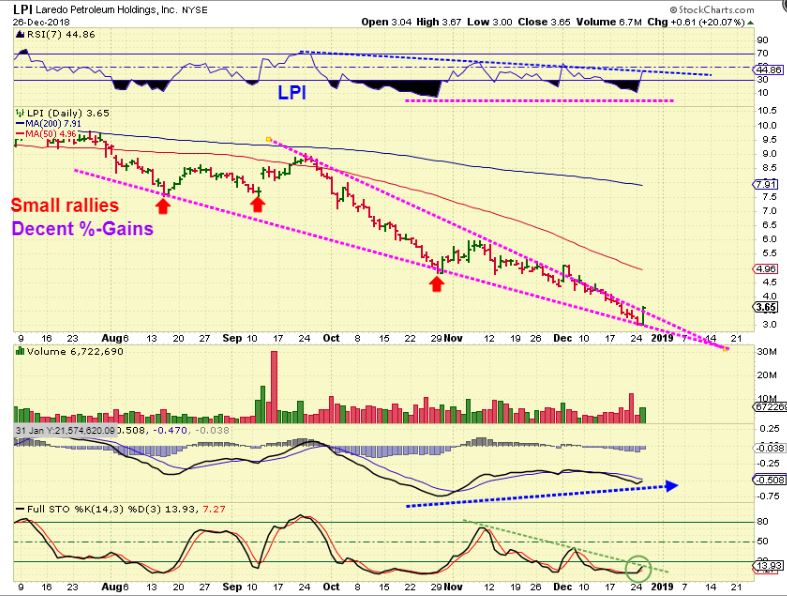
LPI – This was up 4% when I made my comment too. It closed up 20%. You can see that if we get the buyers, this could bounce quickly for some good gains.
.
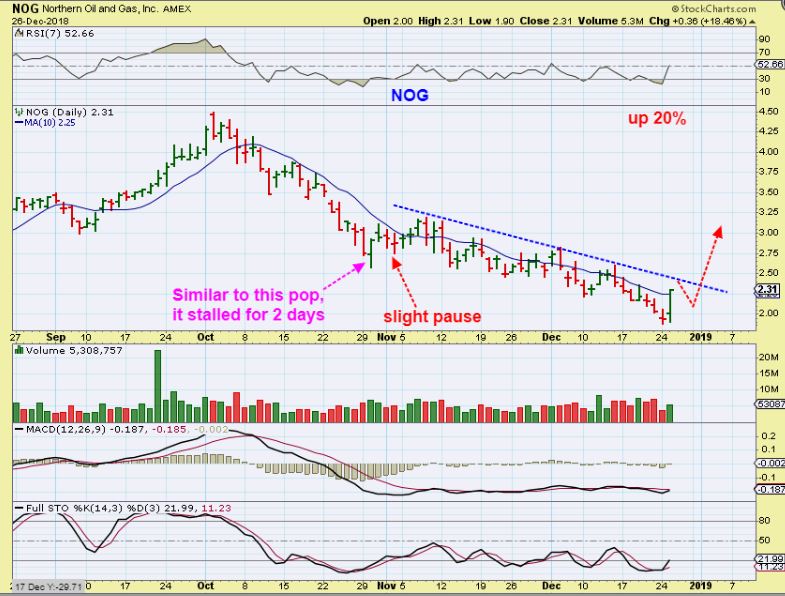
I will look for pull backs and set ups in this sector. Often they POP, dip the next day, and then continue higher. You may see these dip on Thursday. For now a good list for you to look up charts of could be WLL, PDS, GTE, CHK, SWN, OAS, LPI, CPE, CRK, HK, and so on. I Bought OAS, SWN, QEP, DNR, GUSH. At this point, I do not know how long I will hold them, but I did buy expecting to get a bounce that lasts more than just a day or two.
.
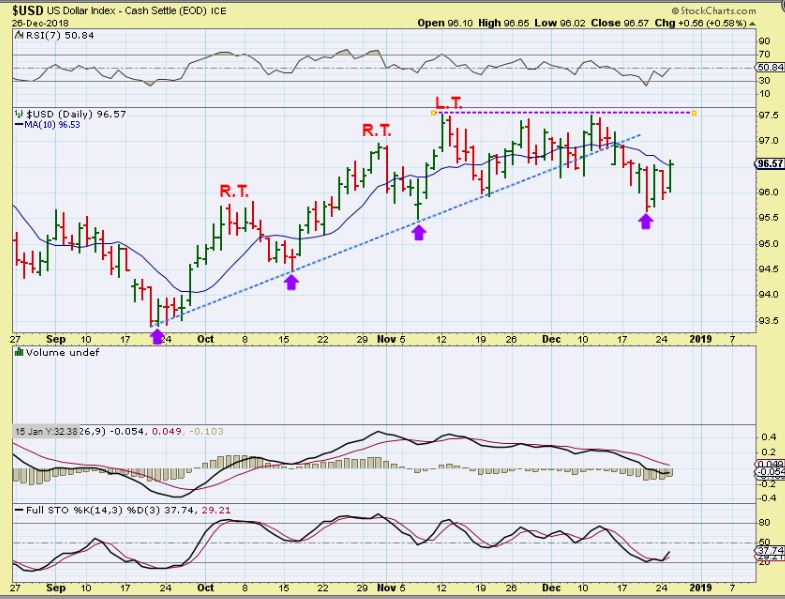
USD – The USD looks to have put in a swing low too, so if the USD is going to move higher, often the Precious Metals are affected to the downside.
.
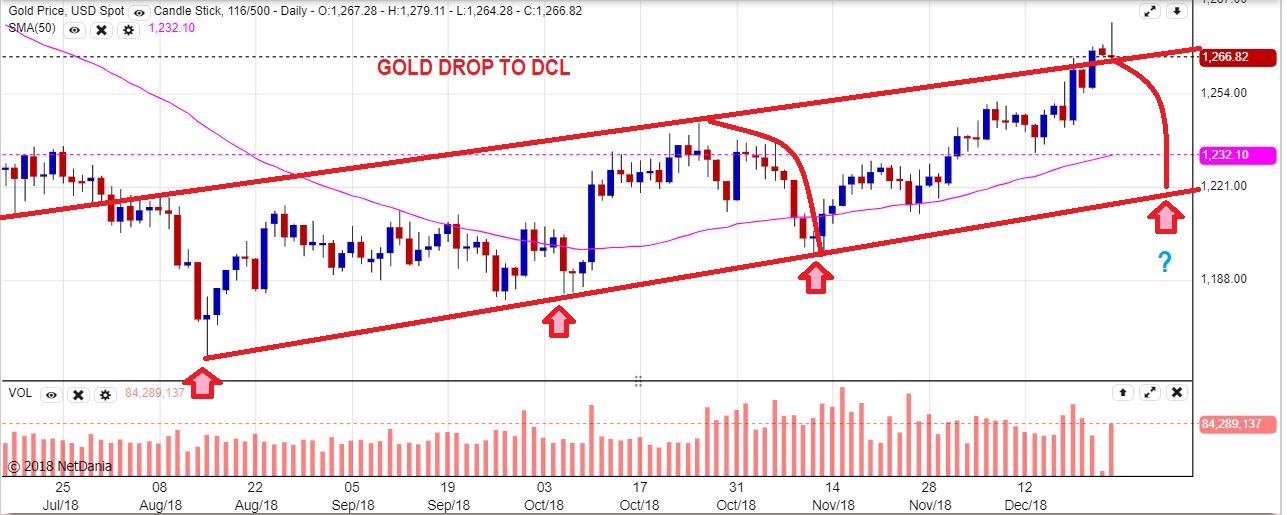
GOLD – In my Monday chart, I pointed to the $1280-$1300 point as a resistance area, and then I’d expect a drop into a dcl.
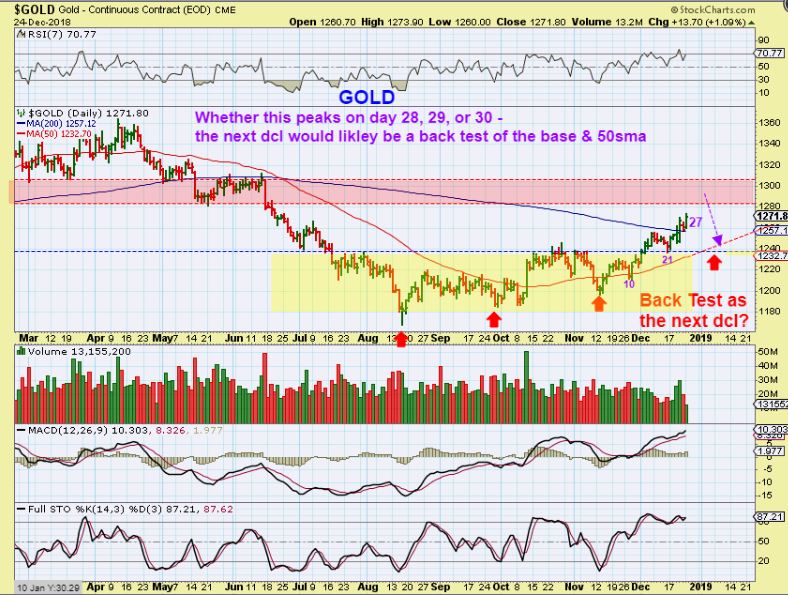
GOLD DEC 26 – Gold ran strongly in pre-market, but sold off as the day went on after tagging resistance. A day 28 peak so far is quite strong and is pretty bullish. I expect a drop, but Gold can tag that $1280 area again too.
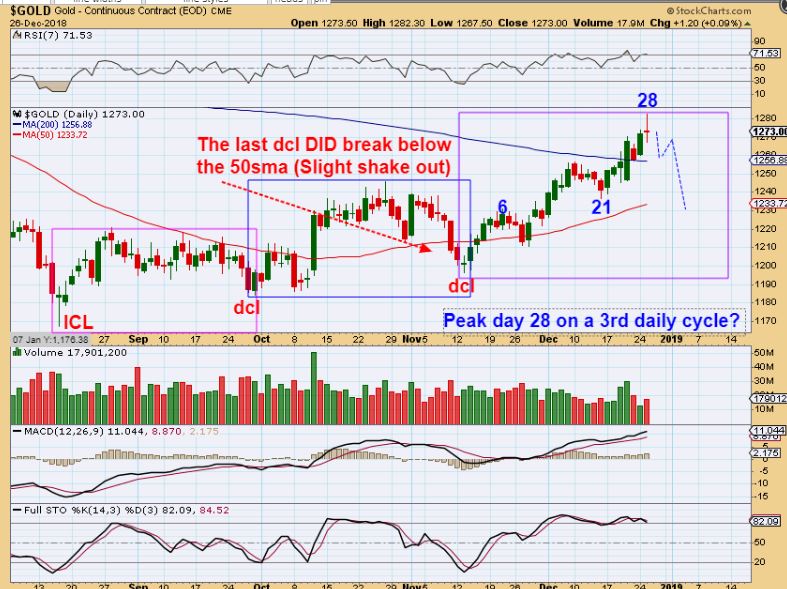
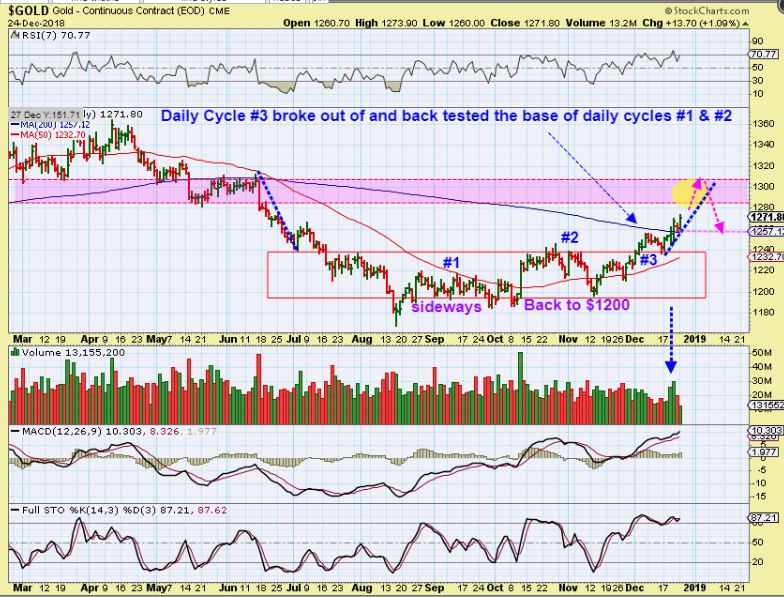
GOLD – Notice what has really happened.
1. Daily cycle #1 & #2 were choppy sideways action (A base formed). 2. Daily cycle 2 had a dcl at the same level s the first dcl.
3. Daily cycle $3 then broke out and back tested that base. That is often BULLISH – a break from a base is one of my favorite ‘long’ trades, but 3rd daily cycles are often weaker, so I only traded a few Miners at that time. Now Gold could be ready to make a nice move higher after the next dip. The 3rd daily cycle low COULD BECOME an ICL back test.
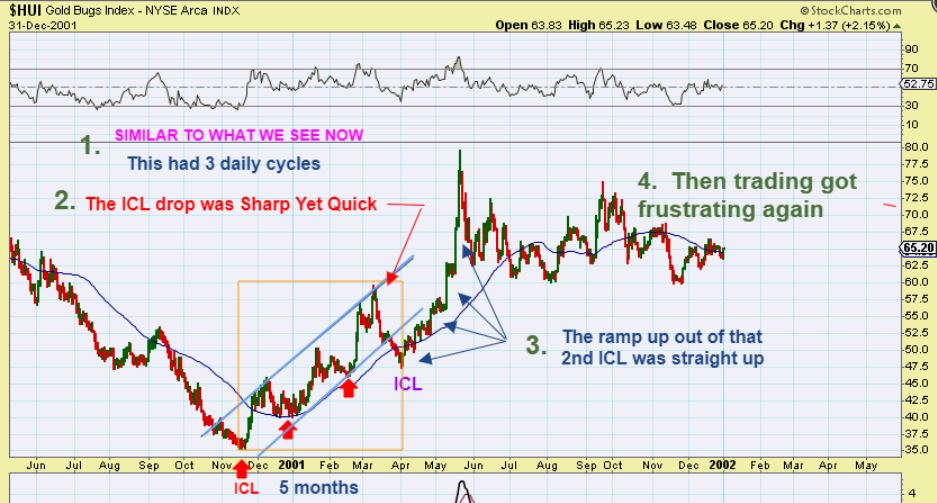
2 charts below : As pointed out in my last report – This was the HUI, and the 3rd daily cycle was the ICL.
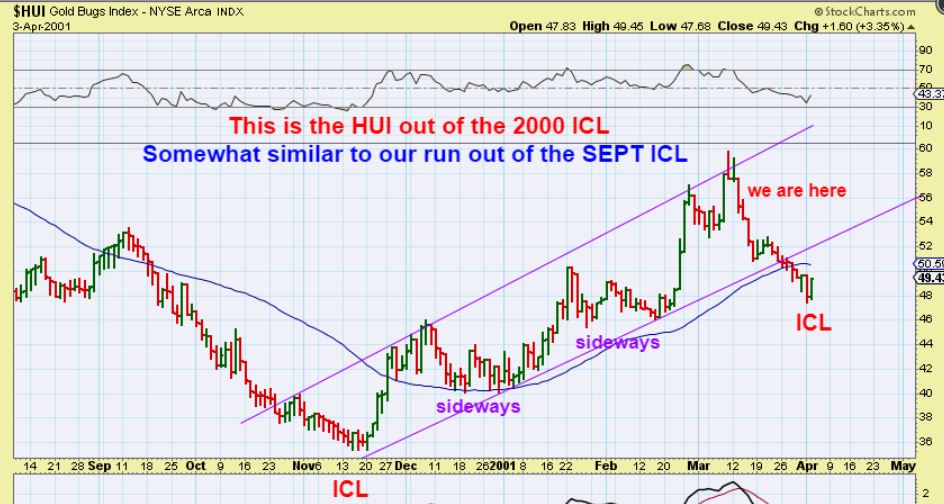
And then a blast off took hold. This was maybe more of a V-Bottom than a base, but similar in several ways.
GOLD – I was just looking at the drop from the 2nd daily cycle and adding it to the end of this one, just a visual idea of what we could see, not an exact expectation. If we get an ICL, it actually should break the uptrend line.
.
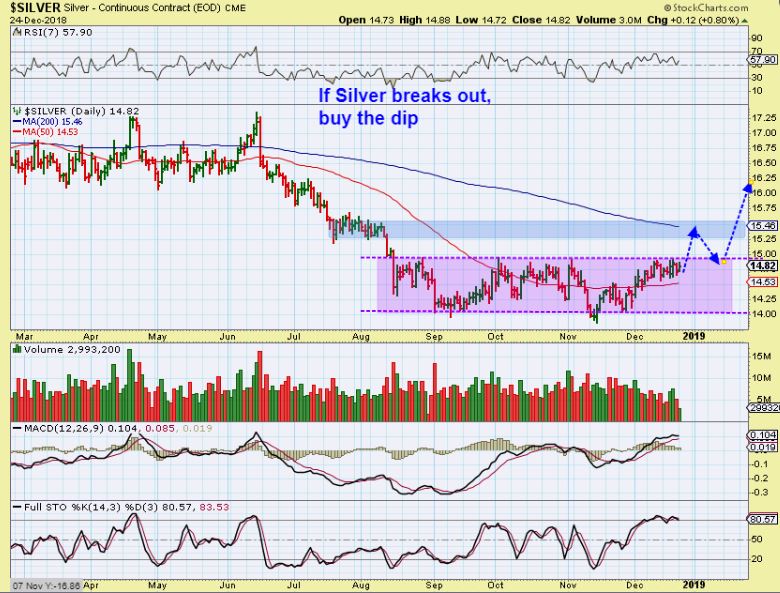
SILVER – Silver has a nice base so far too. This was my Monday chart. I drew a possible break out and drop as a tag of the 50sma , or…
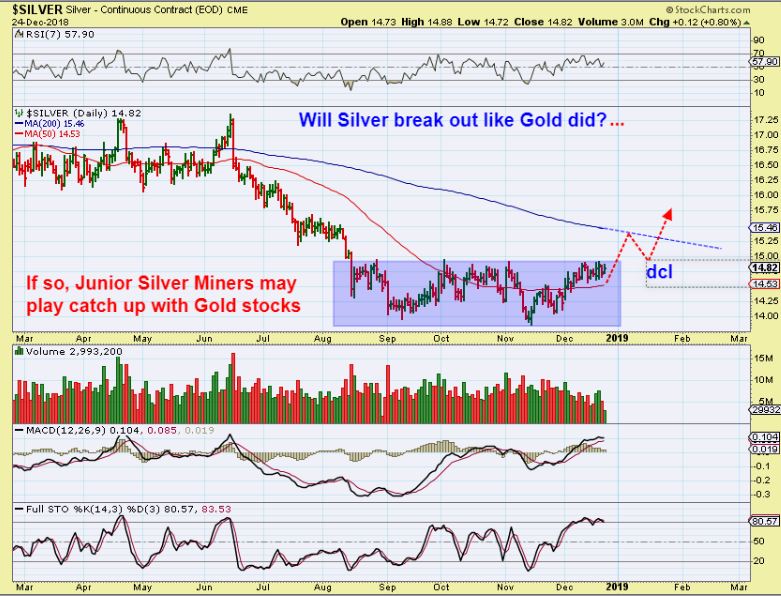
SILVER – It also has a small resistance area at the 50sma, shown here.
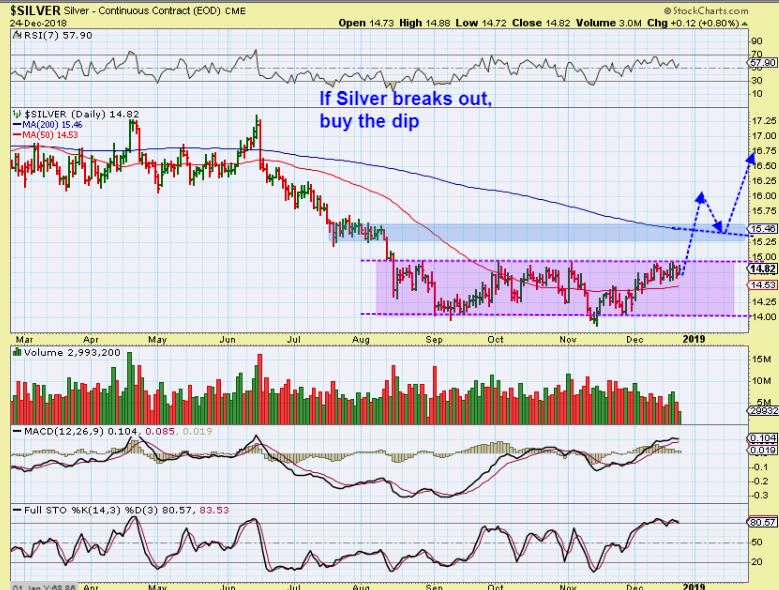
SILVER – A stronger break out? At times we see Silver & Miners lead Gold. I noticed a new low in November for Silver, so it is possible that Silver lows are in, and it may break out, even as Gold pulls back. Silver stocks may then resist the dip into a dcl by Gold too. ( This is just a guess based on the set up at this point. It could drop to the lows of the base too, but I am always thinking ahead and prepare for anything / surprises that we might see).
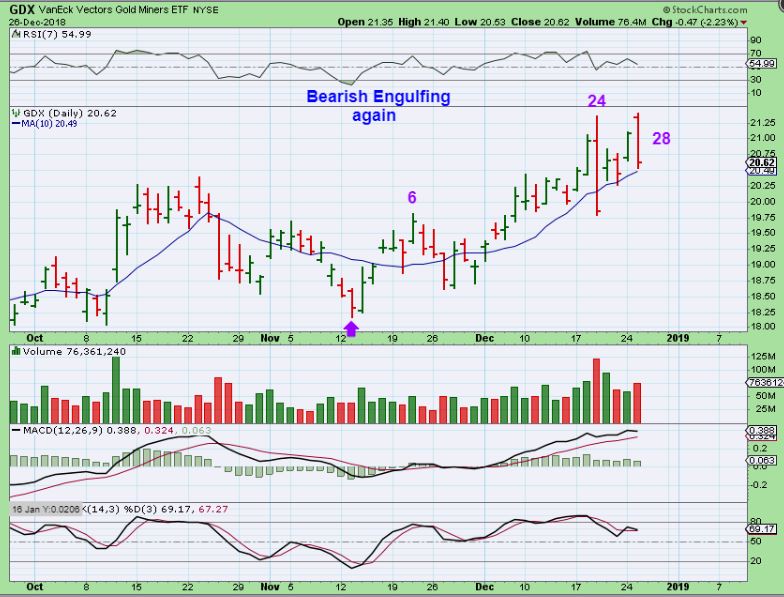
GDX – We also have a day 28 peak for GDX. That reversal shows up as a bearish engulfing, we are expecting a drop into a dcl. This is still very choppy so far, but I do own some DUST. I don’t recommend that for everyone, shorting Miners in a choppy bullish sector is tough, but we are nearing day 30, so I went with it.
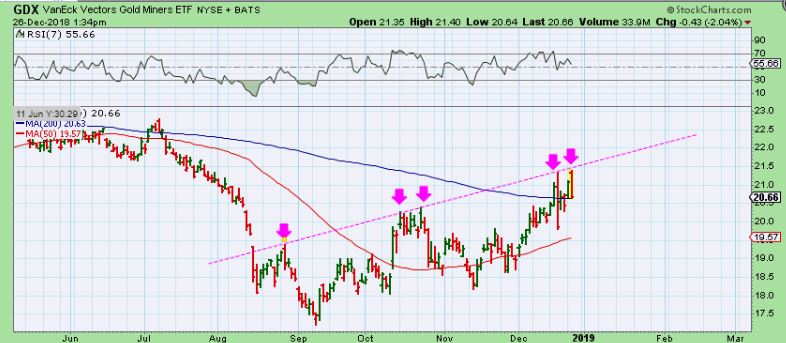
GDX – In harmony with Wednesday Mornings Gold report, comparing the Bull run out of the 2000 lows with the current set up, I will just post our current GDX chart as of yesterday with the 2000 HUI together again. We could be ready for the drop to the dcl ( ICL?). Compare the 2 charts below for similarities.
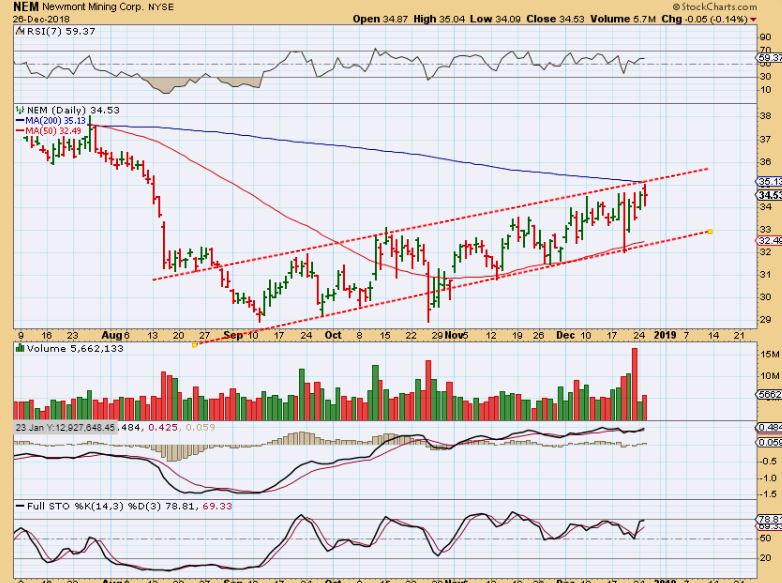
NEM – Nem looks ready to pause too, as it reversed off of the 200 sma & upper trend line. A break out would be really bullish, but a pull back would be expected. Buy the dip 🙂
.
Summary: For Thursday, Dec 27th, we have some pretty real looking reversals in place. These reversals come after prolonged moves for each sector too. A 1 day reversal can be followed by a 1 or 2 day small dip too. Think 1-2-3-4-5.
– The General Markets dropped into what should be an ICL. It looks REAL, but could still be a bit choppy. They will have 1-2 daily cycles to show renewed bullishness, or we may see the ‘sell’ or ‘short the bounce’ attitude reappear.
– Oil & Energy stocks have also reversed higher with the Markets, looking for follow through over the next few days
– And we saw the possible support area in $42 Oil. We’ll see what kind of follow through takes place there over the next week or so.
– Gold & the Miners Popped and dropped as the USD reversed higher yesterday. They are due for a drop into a day 30+ Dcl, but have resisted the selling so late in this daily cycle.
.
With those sharp reversals on the table, often a’ technical trader’ will buy a strong reversal with a tight stop under the lows, hoping for follow through buying or even short covering. Even though with cycle analysis, it is advised that one waits for the move above the 10sma to ‘confirm’ that a swing low has enough buyers behind it, some conditions cause me to enter on the reversal. In a Steep prolonged sell off, the 10sma is often left behind at much higher levels, so by the time you get that signal, it is day 3 or 4 out of the lows. That is why I bought this strong reversal with a stop, knowing what kind of panic conditions & sentiment that this drop had. We had extremes, as mentioned in Mondays report. We could see short cover or buyers stepping in soon.
.
You may find energy Oil trades at the lows that you like at very oversold levels, but I will also look for trade set ups for tomorrows report. At times, after a STRONG 20% day in oversold stocks, they can pull back over the next 1-3 days. You may see this…
.
AND AGAIN- A strong 1 day POP can be followed by a pretty Big Drop. The Dow popped 1000 points Wednesday, it may be down 500 points Thursday, without causing any damage, but if you went long, USE STOPS AT THE LOWS.
.
The dip may allow you to enter an energy trade or Tech Trade (or add to a current one) if you missed the reversal due to being busy in the workplace yesterday. You can use intraday charts for entry points.
.
Enjoy your Thursday trading!
.

