Dec 8th Big Picture Ideas Coming Together
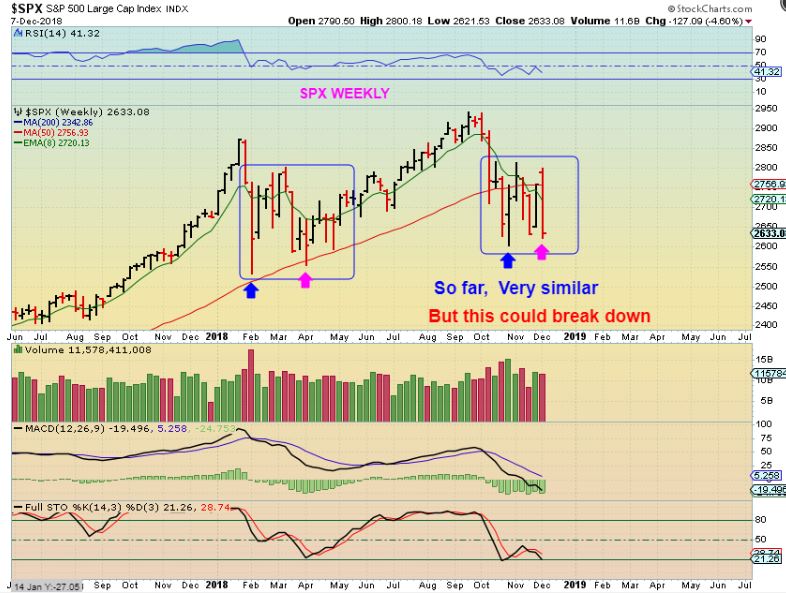
SPX WEEKLY – So far this looks quite similar to the Early 2018 Choppiness, but I did explain one big difference in Fridays report …
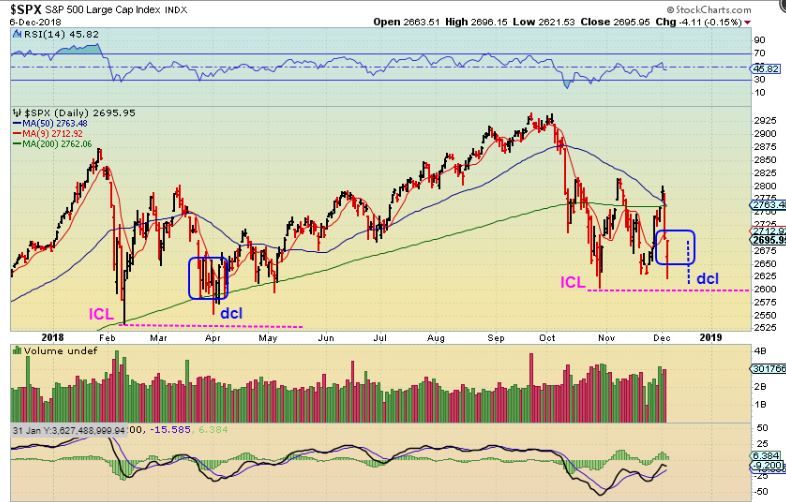
SPX DAILY – The choppiness this time may be topping action, because early 2018 bounced off of bullish support levels. This time The SPX broke under the 50 & 200sma and it is crossing down fast. I drew a Blue box to show that in early 2018 this just chopped sideways for another week and then a Higher DCL. This time we could do the same or just break down .
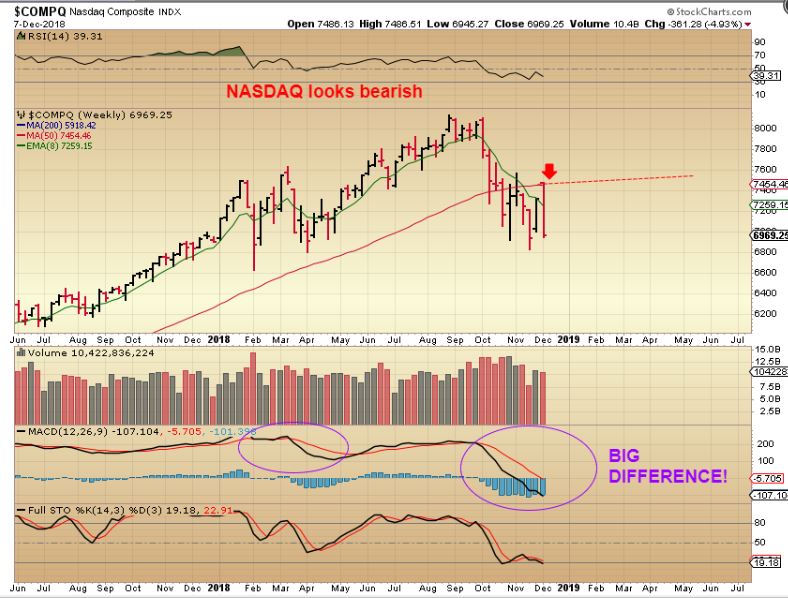
NASDAQ WEEKLY – Friends, that is one ugly MACD. These markets may be breaking down and showing some real signs of weakness. We can get a bounce out of an ICL for 2 daily cycles, but I have been warning that that 2nd daily cycle may become the lower high as things churn sideways, and then own we go. H&S.
IWM WEEKLY – The RUSSELL 2000 ( or IWM) broke to new lows already.
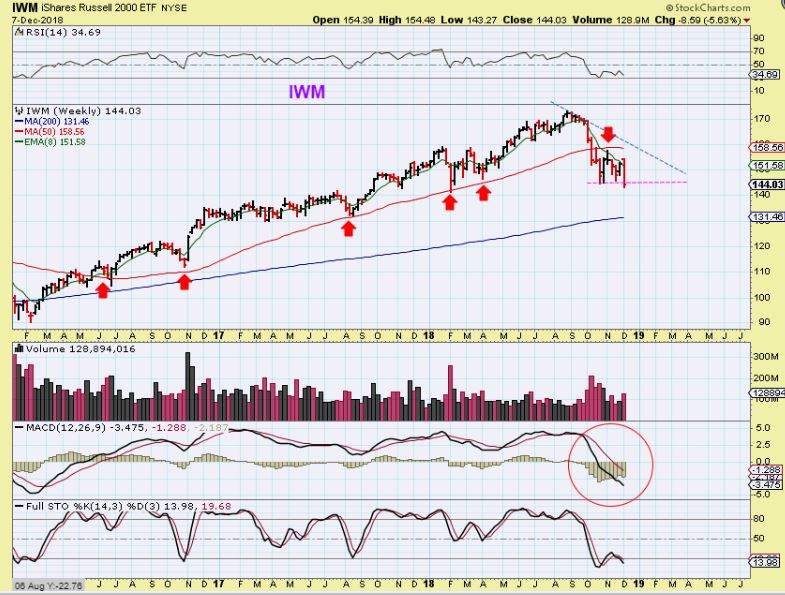
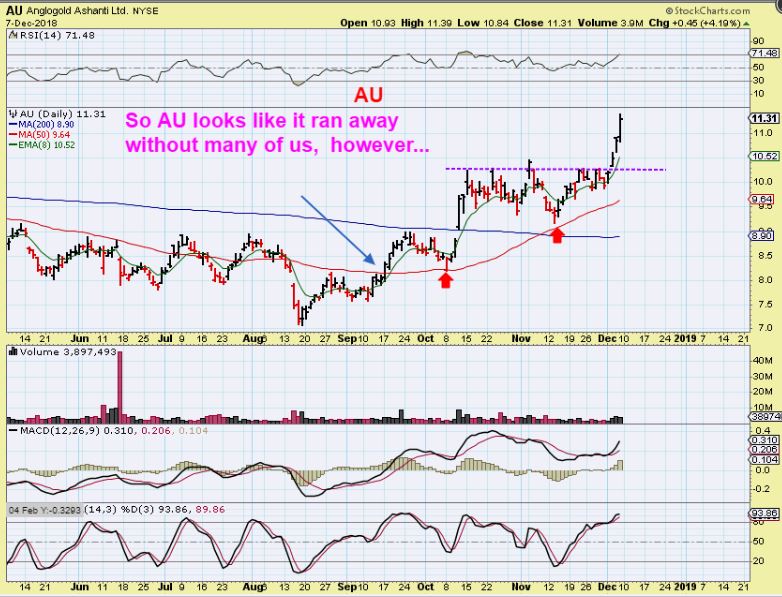
SO I have been saying that the BIG PICTURE is looking like the Equity Markets may become bearish in 2019 (they are off to a good start), causing money to flow out of the General markets, and into Miners. 2019 May be the Gold run that we have been anticipating, and, as mentioned, several Miners , like AU, are off to a good start, right??! I will discuss this further on in the report.
.
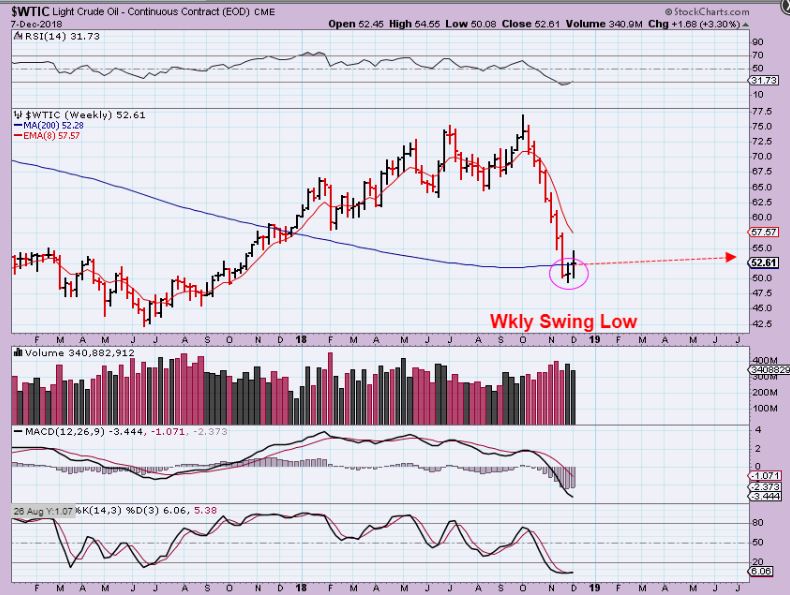
WTIC WEEKLY – We do have a weekly swing low in place at the 200 weekly ma in Oil. OPEC announced cuts in production to boost price. Let’s see if we get the follow through that we have hoped for.
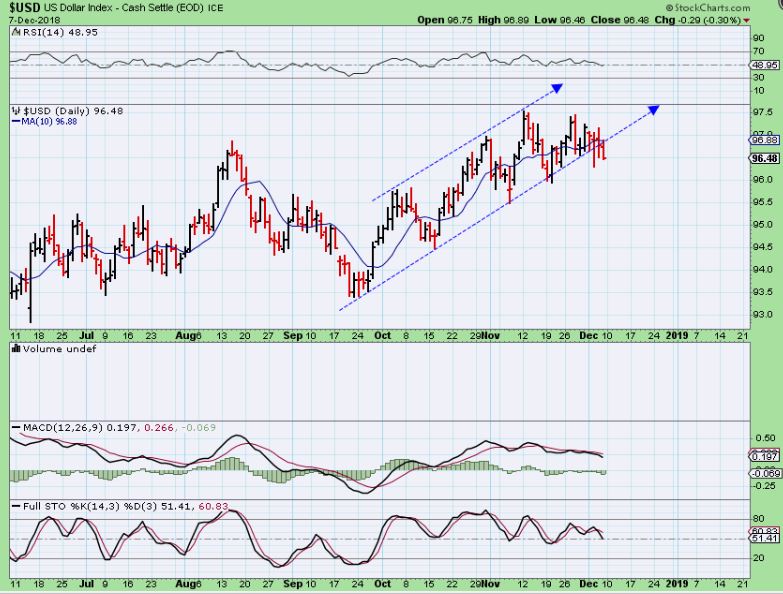
USD DAILY – The USD looks to be rolling over as Left Translated and the MACD & RSI have been weak. This can now drop or go sideways for weeks. Wouldn’t that be good for Gold & Miners? It would seem so.
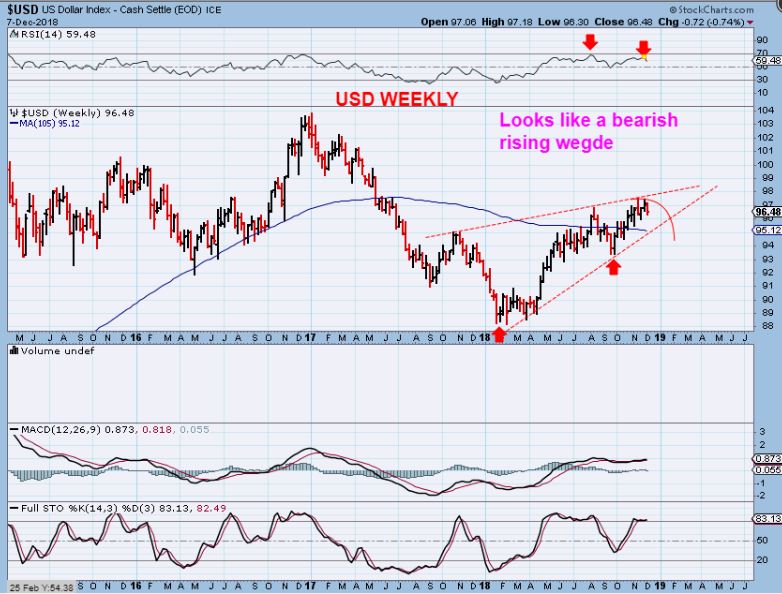
USD WEEKLY – The red arrows are ICLs, and one s coming due, so I would expect a pull back eventually into an ICL. I now see a bearish rising wedge in the bigger picture, so this next drop could dip down quite a bit (ICL). I will be watching to see if this becomes another Higher low (?) or Lower Low (?).
GOLD – SILVER – & – MINERS
.
This set up is still very mixed short term, but the Big Picture looks to be a BULLISH ONE. As mentioned in Many reports, some Miners are very Bullish, others are still at their lows. Also this week, particularly Friday, we saw Miners try to put in a very bullish end to the week, by trying to play catch up with Gold. Let’s discuss what we have right here & now…
.
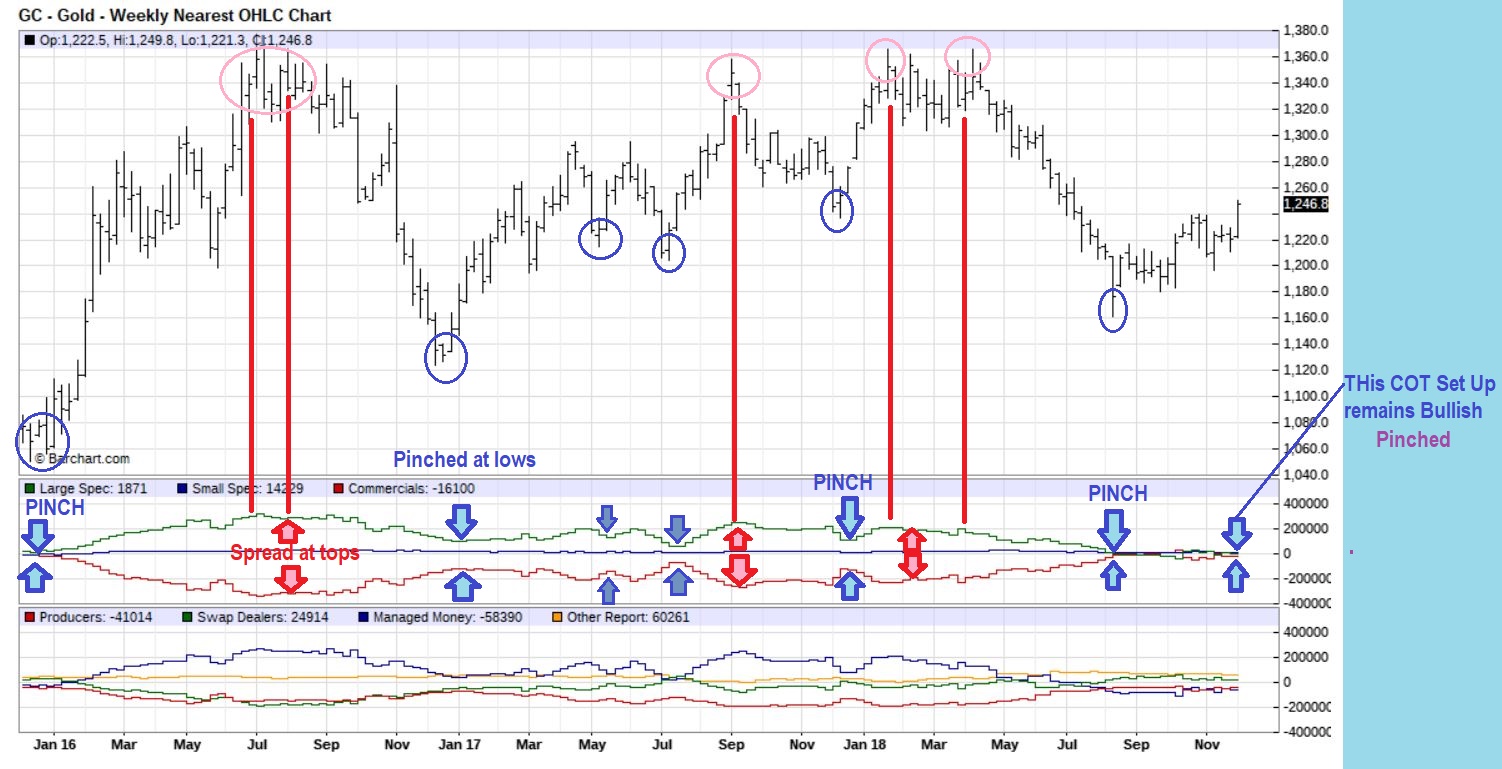
GOLDS COT – Smart Money remains very Bullishly Positioned. Click on any chart to enlarge.
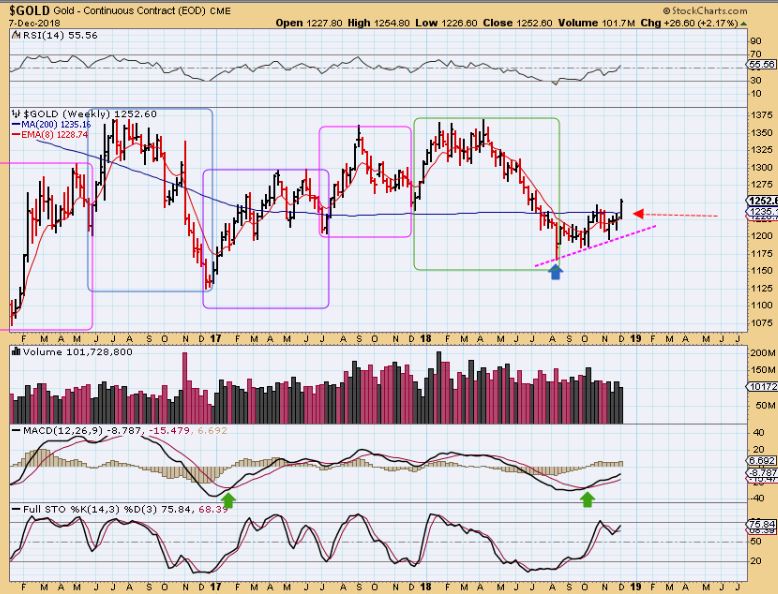
GOLD WEEKLY #1 – Gold Popped this week AND BROKE THROUGH THE WEEKLY 200ma! I have been saying a few things about Gold –
1. Gold has been bullish, but Silver & Miners really seem weak and need to catch up.
2. The ICL was 4 months ago, and another one comes due every 4- 6 months or so, so wouldn’t we be nearing the ‘time’ for a pull back? Yes, we should be.
3. The Intermediate Cycle Low (ICL) COULD BE A HIGHER LOW, similar to what the USD did, but
4. A slam down here would make for a good long entry at the next ICL ( Intermediate Cycles Low). So…
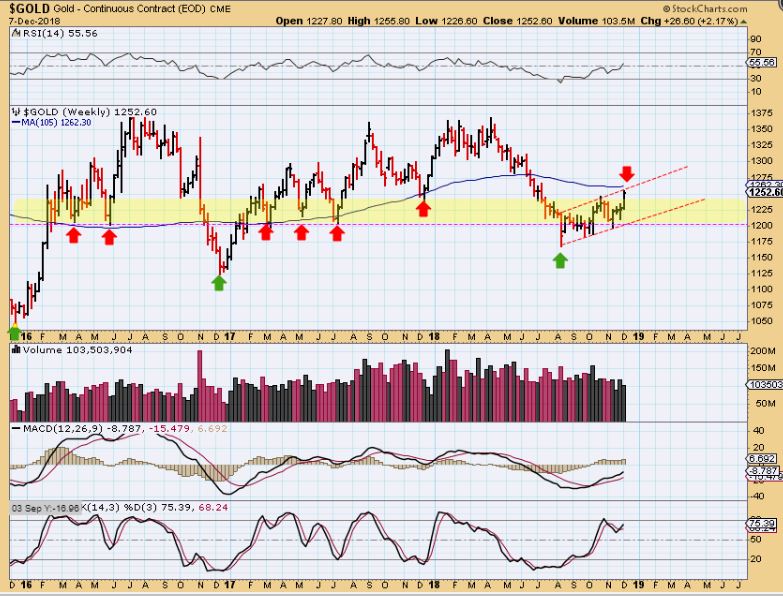
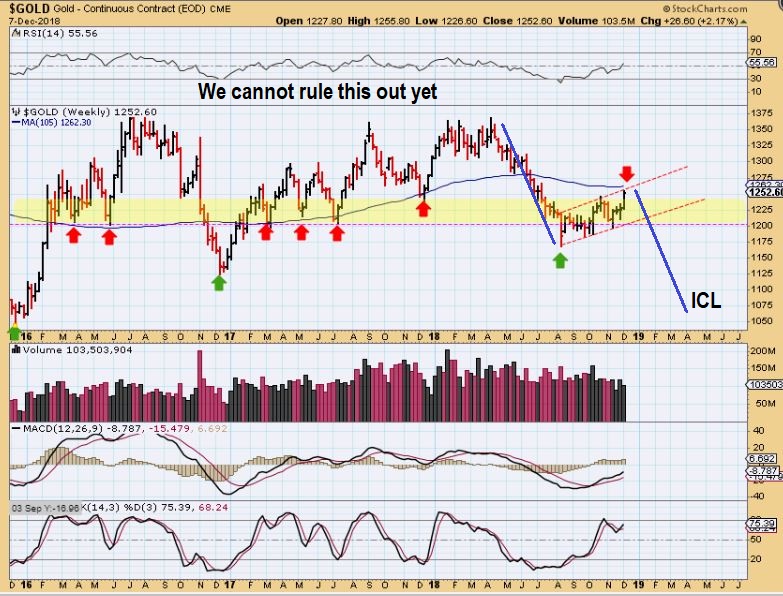
GOLD WEEKLY #2 – I found that the 100 weekly MA (not the 200 ma) has been more pivotal in Golds reversals in the past, see the Red Arrows , So this could act as resistance. Again, Gold is coming due for a drop to an ICL, so …
GOLD WEEKLY #3 – NO ONE expected the summer drop, after Gold was holding up at the highs so well. Not many are expecting another drop like it, so we can’t rule it out. I DO WANT TO SAY THAT THIS SEEMS LESS LIKELY, MAINLY BECAUSE THIS SEEMS LIKE TOO MUCH OF A DROP FOR THE CURRENT COT READING. Maybe we get 1/2 of this drop? Next chart…
The main message is that whether it is a higher low or a deeper low, and ICL is coming due.
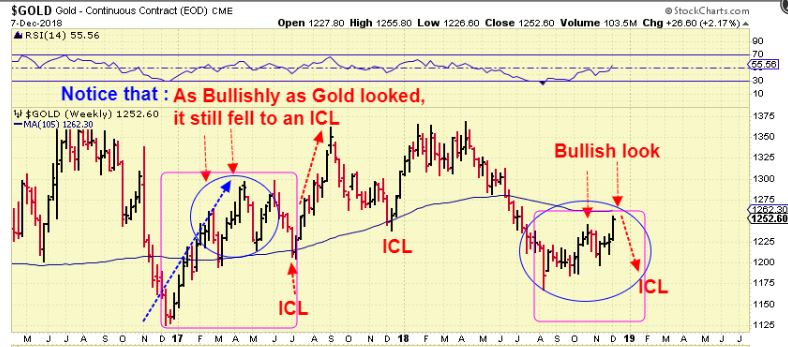
GOLD WEEKLY #4 –
2017 saw Gold ( Magenta Box) climb bullishly with 3 higher highs, but when it was due for an ICL, it made a steady drop for 4 weeks to that July ICL. We need to stay alert to how Gold has reacted in the past when the ‘time’ came due. Gold is approaching resistance.
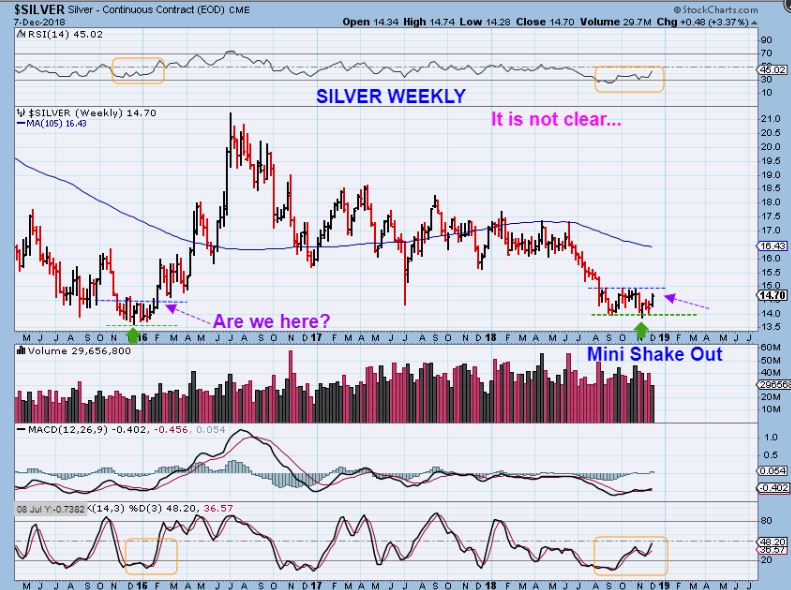
SILVER WEEKLY – Silver has NOT been running to new highs like Gold, so this looked weak and bearish. It decided to POP this week. I still see it as a base, and MANY Silver stocks remain near their lows, so we have not ‘missed the move’. I will say this, when Silver stocks run higher, the Gains will be explosive & very much worth the wait ( thought the wait has been very frustrating). So are we at this BASE, similar to 2016? Possibly. Maybe Silver will lead Gold as Gold drops and Silver resists the drop, however…
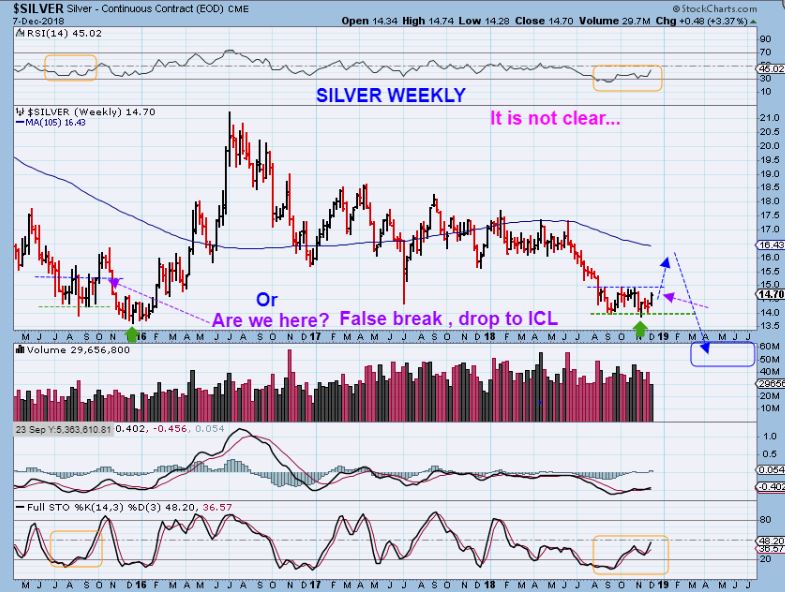
SILVER WEEKLY – Or are we at this base in 2015? In 2015, a mini base formed that also resembled out current base. It broke out higher from the base and then dropped to the final ICL .
.
Here is the situation with Miners :
.
Gold was running strong and GDX & especially GDXJ were NOT running with Gold. They looked weaker.
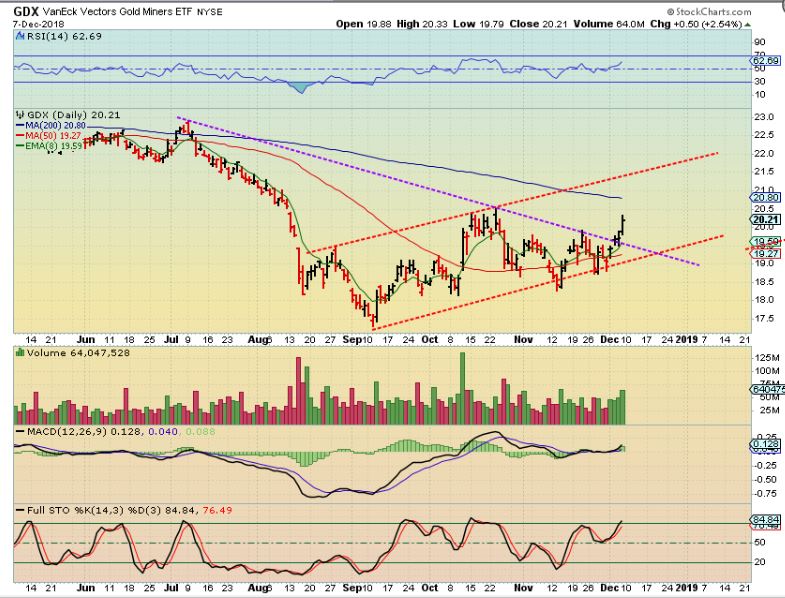
Here on Dec 4 I showed how choppy GDX has been. It has been frustrating!

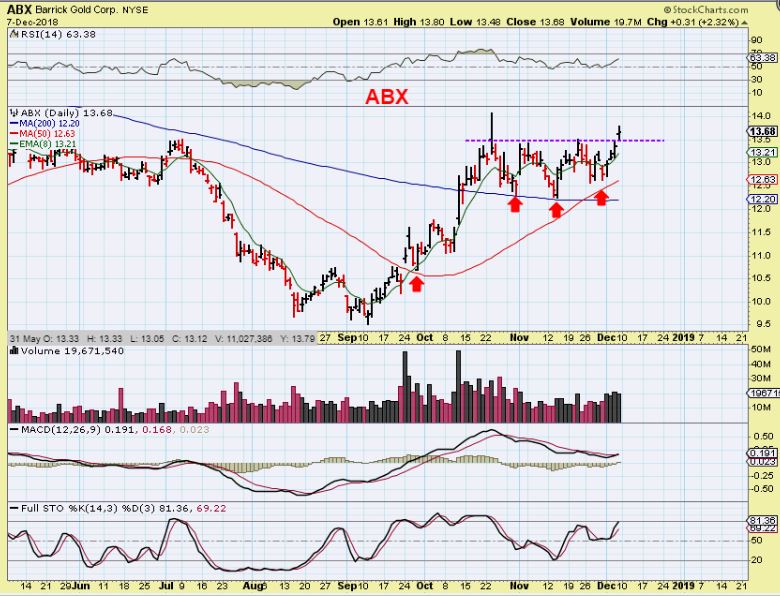
However: I have also been pointing out since September and October that several Miners are actually leading & are still looking very bullish. They include AU, KL, AEM, ABX, and more…
.
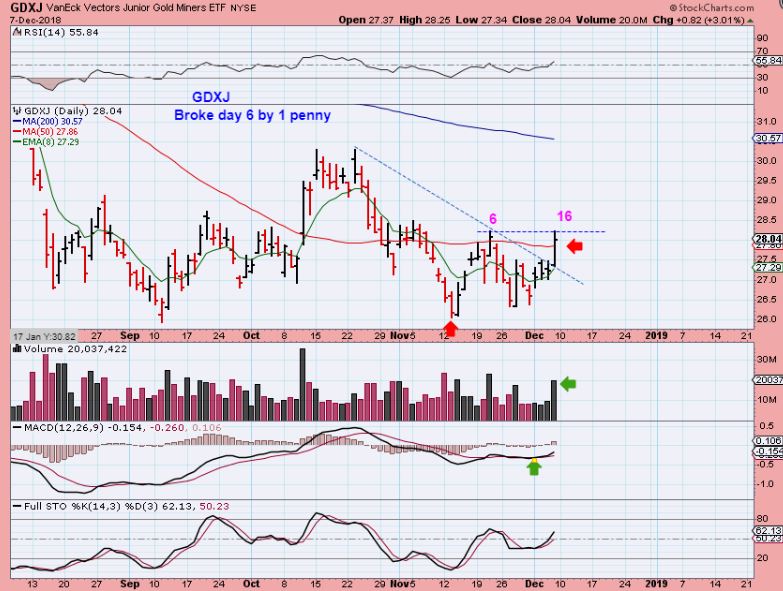
GDX DAILY #1 – Here we see Fridays GDX POPPED and may run to the 200 sma. SO GDX may tag that 200 sma ( or slightly break it) and pull back. Lets zoom in…
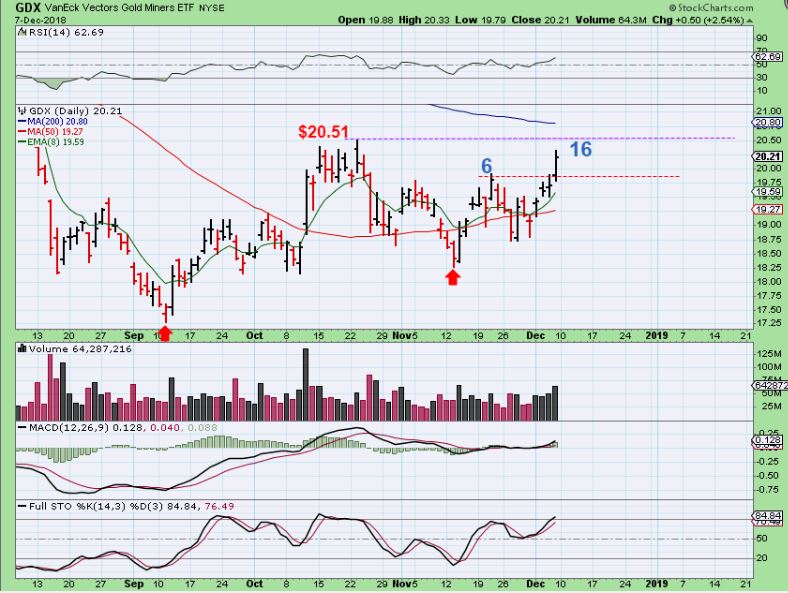
DAILY #2– We now have a day 16 peak in the daily cycle. This now really looks like a bullish set up using technical analysis, and it could actually break from this base & run for a few more days too. So that said, If GOLD is at Month 4 from the August lows and an ICL comes at lets say month 6, GDX can run for a while. That said, if anyone went or goes long at this point, A STOP IS NOT DEBATABLE. Keep in mind that this choppy sector has stopped many out repeatedly, but why is a stop that important? Because …
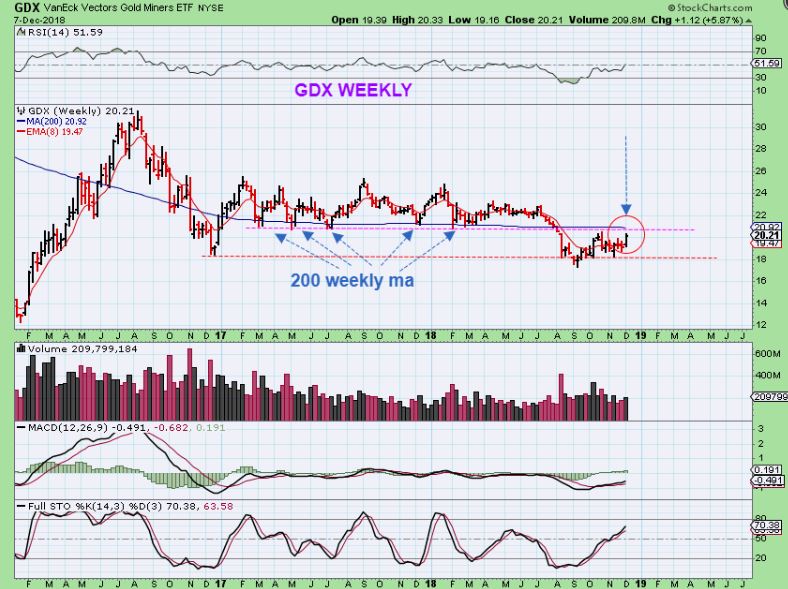
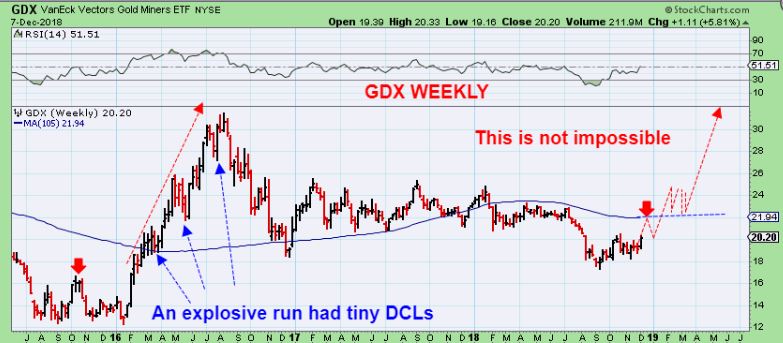
GDX WEEKLY #1 – GDX is actually really just a long base forming. YOU HAVE NOT MISSED A BIG MOVE HERE. BASES are choppy and difficult to Buy & Hold due to daily gyrations, and we have seen that. Here we see that it is approaching resistance on this weekly chart too. This may cap the run for this Intermediate Cycle, but a break out could also run quickly higher from the base too. Unfortunately, We are now in the very middle of an intermediate cycle, and that makes this VERY DIFFICULT to forecast higher or lower. That mega run in 2016 barely had pull backs once it got going, but most all other pops from here did not last long in 2017.
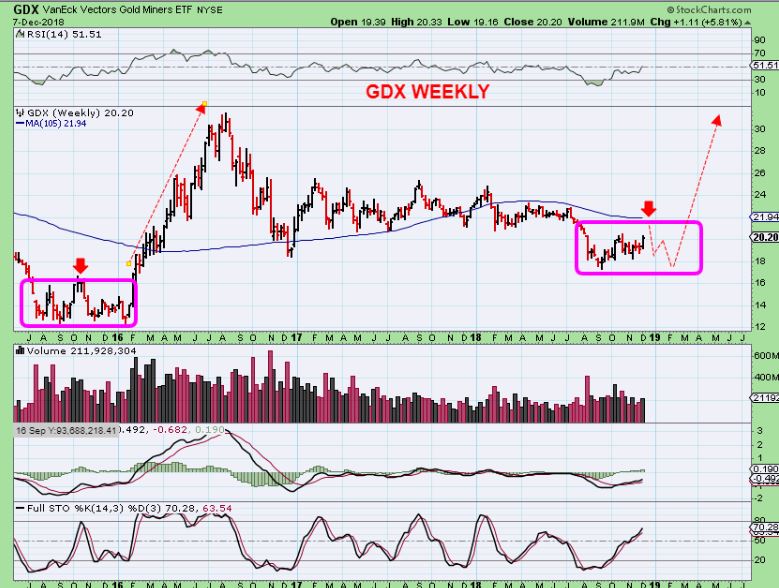
GDX WEEKLY #2 – Honestly, because the GDX ICL was in September, we are only 3 months ahead of that icl. That means that we are in the middle of this cycle, and it could pop & run, or it could continue to form a complex Base like 2015 into 2016. Notice the similarities below.
GDX WEEKLY #3 – QUESTION: Is a major run like 2016 starting right now possible? It is not impossible, but even if one starts now, you will have PLENTY of time to profit from those Silver stocks and other Miners that are still near their lows as they start running higher too. The point is – GDX is still in a base, and GDXJ IS STILL AT THE LOWS. Let’s look at GDXJ…
GDXJ WEEKLY – You can see that you have not missed the move in Juniors, GDXJ is still at the lows, building a base. Even if Miners started to run away from here, we will catch most of the run.

GDXJ DAILY – The daily GDXJ did make a new high on day 16 also, by 1 penny! It also broke the down trend line. Volume surged and it looks bullish, so again, this gets tricky with Gold 4 months from the Aug ICL, but Miners only 3 months from theirs. I will say this, when Miners do break & run from the bases being built, it will be very easy to make $$$$.
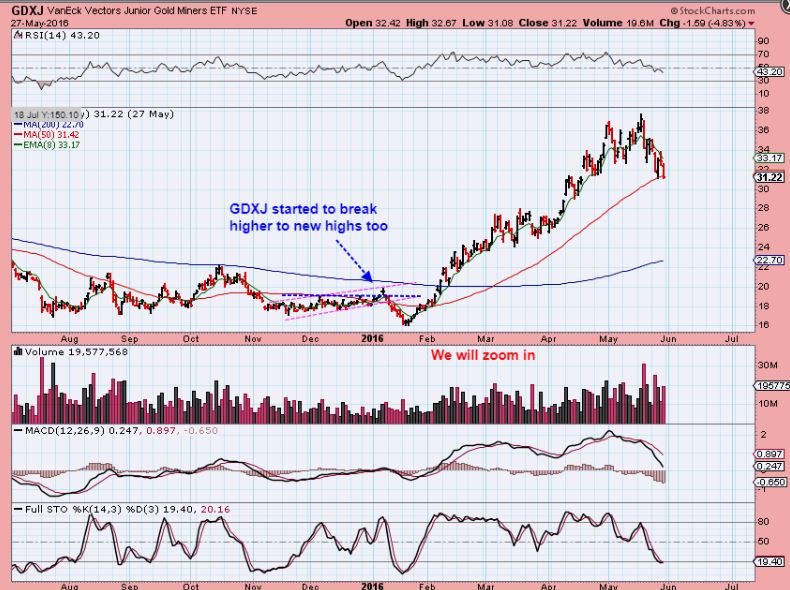
GDXJ WEEKLY – I want to show you the current GDXJ WEEKLY SET UP again. Notice that I put a possible drop in there too. That is because of what GDXJ did in Jan 2016. Let’s take a look…
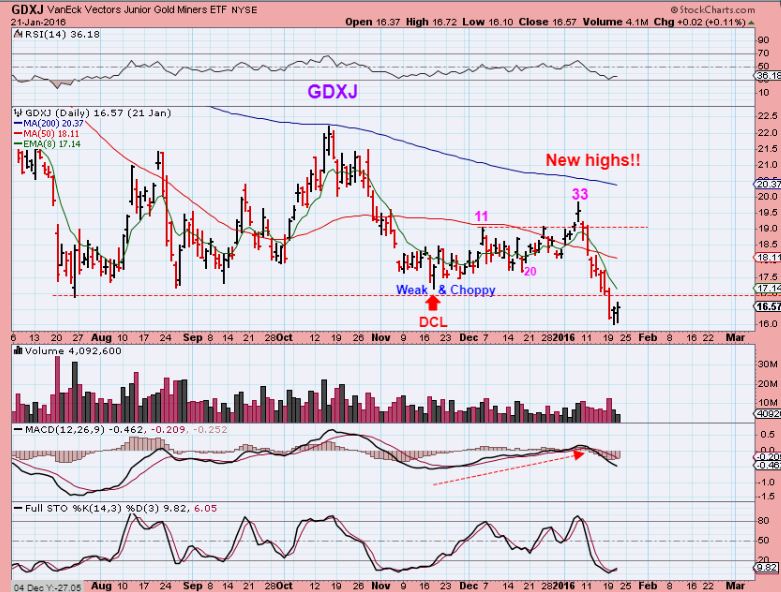
GDXJ 2015 – Notice that Miners looked like they were taking off in Nov 2015 to Jan 2016 too, as they started breaking to new highs late in the daily cycle. That is similar to what we are seeing now, but then… it crashed into that final JAN ICL. Let me zoom in on this one too…
GDXJ 2015 – This could be what we are seeing now. GDXJ put in new highs with a break out LATE in the daily cycle. This looked as bullish as Miners now, but it dropped for 2 weeks to an ICL. THIS IS WHY I SAID THAT IF YOU ARE LONG, YOU NEED A STOP.
I do hate the fact that this is so unpredictable, but again, it has been very choppy and frustrating for many, myself included since I owned JNUG. Remember how GDX was breaking above and below that 50sma all the time.
Now GDX looks quite Bullish again on day 16. We are well along into this intermediate Cycle and we’ve seen something similar in 2015-2016. At that time, Miners broke higher on day 33 and then had a final sell off to an ICL. That was unheard of, but it happened. With Gold now 4 months out of an August ICL, this can go either way for the next month or two, and a drop to an ICL will come in the near future. How deep we cannot tell. On top of that, we have those Leading Miners that are still setting up and breaking out, and the COT set up seems quite bullish. I will discuss leading stocks below. Basically the only solution is to buy the break outs if you want to take position just in case the run continues, but maybe keep positions small at this point, and use a stop. The alternative is to wait and see if those resistance points mentioned in those charts above do act as resistance to ‘top’ this intermediate cycle out, and buy the next ICL.
.
You can see from this weekends current Big Picture set up that the Equities look weak and may be ready to start a down trend in 2019. With that, Miners look increasingly bullish and look to be building bases and appear ready to start an uptrend in 2019 (with some already doing that). As time goes on, the BIG PICTURE looks to be getting clearer and clearer, and though we had a very choppy week or even a choppy sloppy Month of frustration, the future looks very bright when the time is right. I am thinking that we are going to have weeks upon weeks of excellent trading in the near future.
For now I am watching these resistance areas in GOLD, GDX, and GDXJ …
As always, My daily reports will always cover the events taking place, and as they unfold, we will take advantage of the opportunities as they arise. I will point out a couple of set ups below too.
.
That is your Big Picture review, enjoy the rest of your weekend, and thanks for being here and being a Chartfreak with me!
.
~ALEX
.
ABX is breaking out AGAIN. Notice how it acted around the 50sma and the 200sma. This was a buy at $12 & $12.50 with a stop under the 200sma. It is also a buy here, but stops should probably be raised due to cycle timing.
This is a BUY if someone wants to enter miners again with a bullish set up.
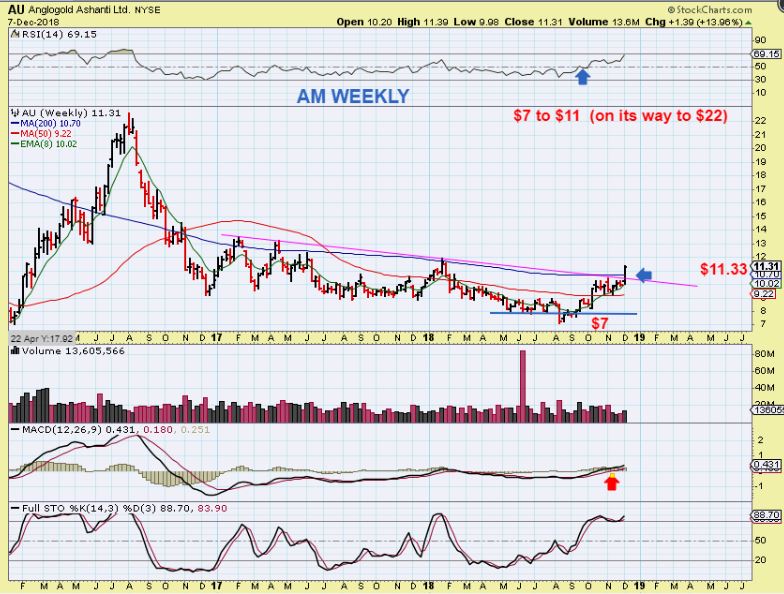
AU DAILY – This is a Gorgeous chart, really. I love when a stock bases, runs, consolidates at the 50 sma, runs , consolidates above the 200 sma, runs, etc. And even though it looks like these have run away from the lows from $7 to $11 …
AU WEEKLY – It is really a large base with great potential. Many of these Miners are going to make us a boat load of money when they break out and run from these multi month bases.
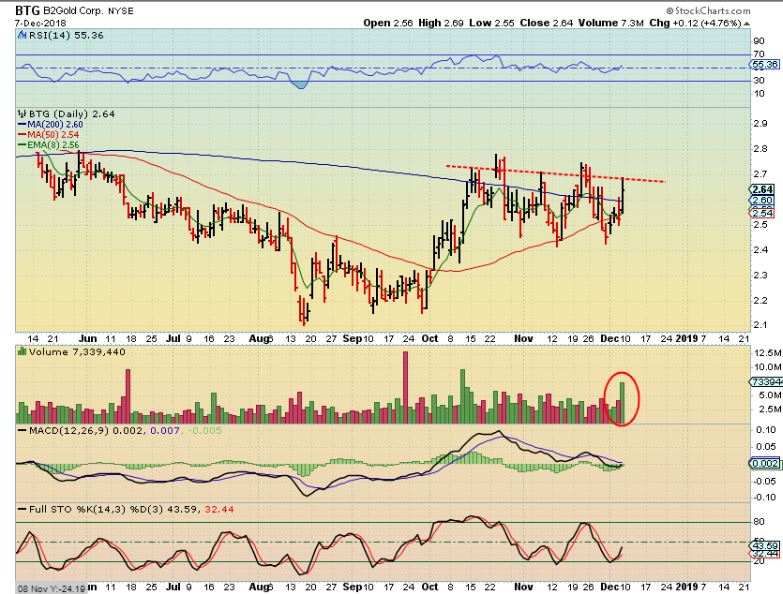
BTG DAILY – This is also looking like it wants to break out, so I Bought it Friday. I like the volume increase after this consolidation, and a stop can be placed (maybe loosely) under the 50sma. I will know how long I want to hold this based on how GDX/GDXJ act at resistance.
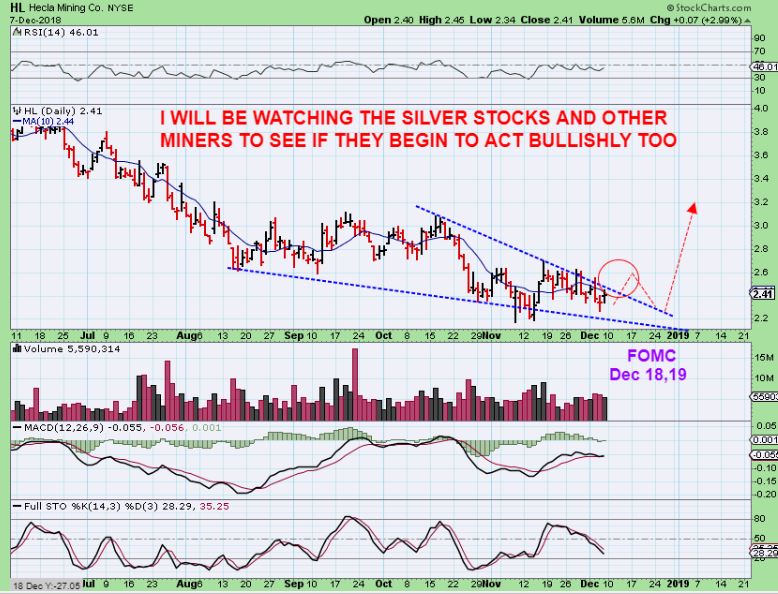
HL DAILY – Again, many Miners still remain near the lows, and I will be watching for Bullish clues as we move forward.