Dec 22 Weekend Report- 401K Damage
It has been reported that past week was the worst December in 10 years for the General Markets. I am hearing that depending on how it ends this week, it could even become the worst drop for the Dow in decades.
.
This week I was thinking about the average person and their 401Ks. Why? I went to lunch with 2 friends on Thursday, and they said to me, ” I saw the Dow was down 600 points! I know it’ll recover, but wow, that is the 3rd time that I saw that recently. This is just normal sideways stuff, right?” Hmmm, Since October, the markets have plummeted and erased all of 2018’s gains. Even though most know that the markets are shaky or ‘having a rough spell’ as my other friend mentioned, I just realized that most do not know that the final quarter of 2018 wiped out all of 2018 and then some. Depending on how their 401k is set up, there may be an awful lot of shock when the next quarterly statement is viewed.
I showed my friends the chart below as of Thursday on my phone and they were shocked. “I thought we were still chopping around at the highs?”, my friend Danny said. Let’s look at some charts….
.
SPX WEEKLY – You can see that last February -April, the sell off was steep, but this one has been 2x that drop. It is now approaching the 200 weekly ma as a possible support. This chart helped my friends to see that the last 3 months of 2018 may have wiped out their entire year of 401k gains and even half of 2017, depending on how they were set up. They were shocked and unaware, despite hearing about a few 600 point drops on the news.
SPX WEEKLY – This is the same chart, I just wanted to say that Last weeks Drop was VERY BIG, much like the final drop in February. It could finally be a capitulation sell down. Next week Might tag the 200ma, and then put in a reversal, but that is not necessary, just likely. we’ll just have to wait and see.

SPX WEEKLY – We have to face the idea that even the 200 ma may just be temporary support if we are heading into an economic slow down. Can’t you picture a bounce (ICL) that eventually rolls over like this (A-b-c). During the Bull Market I drew this and certain Bulls told me I was crazy. Now I think we can all see it as possible.
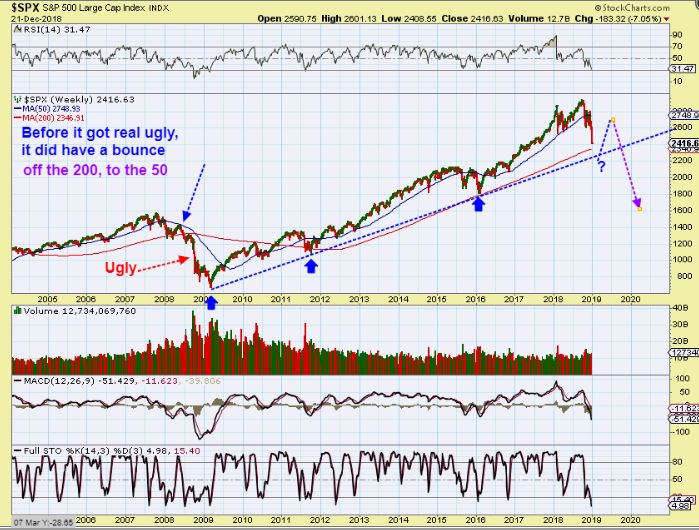
SPX WEEKLY – On the other hand, that is a long term trend line & it may act as support. The Bull Market could resume after the correction, so we have to keep watching how things unfold in the Big Picture too.
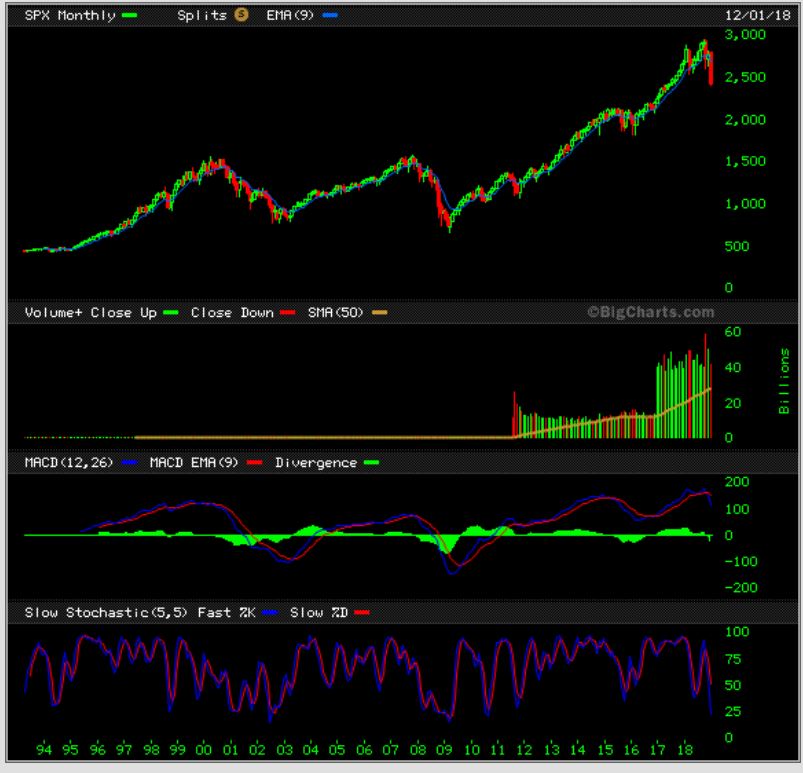
SPX MONTHLY – This looks like the start of a longer term correction. We broke below the 2018 Yrly Lows, and that would have me expecting the start of a longer term yearly down trend after our next Bounce. Look at the prior (Red) down trends, and that is what we should expect. THIS COULD BE VERY BULLISH FOR PRECIOUS METALS IN THE BIG PICTURE (After the Markets bounce).
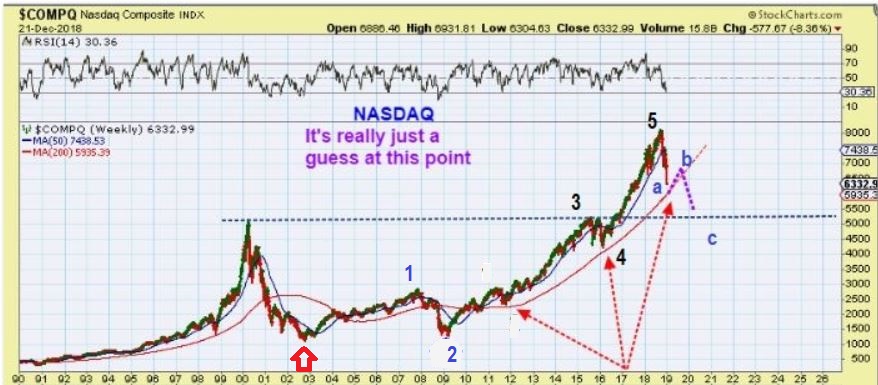
NASDAQ WEEKLY – Was it 1-2-3-4-5 (Top) and an a-b-c correction? This would break the 200ma after a ‘b’ bounce, and drop to back test the 2017 break out. Absolutely normal technical analysis, but Difficult in real time, huh? We have only done the ‘a’ portion of the drop if this is to take place.
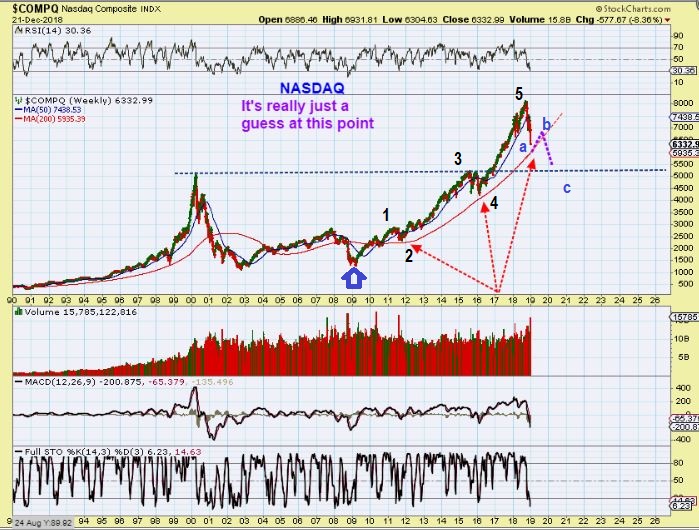
NASDAQ WEEKLY – This simply adjusts the starting point of the count to the 2002 lows instead of the 2008 lows. The count remains the same, a top & a correction.
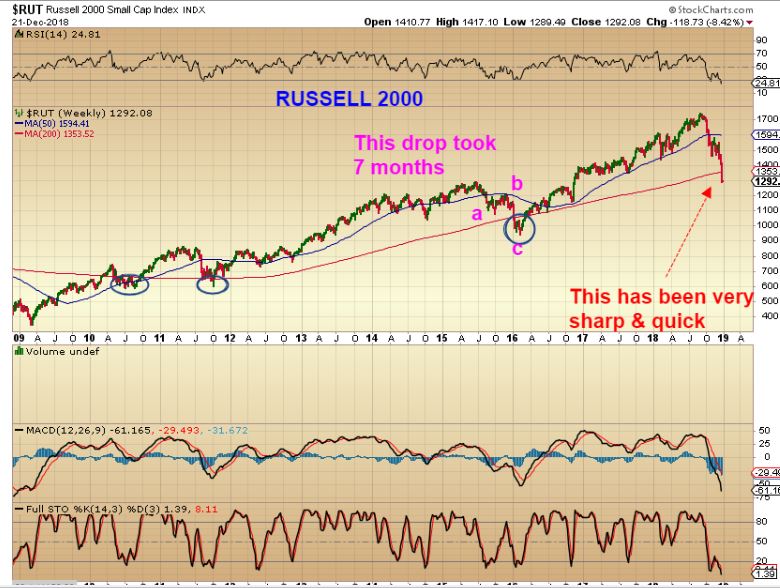
RUSSELL 2000 WEEKLY – Look how quickly the Russell 2000 has dropped this time, compared to the 2006 a-b-c correction. It broke the 200ma, but it has done that in the past, I don’t view that alone as a break down.
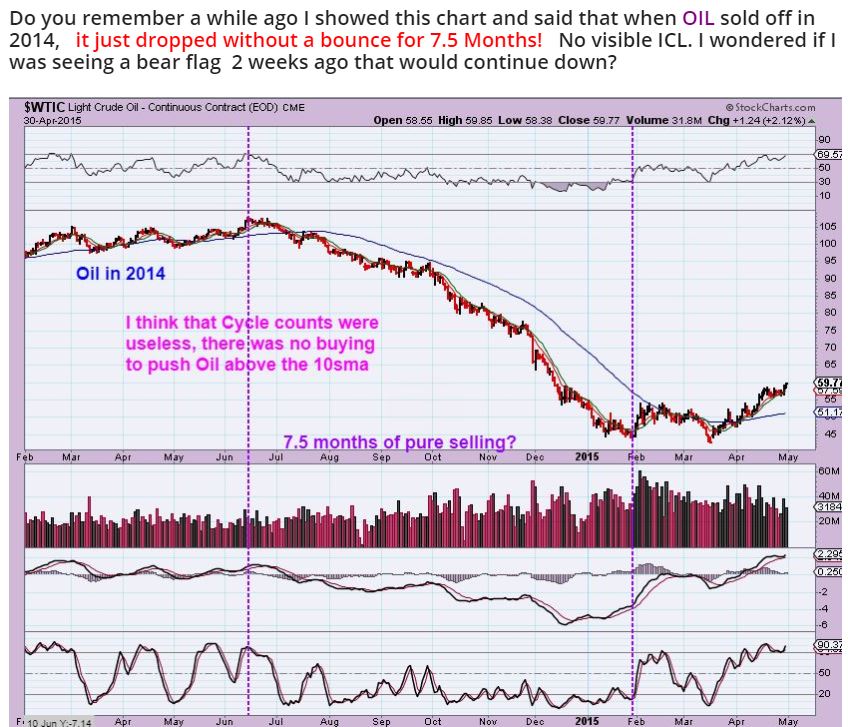
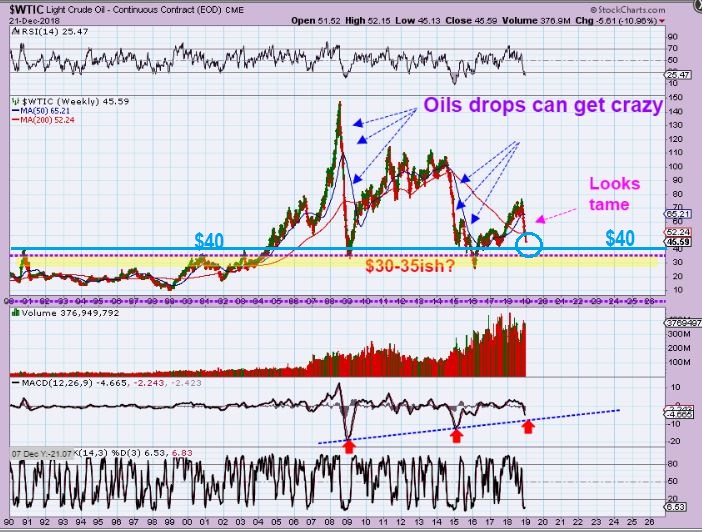
OIL WEEKLY – I have been mentioning ( This was in Fridays report again) That Oil has sold off very deeply in the past without a real bounce. This was a 7 month sell off in 2014. So I wanted to dip a bit deeper for the weekend report, and try to figure this current Oil Drop out.
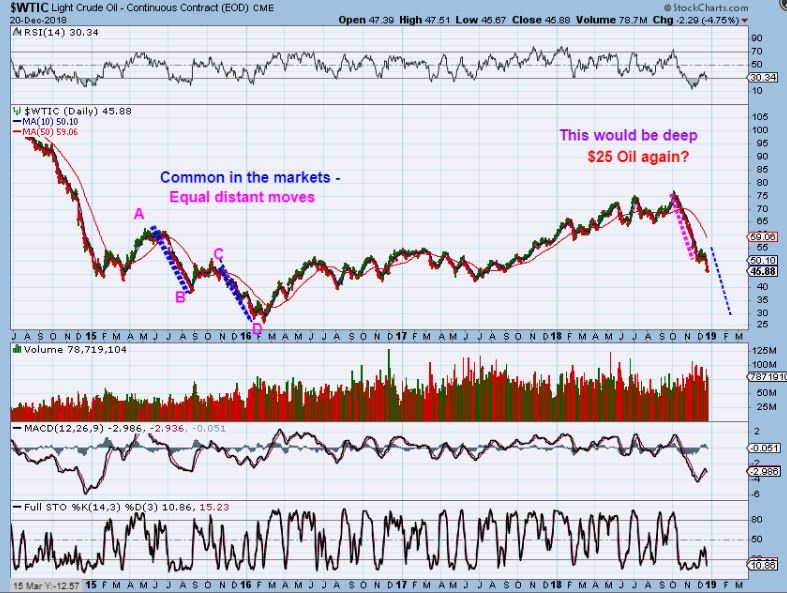
OIL WEEKLY- If we did a giant A-B = C-D from here, which I do often see in the markets, this drop would still have further to go. That would take OIL down to the $30’s. IS THAT REASONABLE? I am actually seeing $35 to $40 as possible…
OIL 7 year cycles- Oil seems to put in sharpest drops to lows every 7 years. We are not at the 7th year, so I’d think that this would only be mid-point. The Mid-point drops in 2011 & 2012 were as deep as this current one,( Magenta arrows) but there is support / resistance at the $35-40 area too. Lets step back…
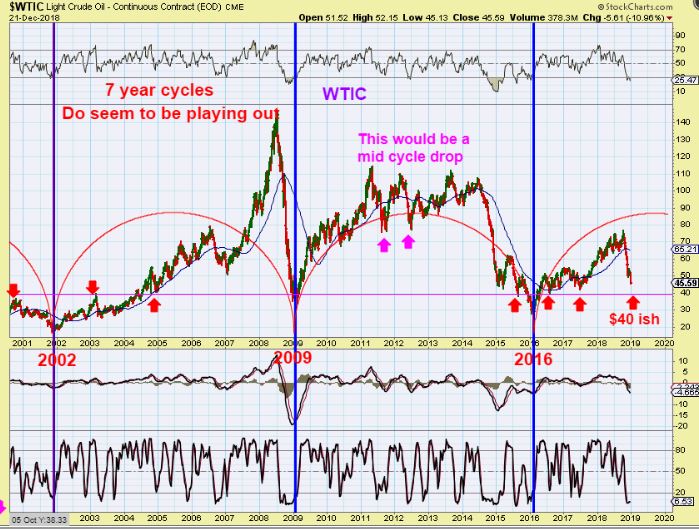
I decided to step WAY BACK for a Big Picture view. WOW! This drop is small compared to some Oil 7 year cycle Drops, isn’t it? A drop in Oil to the $35- $40 area would find a support level that has held past OIL PLUNGES. It is former “resistance turned support’. This shows me that OIL $35-$40 is not out of the question, and I am watching many Oil stocks for a possible great buying opportunity later. Not quite yet though.
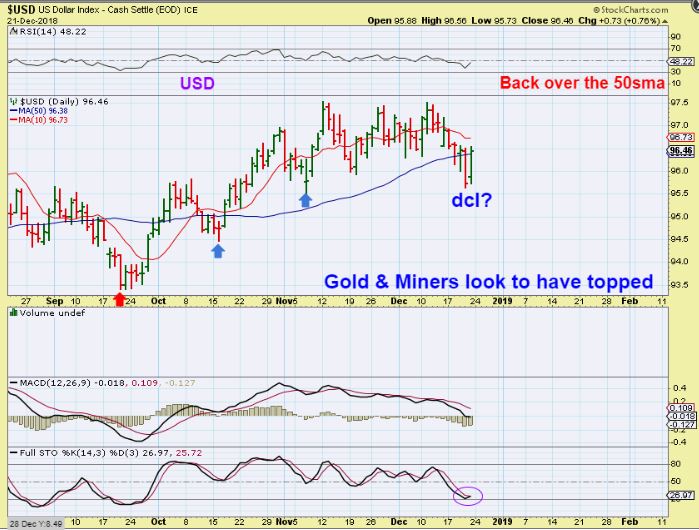
USD DAILY- The USD lost the 50sma, and regained it. That could be the daily cycle low. This could drop Gold to the DCL.
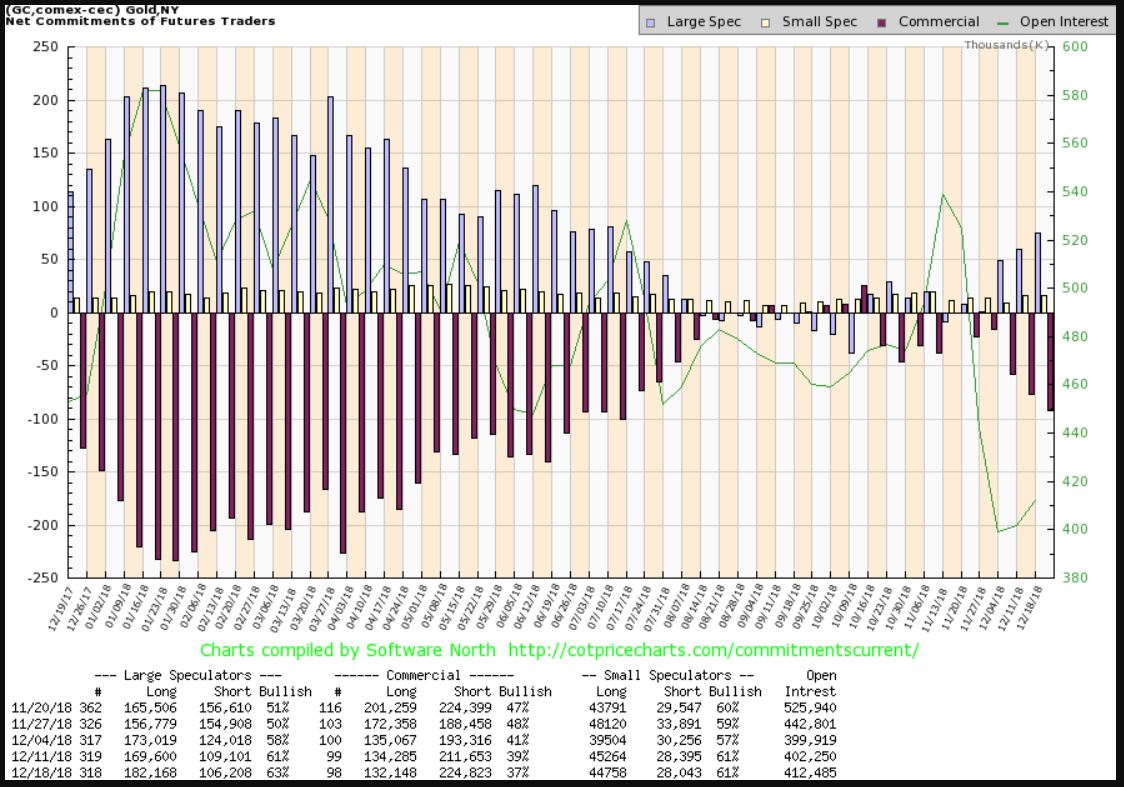
GOLD COT – This was as of Tuesday, and Gold ran up even higher after the FED on Wednesday & Thursday, so I would expect these smart money shorts to increase on the next COT report too. THIS IS NOT considered ICL level, but we are due for a drop into a dcl, and an ICL soon too. I will discuss what this all means to me.
GOLD – Gold peaked at there resistance areas on the weekly chart, as expected. It can go sideways , but the blue moving average probably capped it for now, and it is due for a dip into a dcl. I am expecting a dip to a dcl soon.
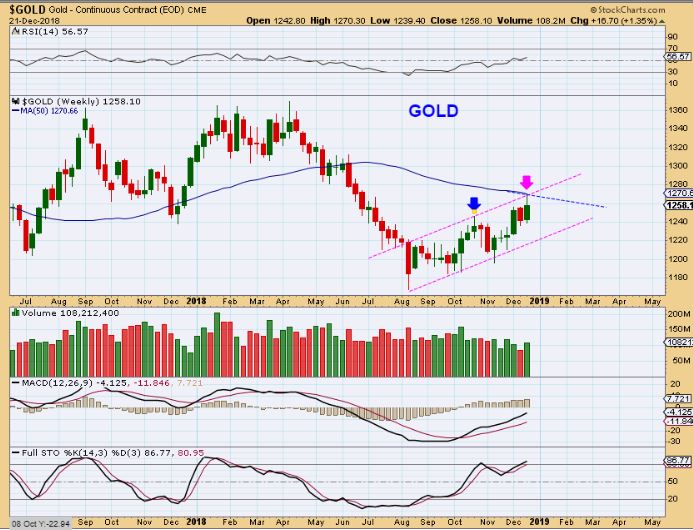
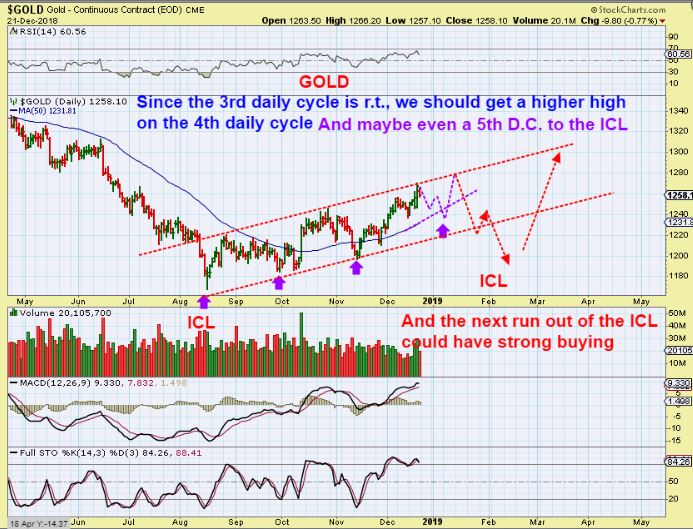
GOLD – The 3rd daily cycle was R.T. ( Right Translated), so we shouldn’t be surprised if we get another peak on the next daily cycle, but that may be L.T. & drop quickly. Purple arrows are DCLs. Read the chart as an example of how it could play out..
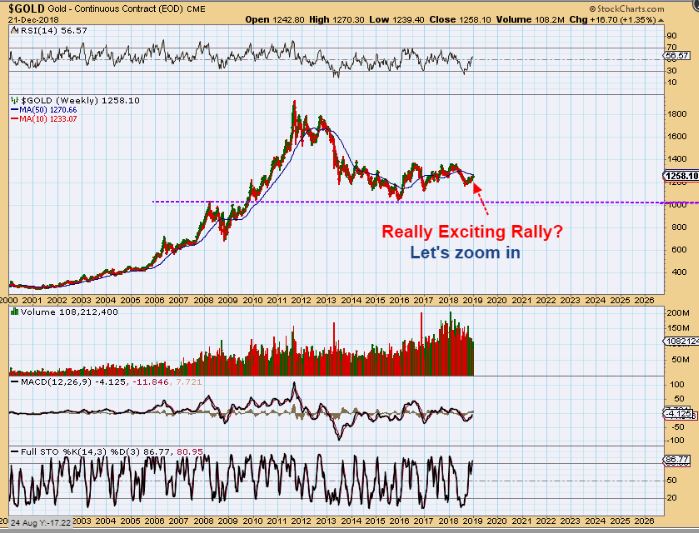
GOLD – I know that some are very excited about Golds sudden push higher, but how is the Big Picture so far? Well, the chart speaks for itself. Look at the current rally.
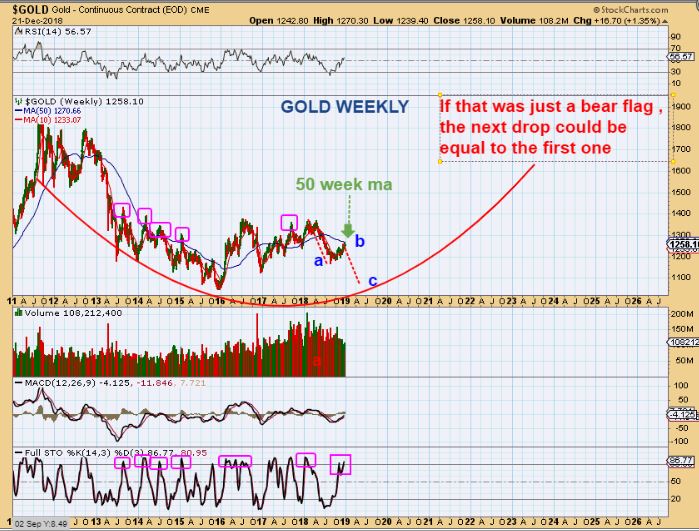
GOLD – This is now overbought on a weekly basis. If this was an a-b-c down, that ‘B’ could be a bear flag, so I want to keep that in mind as we anticipate the next dip. That run for Gold was not that great in the Big Picture. Even though Gold can break out & run at any time it wants….it can also drop into an ICL anytime now. If you are long Precious Metals, my advice is to watch position size .
GOLD / SAME CHART – I can also picture a smaller pull back and a break out higher, so we have to see how the pull back plays out, but think of this: Gold has pushed higher as the general Markets Crashed. The markets could put in a good 1-2 month bounce, and Gold could do the opposite again. I just want to admonish reasonable stops if you are going long or leveraged at this point in time.
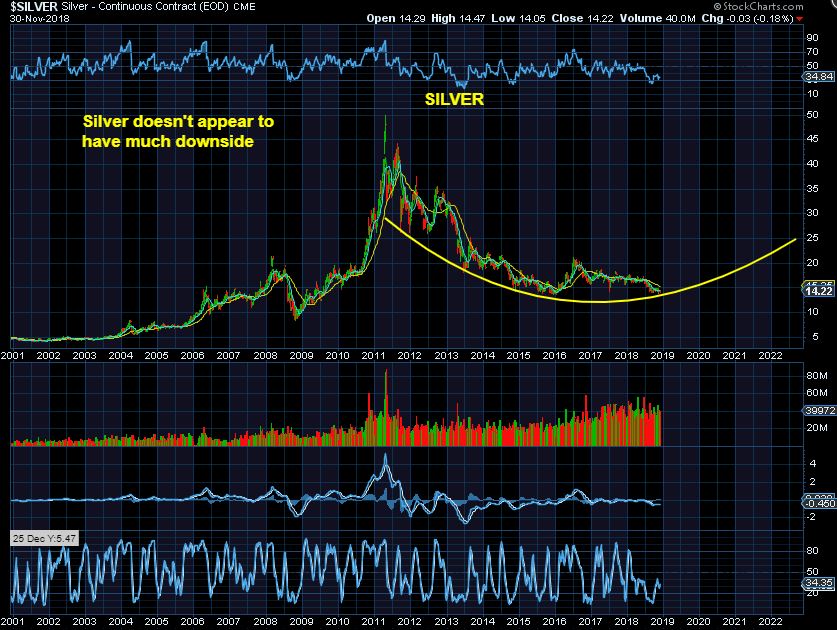
SILVER – I like the Big Picture for Silver. Lets look at a close up.
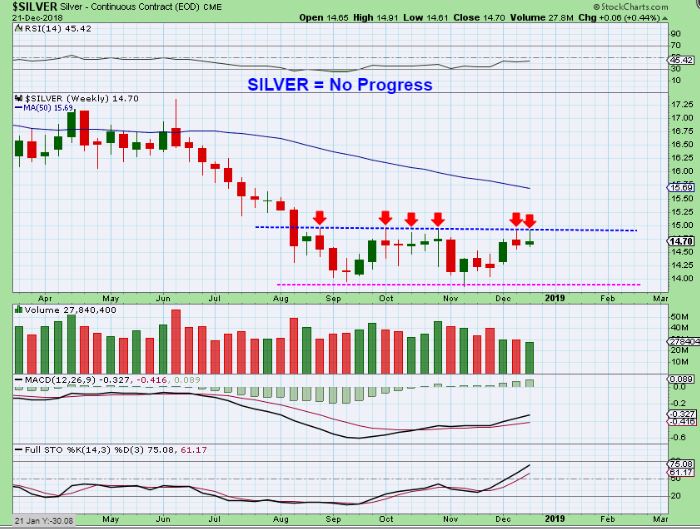
SILVER – Silver did not rally with Gold. This is a base and the candles at the highs of this base have wicks on top ( usually calls for downside). Just another cautionary point for those leveraged long. Use stops. I AM GOING TO DISCUSS BULLISH THOUGHTS LATER, but for now I see us due for a dcl, possible ICL.
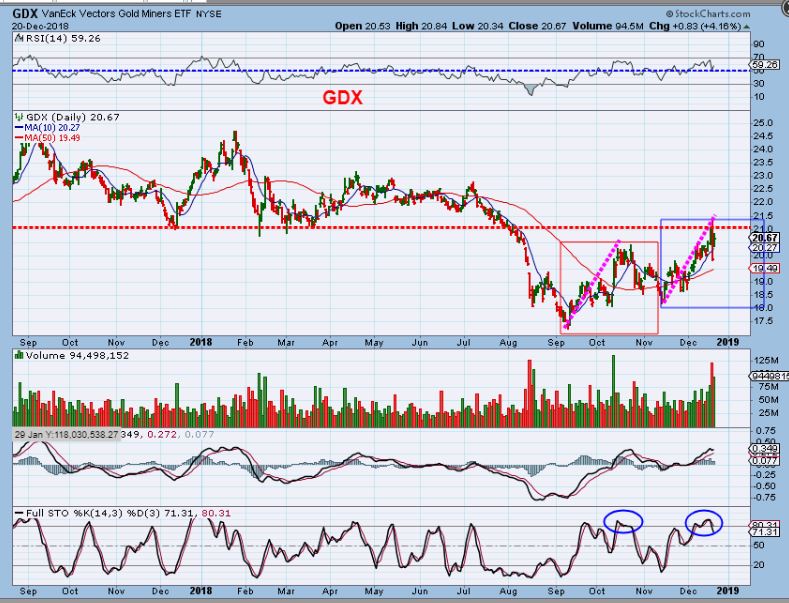
GDX #1– When I look at GDX, I actually called for a repeat of the first box weeks ago. I now see 2 closely equal distant moves higher. We are also back testing resistance. The daily cycle is getting late.
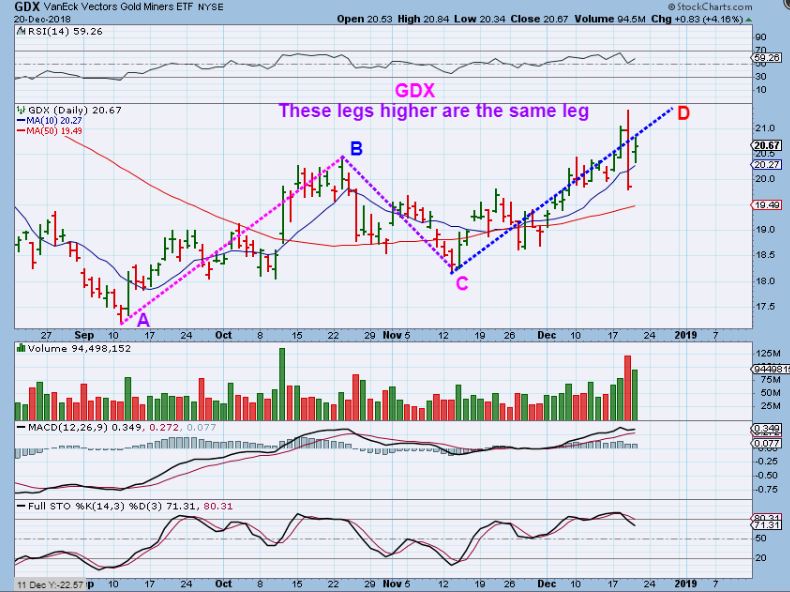
GDX #2 – I drew this Friday premarket, and GDX dropped Friday, so add one more down day. I drew the Magenta line side by side with the Blue Line, to be sure that they are equal distance. This run could be complete. IT CAN CHOP SIDEWAYS, but I expect a drop to a dcl in the 30+ days time period. Friday was DAY 26.
GDX WEEKLY – My chart from Fridays report. I mentioned that after Fridays trading, the weekly view could show a top.
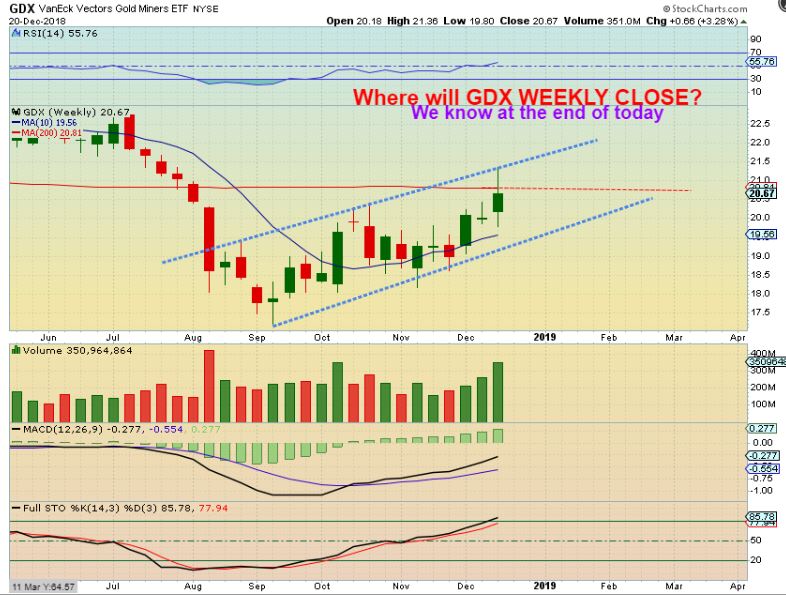
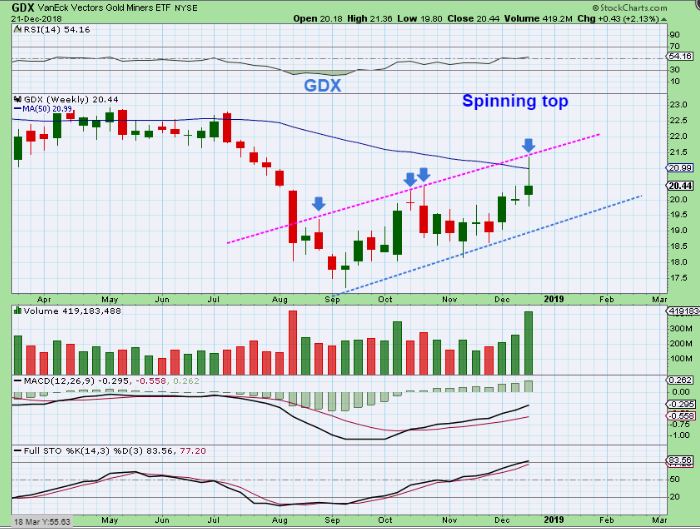
GDX – THAT IS A SPINNING TOP CANDLE, and we did have one last week too, often sign of a top. It does look like a top for this daily cycle. It could also be the top for this intermediate cycle ( the roughly 4-6 month long cycle). Notice the double tag of the Magenta Line in October. can that happen next week? Yes, but I still think this is a temporary top, even if it bounces.
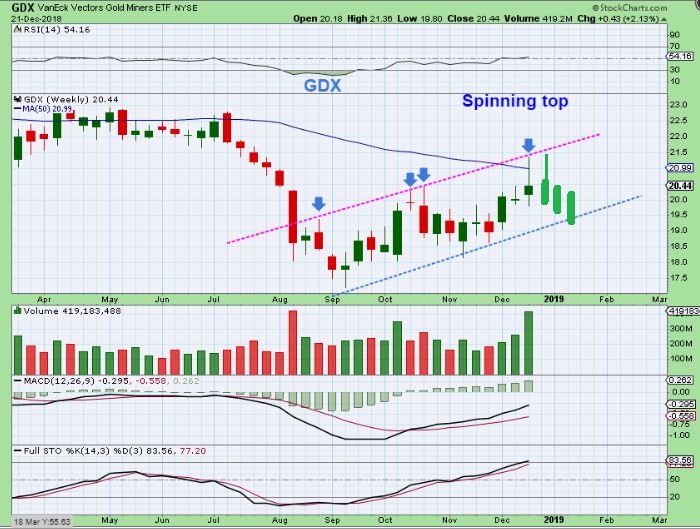
So do not be surprised if…. a light volume holiday shortened week of trading can push GDX higher next week. It may look like this, adding another topping candle. In cycle counts for next week, we would be on days 26, 27, 28, 29 next week. I still expect the drop sooner than later.
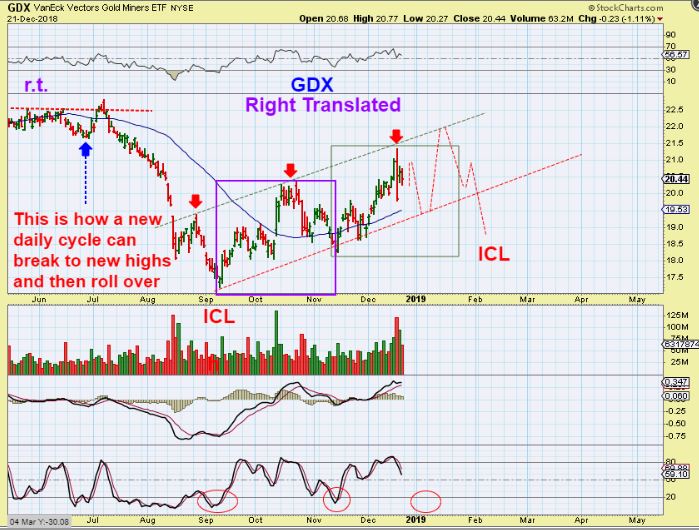
GDX – Like Gold, Since this was a R.T. 3rd Daily Cycle, we would usually expect another higher high on the next one. That can be simply a day 5 peak after the next DCL, and then that becomes a L.T. Daily rolling over. It’s a bit complex, but these are choppy markets. I will discuss that further later.
I found something with the MINERS that I would consider very Bullish and important to look at, but I want the short term view shown here to sink in first. Some people apparently have trouble digesting more than 1 idea at a time, I was told that in the comments the other day 🙂 – so we’ll let this short term pull back idea set in first. Mondays 1/2 day of trading will not change anything in either view, so I will present the Bullish Big Picture idea in the next report.
.
We only have a 1/2 day of trading Monday morning and Markets are closed Tuesday. It really should be light holiday trading Monday, because most of the big traders take the holiday week off. Since we only have 1/2 day of light trading Monday, I am not planning a big report for Wednesday, so that is when I will post what I have been looking at on the very bullish side for Miners longer term. Nothing that I say in that report changes what I see currently or Visa versa. I am still expecting a short term pullback to a dcl & Icl , but the bigger picture would be more bullish.
.
Enjoy your weekend and Mondays trading, my next report will be out before Wednesday morning trading!
.
~ALEX
.
Sidepoints:
.
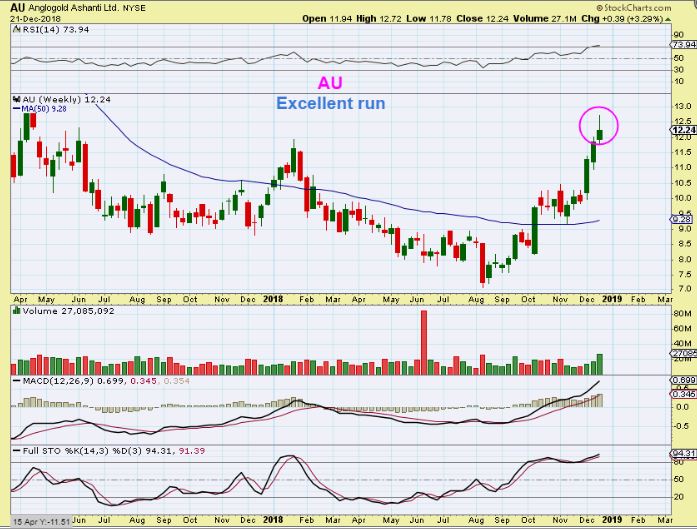
AU WEEKLY- Even one of the best runners has put in a spinning top candle. A pull back to $10 or so is possible, and will be a nice buying opportunity! Stay Tuned!
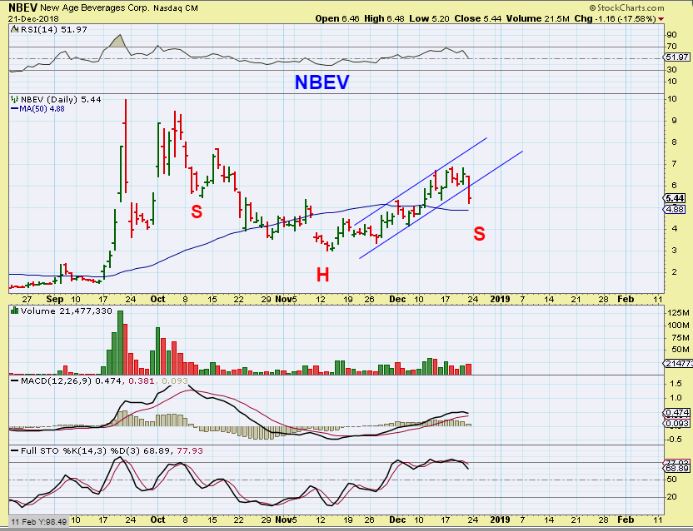
NBEV – I got stopped out of NBEV, because I tightened my stop (Maybe too tight). I saw how far WTER dropped, and didnt want to give the gains in NBEV back, it was my biggest position. I bought near $4 and again on the way to $5. It think it may just tag the 50 sma as a back test, and form an inverse H&S near $5. I will be looking to get back in if I see a reversal near the 50 sma, and my stop can be under that area. The chart, at this point, is still fine, but it is overbought.