November 21st – Spin The Wheel
Well, it started to get choppy, messy, and frustrating in the markets heading into the end of this 2018 year. We had a big drop in October that by now has erased most of 2018 gains for the Buy & Hold crowd. A while ago, I mentioned how trading in this environment can be frustrating, and that at times it is best to sit on the sidelines and wait until things settle down a bit and things start to gain a purposeful direction. I even said that under these conditions, even the good looking set ups can fall apart. Well, I thought that some areas may have settled down a bit, but I am finding the above thoughts about ‘good set ups falling apart’ to be true in my own personal trading lately. You still need to get in & get out quickly to keep your gains, or you risk giving them back.
I have seen some excellent set ups in Shippers, Uranium stocks, Tech, Medical Marijuana, Solar, Biotech, etc. Some of these good looking set ups are falling apart. I’d like to update you on my recent personal trading performance, and here is a clue…
Did you see that opening picture? That’s called “Spinning Your Wheels”. Basically when you are spinning your wheels in the markets, it means that the action may be very fast, but you’re essentially going no where.
.
Most know that recently have been trading positions in JNUG, UWT, NUGT, DGAZ , SOXL, etc, All were good looking set ups, and all created gains….AT FIRST. Some have faded quickly and the results are in…
.
– I Made money, lost money , made money, lost money, made money , lost Money in something else. I really do hate the choppy markets, because even though you are trading positions that may be gaining from the start, you end up giving those gains back & stopping out if you don’t sell the pop. Today I currently only have JNUG for a 3x etf as an open position. I am basically right where I started when I took all of those other positions. Needless to say, OIL was my biggest surprise, this late in a daily cycle and I stopped out of that today too ( I actually sold it accidentally, but I’m glad I did).
.
Will current set ups in Precious Metals break out or break down? Will those general markets chop around near these lows, or sell off sharply? Lets discuss these markets, that I unaffectionately now call…’Spinning The Wheel’.

.
NASDAQ YESTERDAY – I mentioned that I took a short position, due to this set up. I honestly see this as a day 7 peak, because that is a dcl that regained the 8 ema and turned it higher. This would be very left translated.
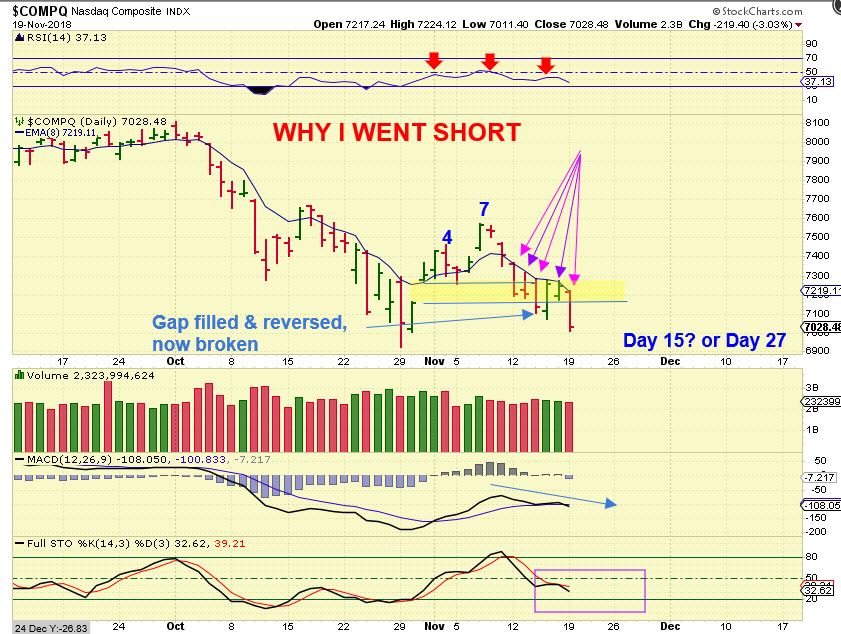
NASDAQ – The Markets had follow through on the downside, and Nasdaq actually broke the lows on day 16, a failed daily cycle with maybe 16 more days to go? That means that this could work its way lower for a while…
Work its way lower similar to what I posted here in yesterdays chart
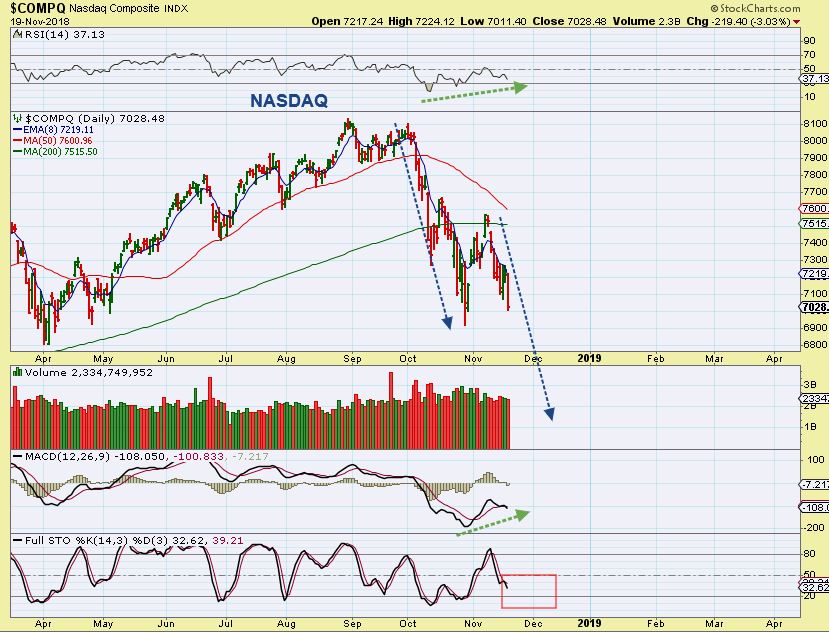
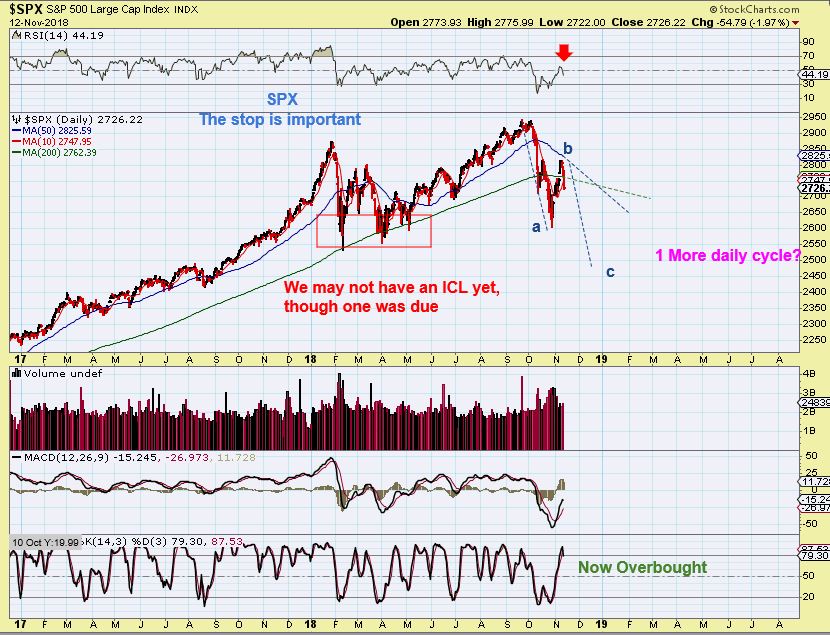
And this SPX Chart from a week ago – I was showing one more ugly daily cycle, which did fail on the NASDAQ.
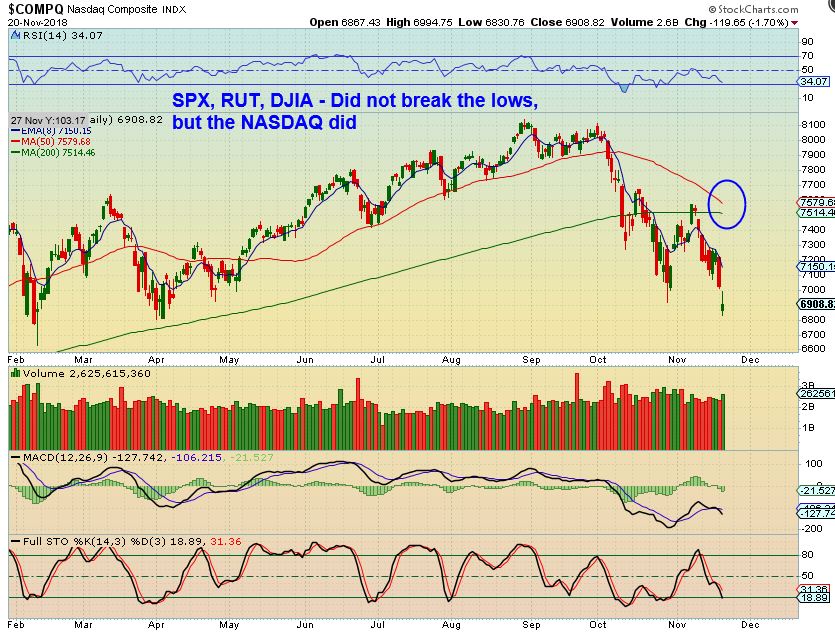
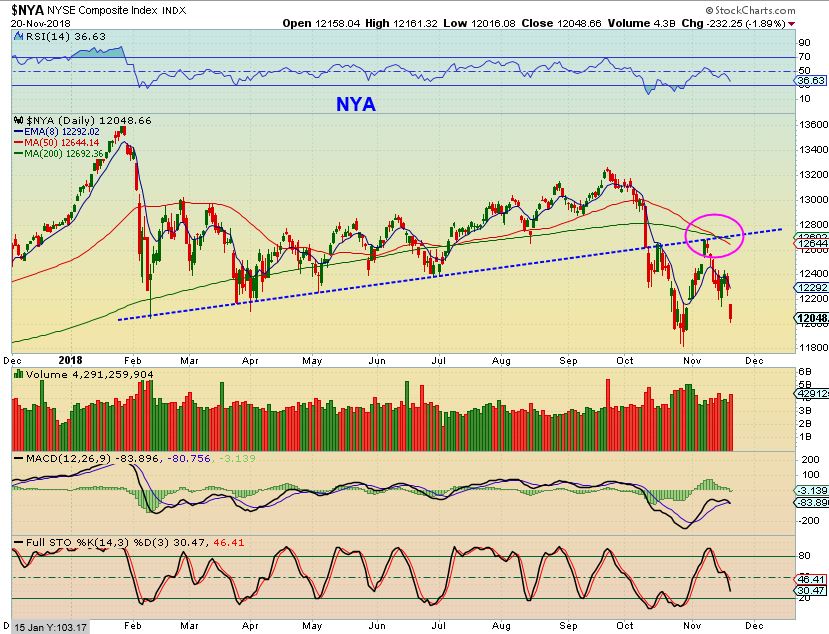
NYA – The NYSE gives us a good look at where things stand. These markets do not look healthy longer term at this point, and this daily cycle has more time to drop.
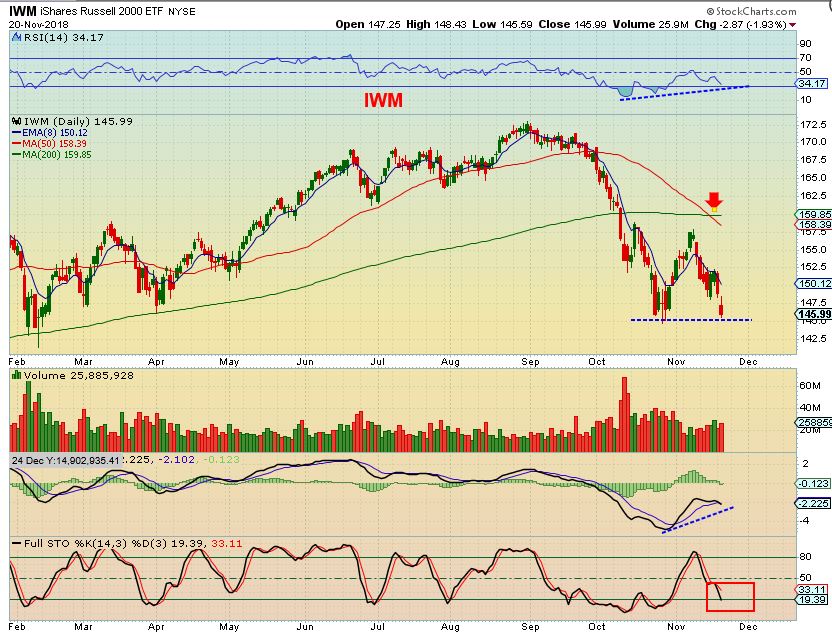
IWM – There is divergence at these lows, but I wouldn’t try going long. In fact, there really is no safe trade that I can recommend here in the middle of the move, unless you trade risky set ups. 1. This could now break the lows, recover & trade choppy, or 2. It could bounce right now & then drop, or 3. It could drop Wednesday & Friday. So for most it is best to wait& see if it holds up on what would normally be a light volume Wednesday before a holiday in the US. Personally I may re-short the general markets, but I cannot recommend it as a safe or easy trade.
MARKET NOTE: The break down in the NASDAQ rather early in a daily cycle is a warning sign. The SPX, RUT, NYS, etc could easily follow.
.
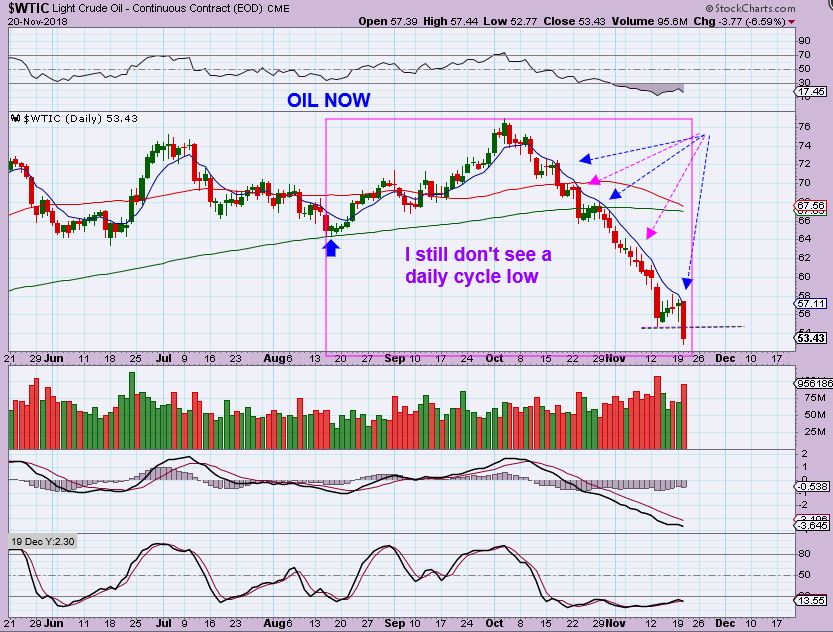
WTIC#1 – Oil still has not broken above the 8 ema or 10 sma to clearly signal a dcl. I think that makes this extreme at day 69? This M-I-G-H-T just be a final shake out. I was long with the capitulation low and it took me out Tuesday. It is very oversold, so I wanted to look back and see if this is abnormal…
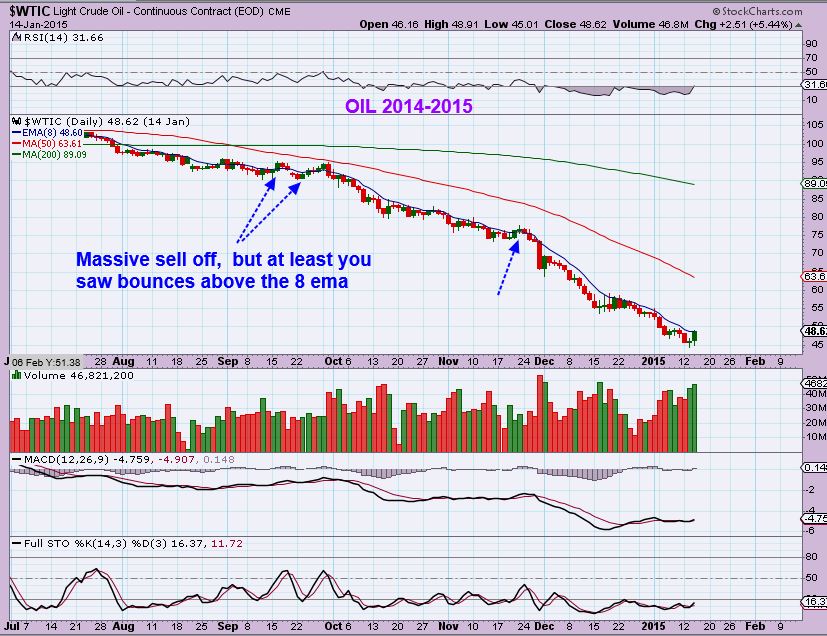
WTIC #2 – Look at 2015 & see how long it stayed oversold. At least I see bounces that broke above the moving averages, but this too was also a relentless sell off as it dropped from $100 to $45. I certainly wasn’t expecting something like this now, but you see that it can happen. And…
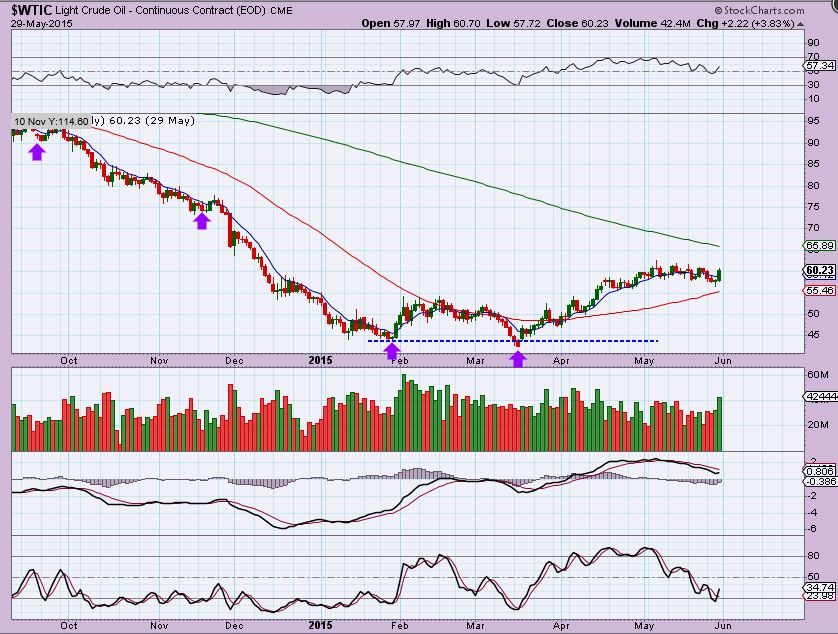
WTIC #3 – This is how it eventually ended. A solid daily cycle low, a short daily cycle at 31 days, and a rally. Then I found…
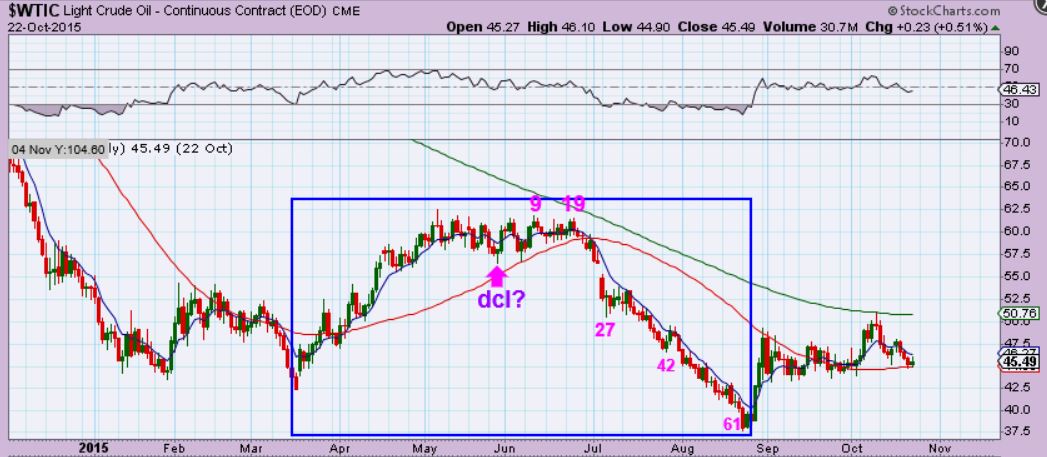
WTIC #4 – I found the daily cycles that followed also had a 61 day drop. This 61 day drop was steep, also didn’t break the 8 Ema on bounces, and looks similar to what we see now in Oil. I just wanted to see if this relentless 60+ day sell off has happened in the past, and it really has.
I often say that ‘Waiting for a confirmed swing low is best’, so I wanted to prove it to you by jumping in early and getting stopped out. 🙂 My bad.
.
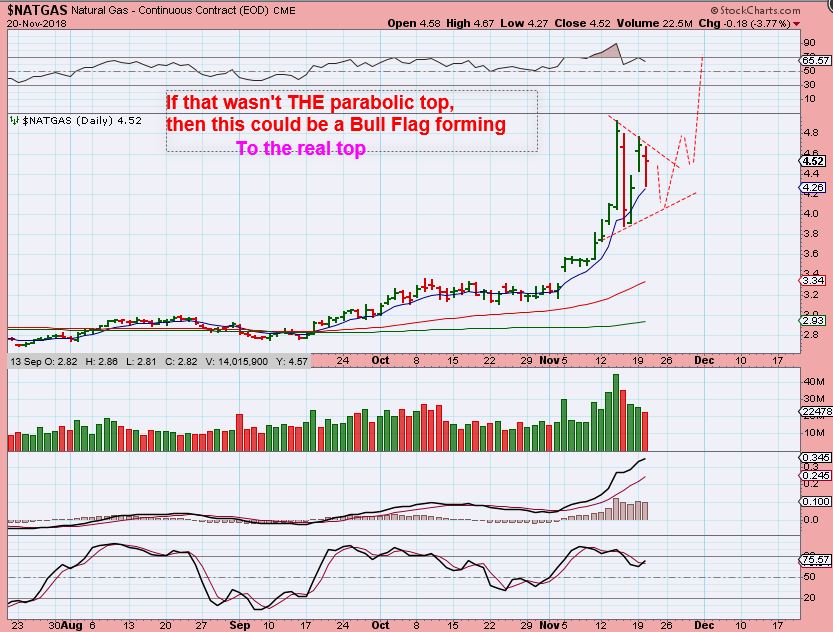
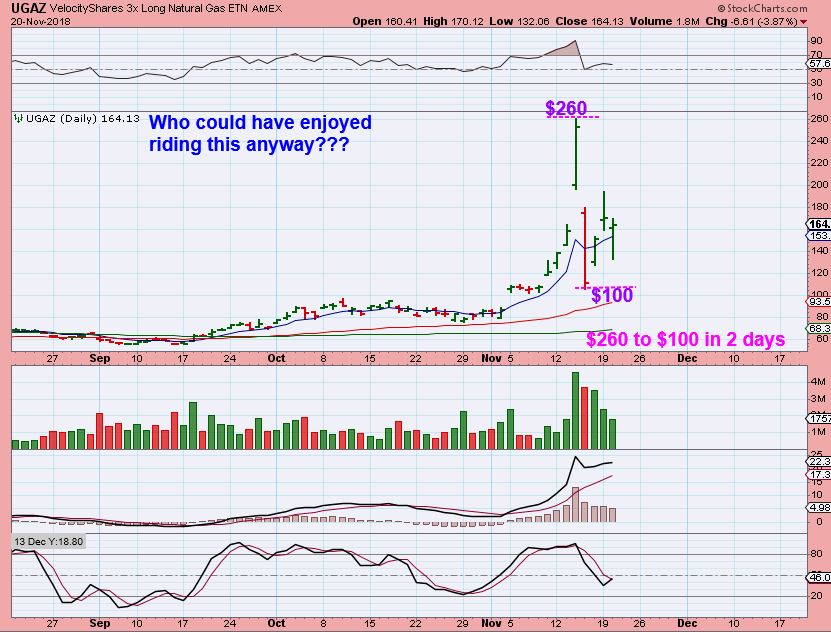
NATGAS – And NATGAS, with what looked like a parabolic run, is now consolidating. That means that it could form a bull flag and burst even higher. Suddenly these are extreme markets in almost all sectors (except for Gold, right?) The one that we wish would go parabolic.
UGAZ – You would NOT have wanted to try to ride a 3x etf in this kind of crazy action. It dropped from $260 to $100, and is now $164. I certainly have no safe trade to offer here.
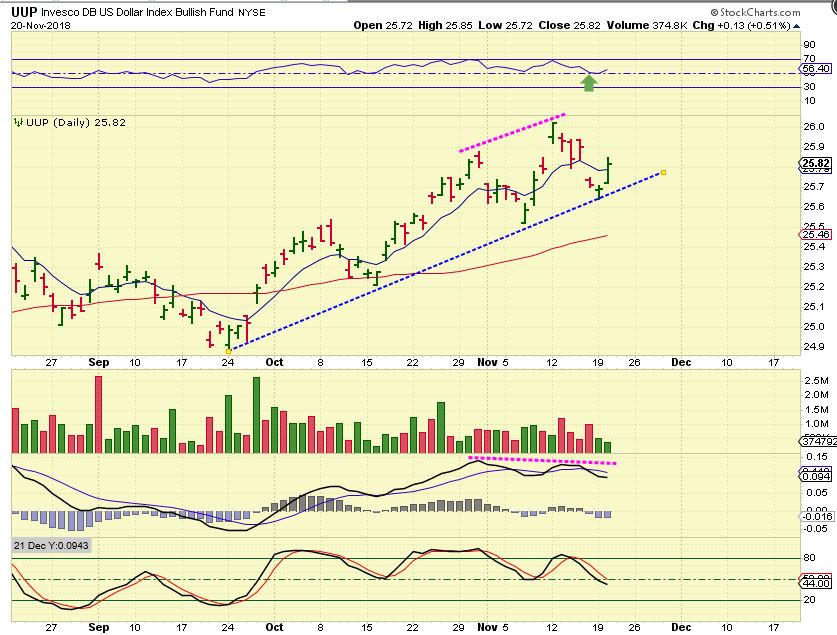
UUP – The USD is still trending higher, but we do see divergence at the new highs.
.
At one point, I was hoping that a weak stock market would cause a safe haven rush to the Precious Metals, but so far this still seems to follow the USD to a degree.
.
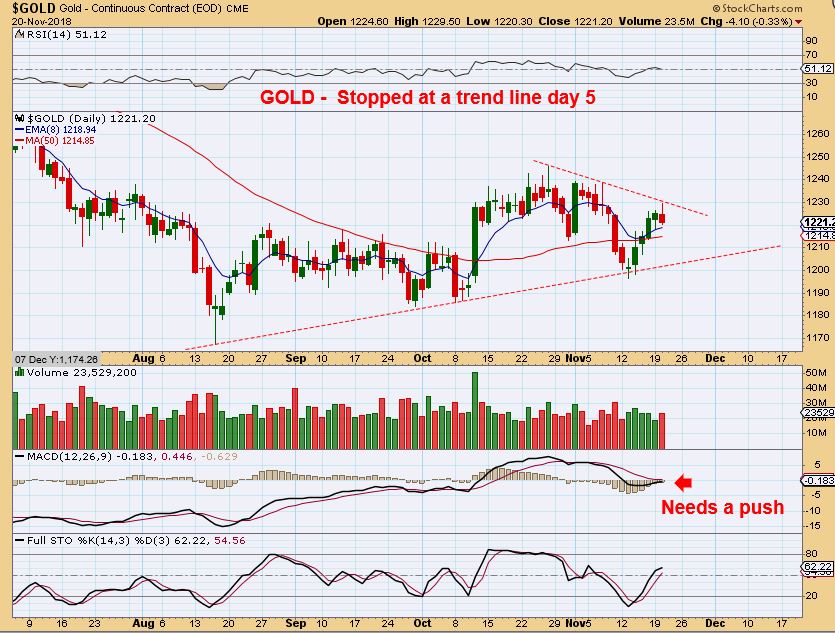
GOLD – Gold tagged an overhead trend line and was held back at this point on day 5. It did not rally as stocks crashed down, but it did not drop a lot as the USD moved higher. As a 3rd daily cycle, we need to see this break higher sooner than later, but it could drop to the 50sma first.
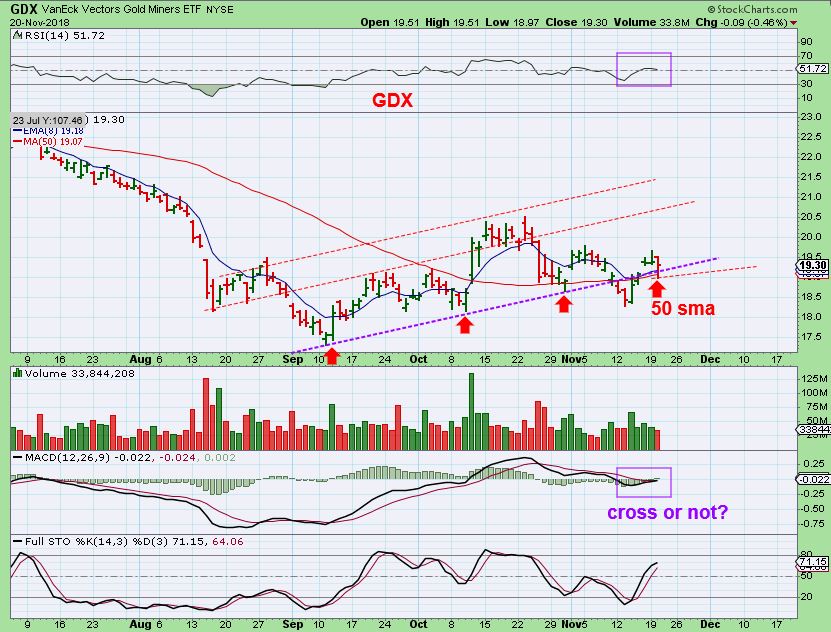
GDX #1 – GDX dropped right to the 50 sma and a trend line & thankfully bounced nicely. That is encouraging at this point.
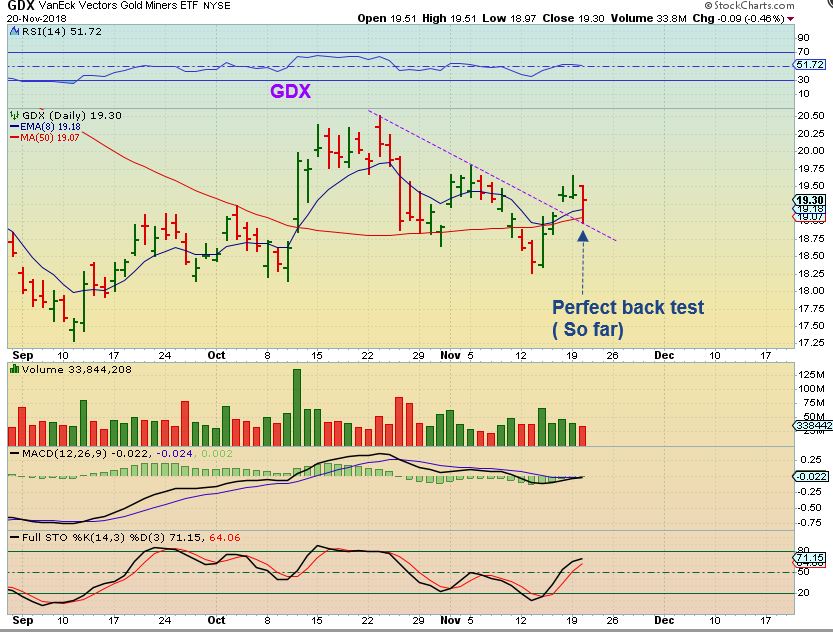
GDX #2 – Stepping back, it looks like the dcl 5 days ago was a ‘shake out’ and the tag of the 50 sma was bullish so far. This is very good action at this point, as long as we keep remembering that even good set ups can break down and you need a stop under the dcl, Nov 13 lows. Even a close under the 50 sma is a warning & could be used as a stop.
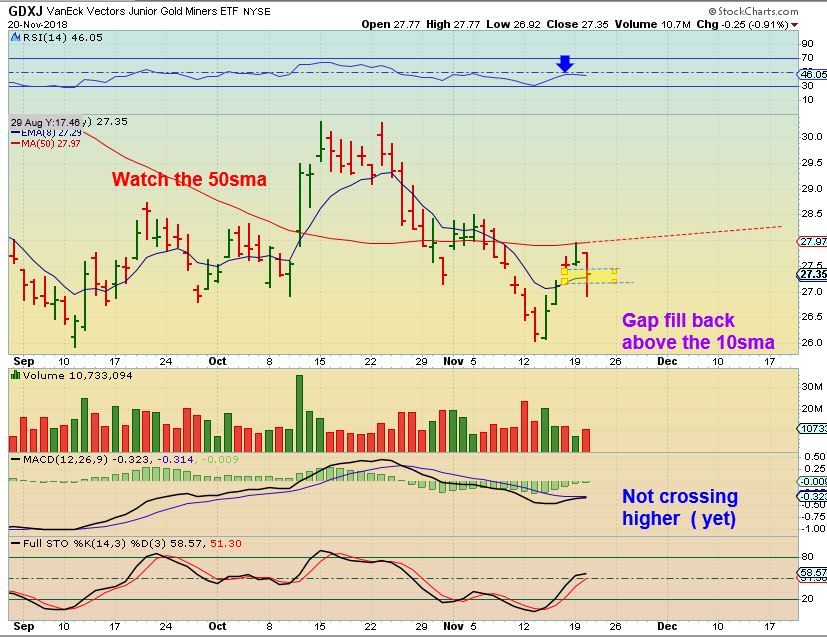
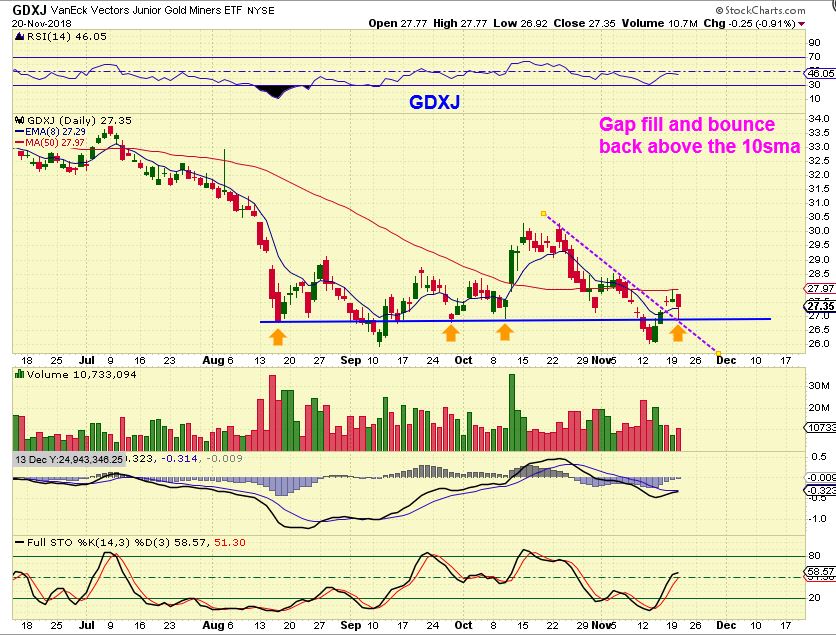
GDXJ – GDXJ dropped deeper than the gap & 8 EMA, but it also recovered (so far). The MACD is weakish, so I am hoping for a break out above the 50 sma soon. And stepping back…
GDXJ – We actually bounced off of a lower trend line and also the recent down trend, so GDXJ is acting correctly so far. GDXJ has 2 shake out type drops that recovered. So far, so good.
.
We are on the final full day of trading in the US Markets, with The markets closed on Thursday, and Friday being only a 1/2 day of trading. Usually this day becomes very light in volume, especially as the day goes on, with people traveling to family destinations. This has been a somewhat hyperactive time period, so we’ll see if the markets calm down a bit as the rest of this week plays out.
.
If you are traveling to be with family, may your travels be safe and your family time be refreshing!
Enjoy your Wednesday trading and your Time off Thursday!
.
~ALEX
.
Sidenote: I had a few Energy stocks in yesterdays report, to watch for break out if oil bottoms. Many are not breaking down with oil, which makes me wonder if this was just a final Shake out low in Oil.
This is the ERX ( and the same happened with the XLE) Tuesday- It did not sell off & break down to new lows with Oil.
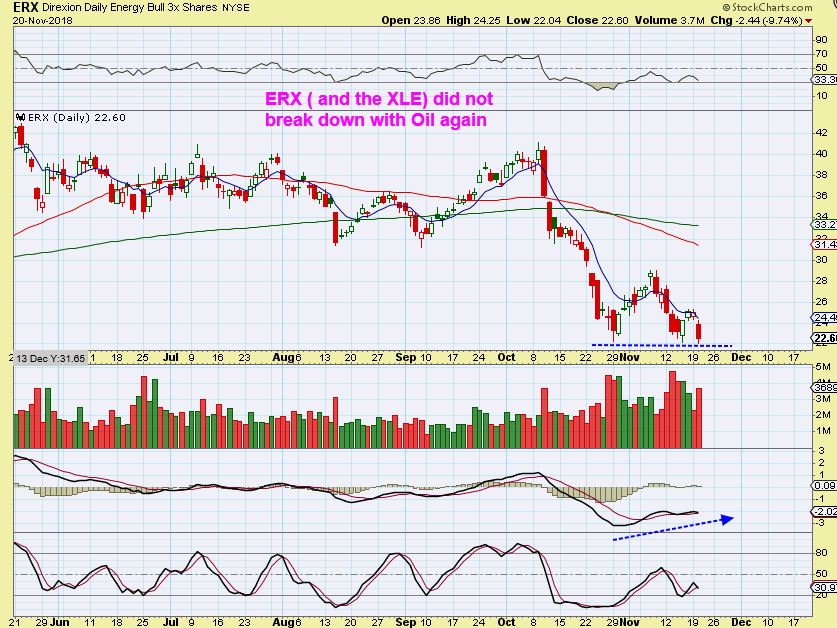
So the Energy Stocks that I pointed as well as others on my watch list, also held up above their lows with Oil breaking down $4.
.
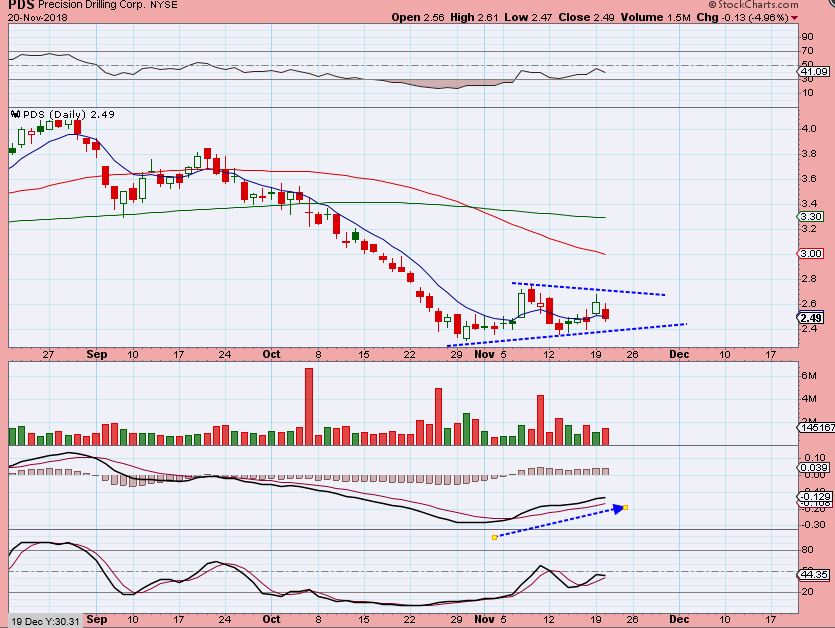
For example: PDS was pointed out as a double bottom low, did it break down with Oil?
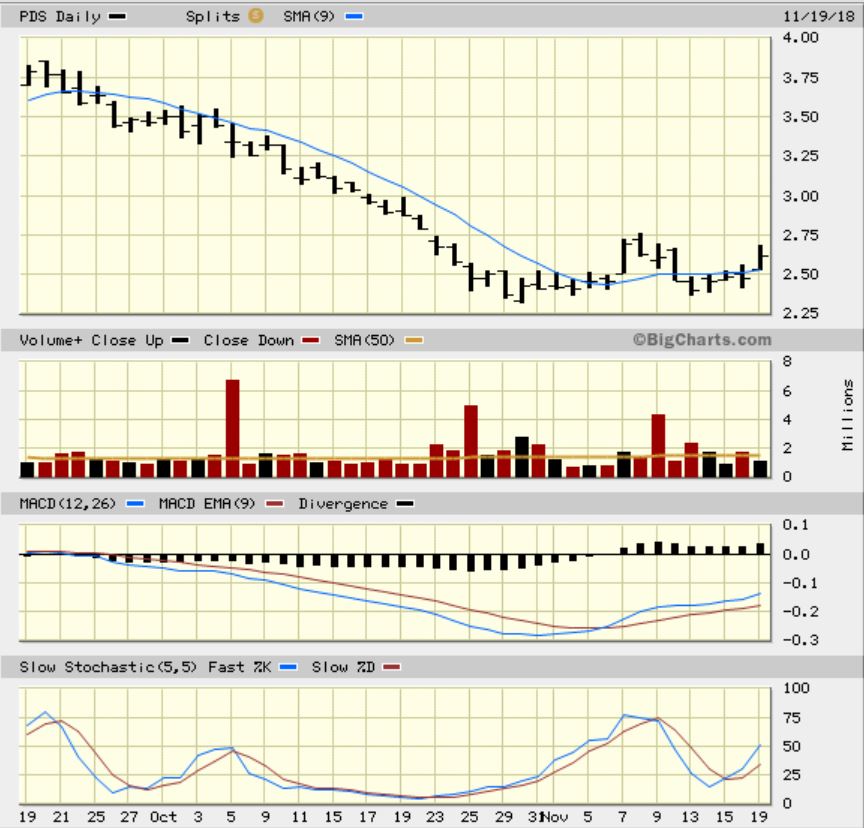
PDS did not break down…
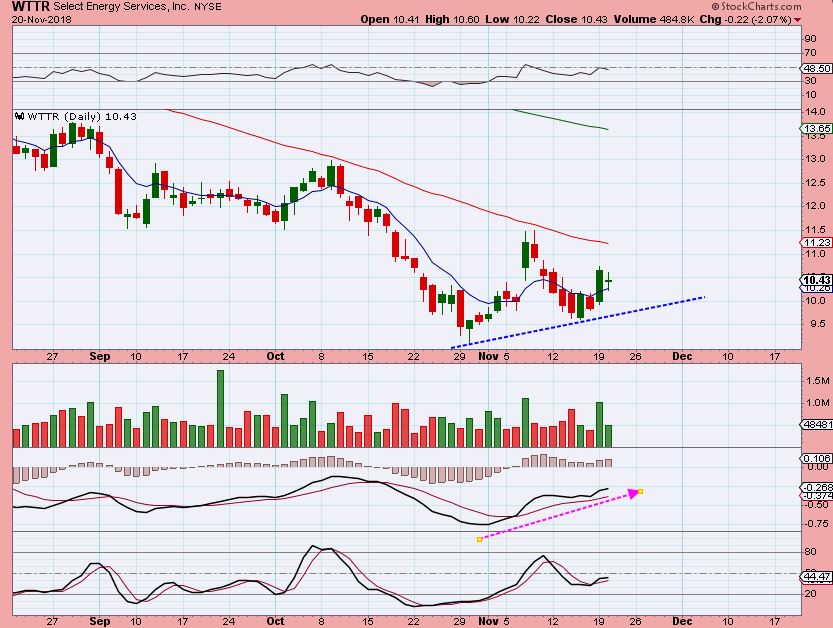
WTTR – Monday this was also a double bottom low with a POP…
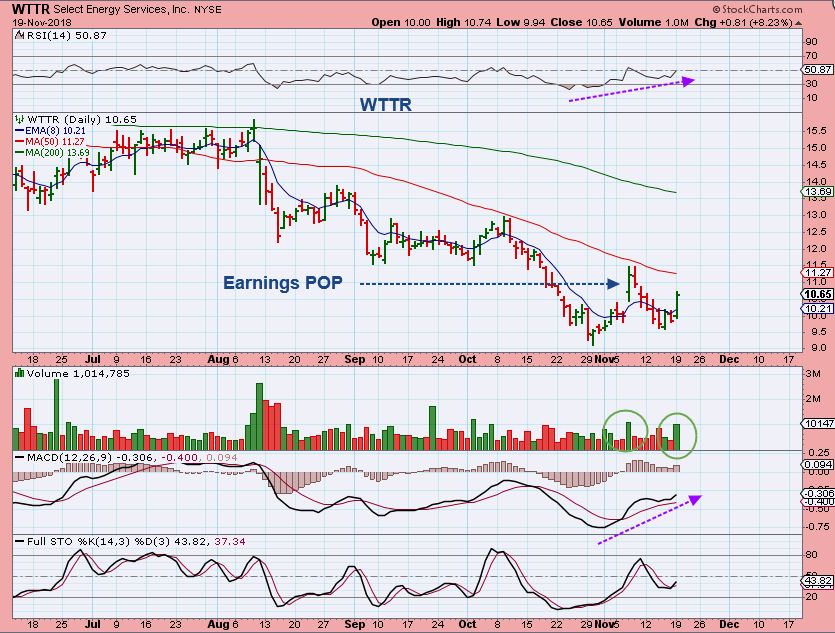
WTTR – Tuesday after Oils massive sell off, it is still above the 10 sma, so Energy still seems to be something to keep an eye on.