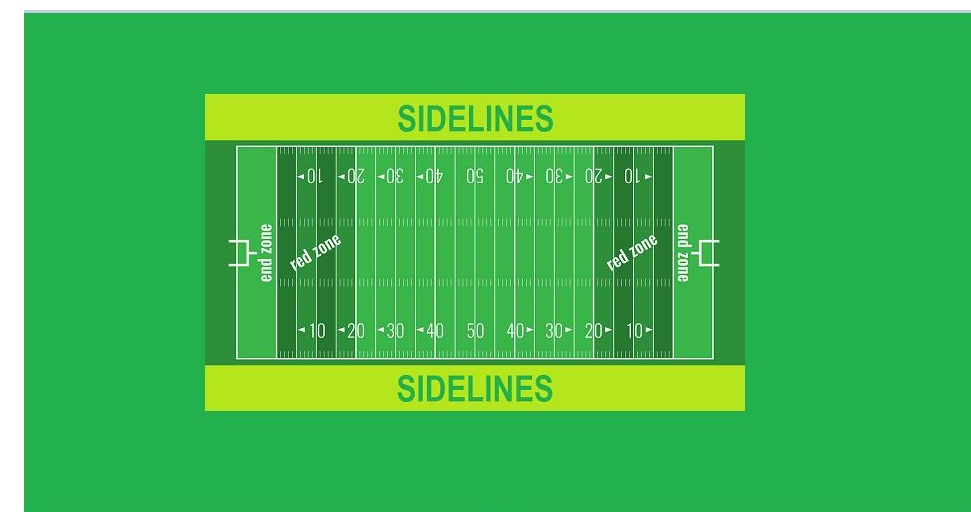
11-13-18 / Choppy Trading – You Can Also Sit On The Sidelines
The Stock Market involves real money, so it’s by no means considered just a ‘game’, but similar to many games, we have a few choices when we take a position(s). If, over time, we find that things are getting a little rough ( the markets may get choppy for example, or players may get banged up), we still have choices.
3 basic choices are:
1. We can exit the playing field (sell) and head for the sidelines to avoid all of the choppiness.
2. We can stay in the play until we get ‘stopped out’ or are rewarded with a move higher
3. Just wait on the sidelines and see how the game plays out for a bit as a spectator, and look for a better time to enter
.
Sometimes in choppy markets, even Good set ups can pop & then simply fall apart.
.
The current conditions in many areas of the markets are choppy, from The Nasdaq, to Oil, to the precious Metals and MJ stocks. I am finding that even many good set ups are popping & then breaking down. I have traded Miners, Uranium, Shippers, Mj stocks, Biotech, Tech, etc and though I have sold some pops for gains, I have also been ‘stopped out’ of a few trades, I have just ‘stepped out’ of a few trades, and am currently watching to see how various areas play out while still holding a few positions. I am still invested ( PLG, YGYI, MRMD, etc ) but the cash count on the sidelines has been building with these choppy market conditions constantly changing.
.
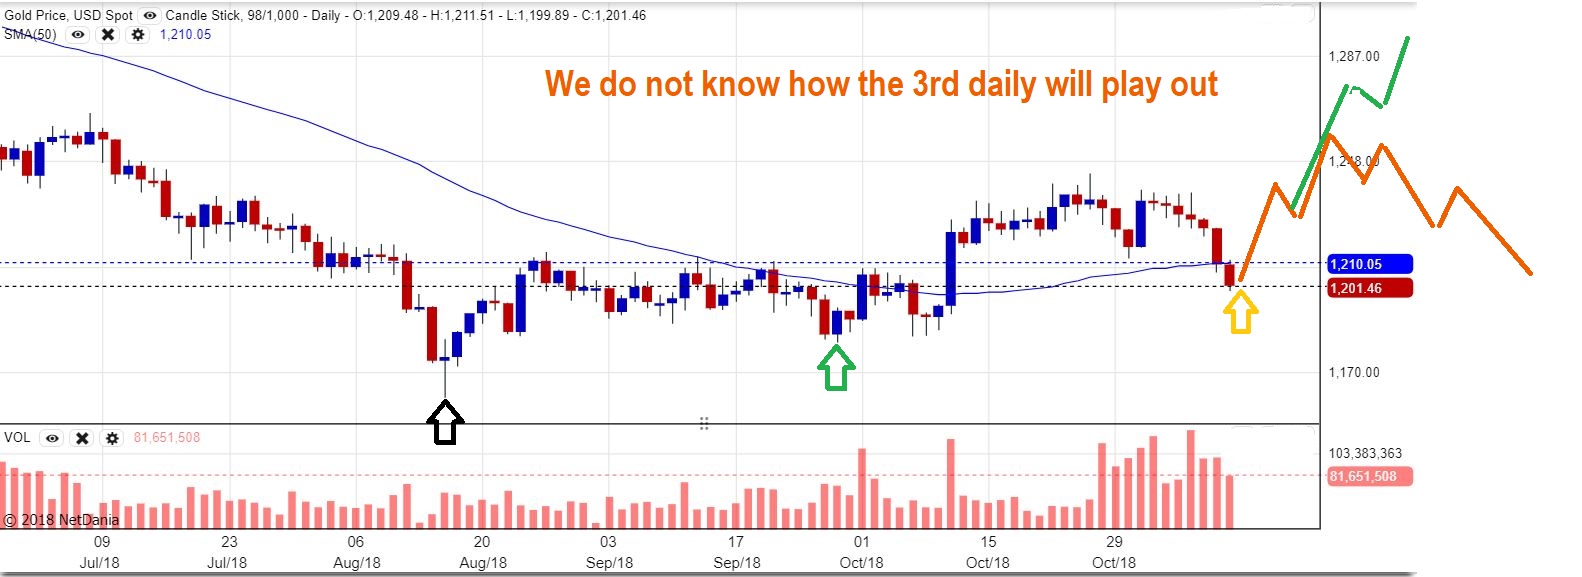
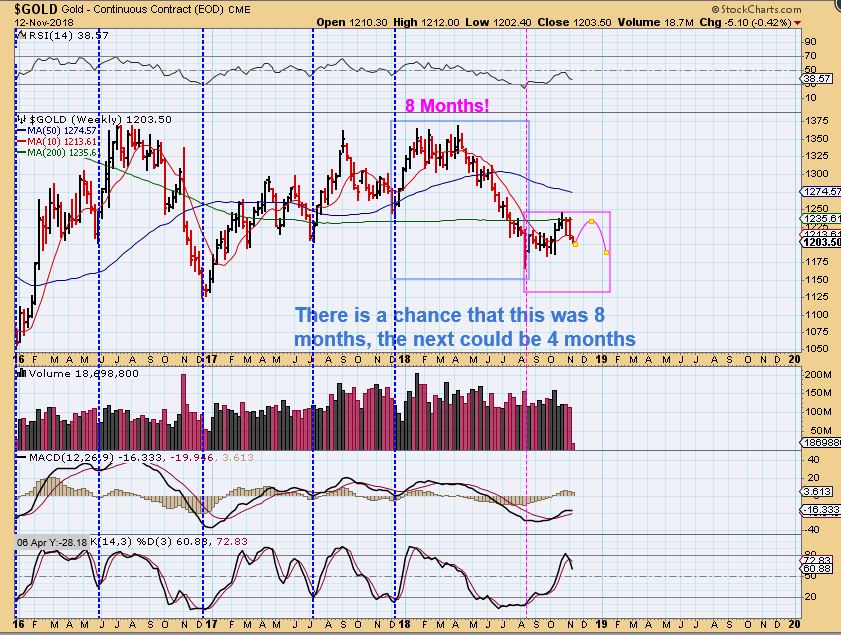
And for tonight’s report, after a short Market review, I want to discuss precious metals again. I want to review Golds Current Intermediate Cycle. This will NOT be me trying to defend a lame sideways Intermediate Cycle, but this is me trying to take us on a look back as a review and to learn something along the way. Then we can also look forward, because there will be another ICL. The danger is that if we start to believe that “All these ICLs are choppy, short lived, and therefore lame, why try?” We will be caught flat footed when the next real ramp up arrives. Plus, as you will see, that kind of talk is simply not true. I will discuss this further after a few important charts.
SPX #1 – This looked like an ICL, so it could be bought WITH A STOP. That stop could even be raised as it moved higher, like at the 200 sma. If so- you are stopped out with small gains already. This has been choppy trading, but it may still be the ICL.
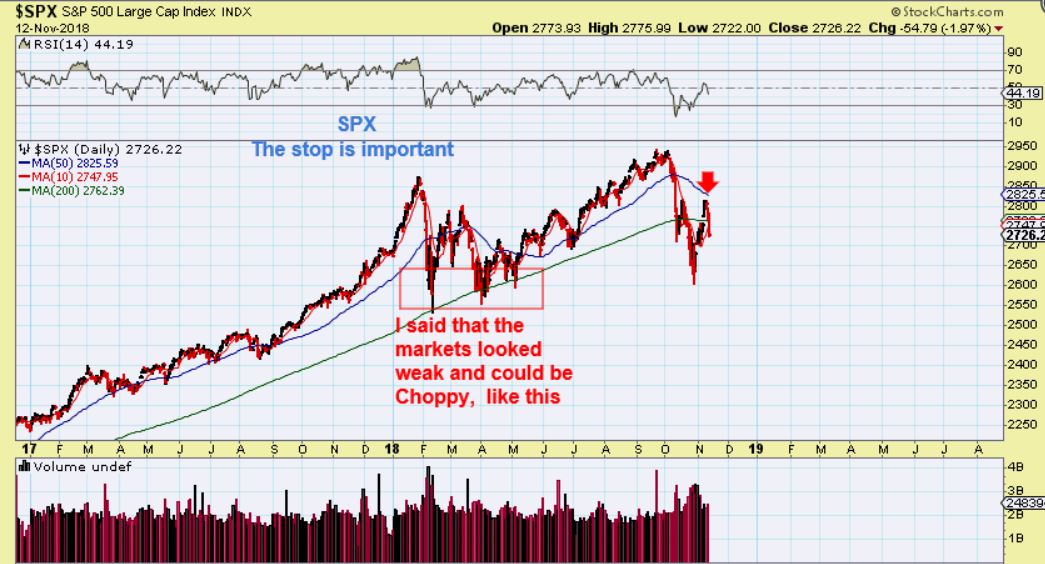
SPX NOVEMBER 8th– I thought that we could see this, and it would form an Inverse H&S. Our drop has been deeper than the 10sma, but
SPX #2 – There is a gap below too. So was that the a-b-c drop that I thought we could see? Possibly, but price broke that 200 sma Monday & the 10 sma. I also noticed this…
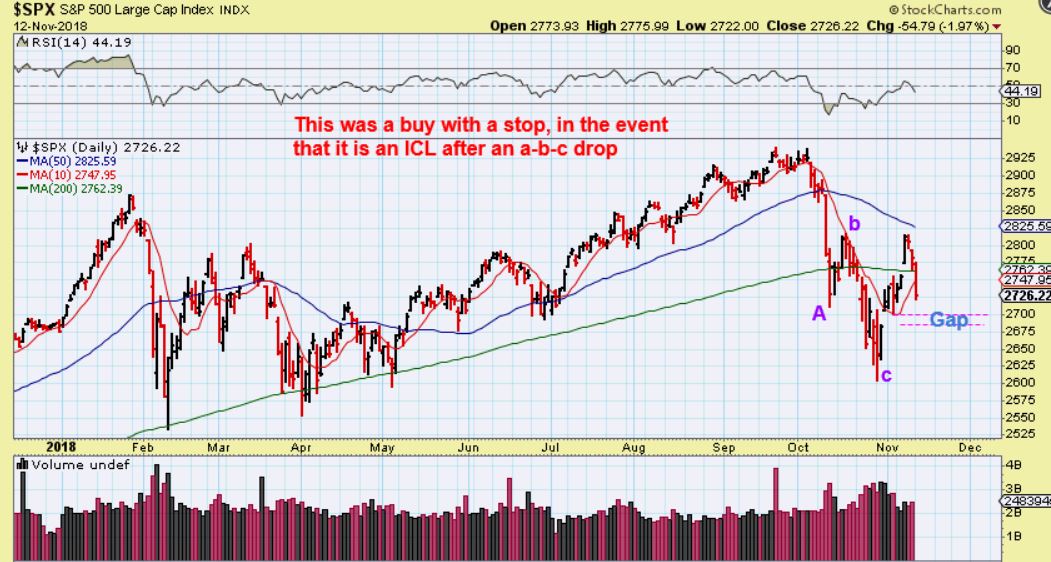
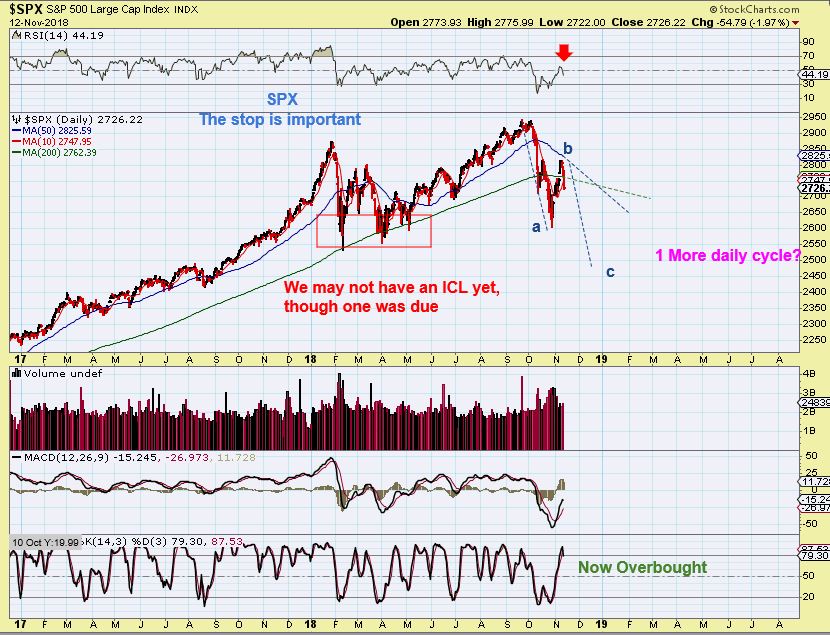
SPX #3 – Now look at this Big Picture. If that last low was not the ICL ( just use a stop), and was just another dcl, it may have peeked and this bigger a-b-c could lead to the real ICL. Use stops, this got overbought rather fast, but at this point I am thinking that this low holds for now as the ICL.
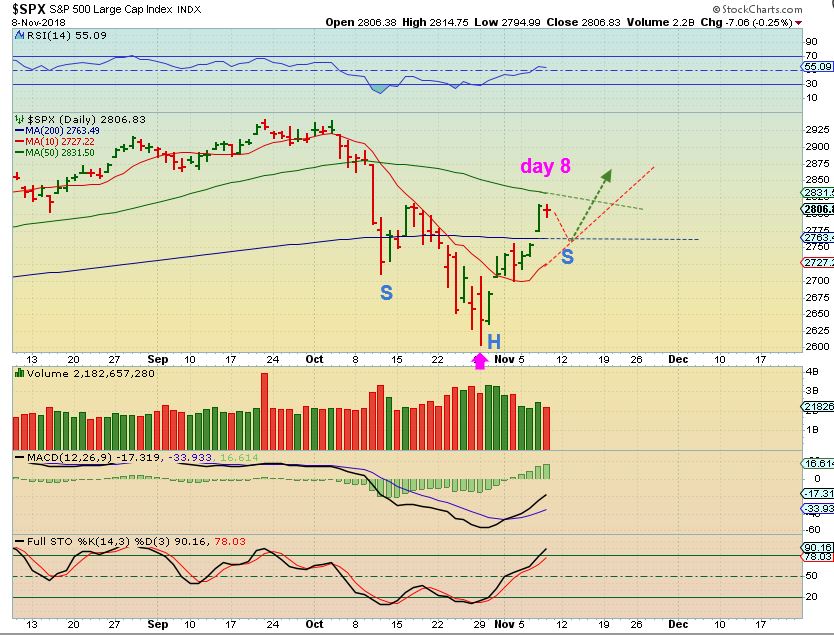
I mentioned that I have not taken a trade in the General Markets
.
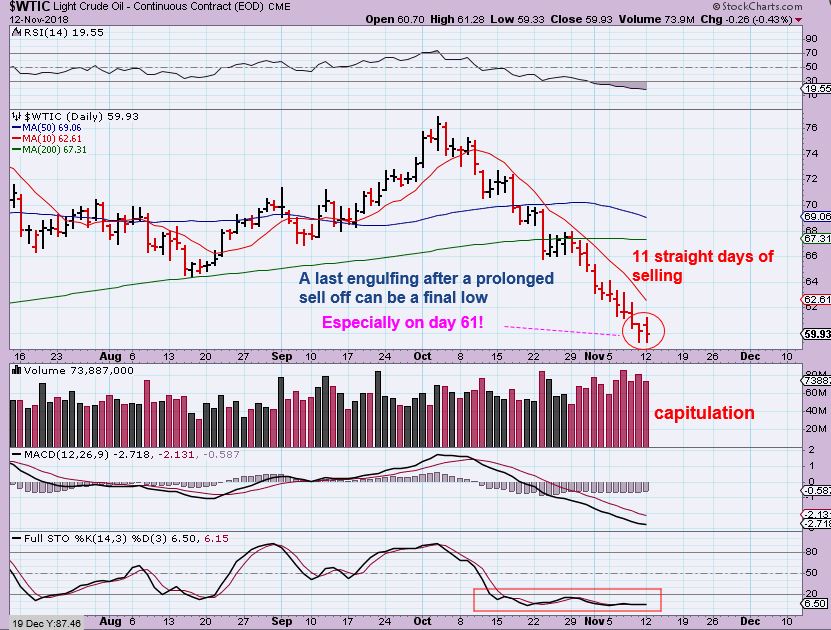
WTIC – I jumped ahead of a proper swing low and bought a SMALL STARTER position in UWT, because this is a last engulfing on the end of an 11 day sell off. This is not a proper buy, since waiting for the swing low to be confirmed above the 10 sma is recommended. For that reason, I started small. This is very oversold, but it really may take Wednesdays inventory report to get this going.
.
PRECIOUS METALS – WHAT HAPPENED? MEMORY REFRESHER!
.
When the ICL is in place, it is the best low risk entry for a trade, hands down, period. Those lows should not be broken for weeks, so it is at least a safe entry. From there all you can do is take a position, Place a STOP, and hope that it plays out as expected. This ICL in Gold & Miners was accompanied by an Extremely Bullish COT, Extremely bearish Sentiment, A few Miners leading the way ( $BPGDM) , etc – so it looked more promising than ever. As time moved forward, I said many times that I expected a strong rally with that set up. Time would tell.
Let’s review a few of our days within this Intermediate Cycle. I get the feeling that some forget what happened during this intermediate cycle already, based on my being told that no one could have nade money in the sector, and cash was the only position, etc . This will refresh your memory, and we can all learn from the past.
.
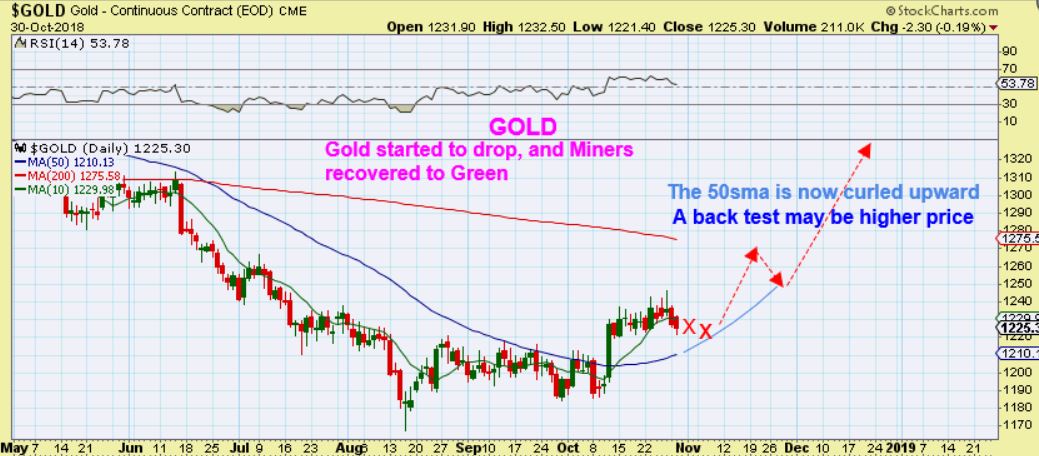
Gold bottomed in August- THIS WAS THE END OF OCTOBER: Do you think this looked Bearish 2 weeks ago? No, this was ‘new highs’ on day 20! Very nice. Boring? Possibly, but this had good potential. Was Gold still on track at the end of October? Yes. A base was building. REMEMBER – THIS was only 2 weeks ago.
OCT 30- I called for a possible back test of that 50sma. That would be normal too.
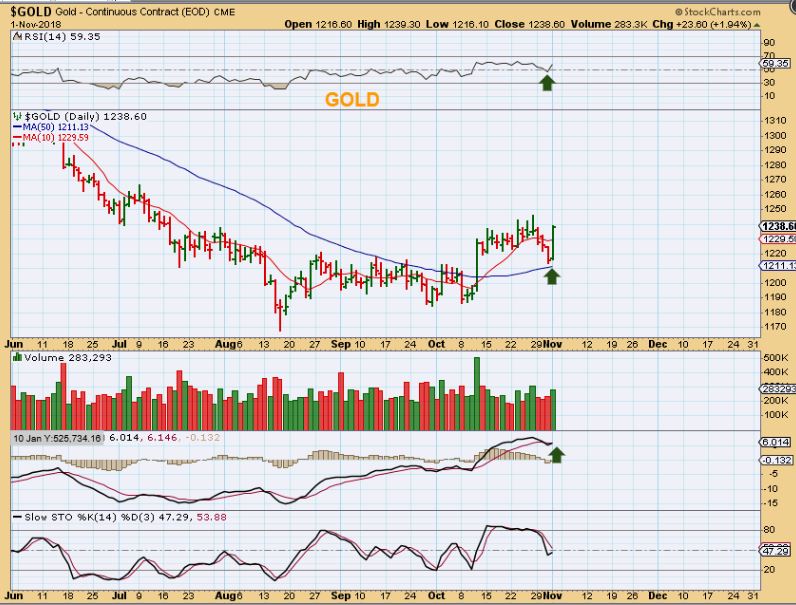
Friends, this was 8 trading days ago. This was November, and it was just last Thursday before last week. This was A POST FED POP. That looked promising, right? How did this look to you? The comments section on Nov 1 showed that many were very excited. Should I have told you to sell this pop? Would you have sold this pop if I told you to? 🙂
.
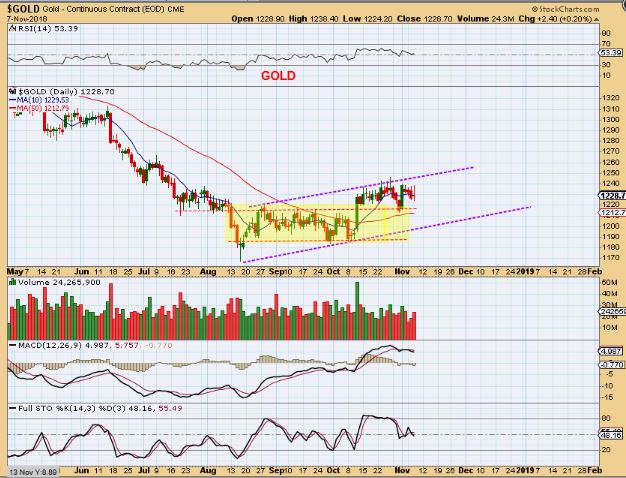
THIS NEXT CHART WAS GOLD AS OF LAST WEDNESDAY. It bounced off of the 50sma, and that is usually Bullish. Last Wednesday, GOLD was still bullish.
.
SO GOLD WAS STILL O.K. LAST WEEK – this looked to be playing out bullishly ! That MACD droop was a bit concerning, but a pop higher would do away with that. I said that I started to see some signs of concern in some Miners ( GORO, CDE, ETC) and time was moving along later for golds intermediate cycle. So as I started to see a few things of concern, I mentioned it in my Wednesday report, and said that I would discuss it in the weekend report.
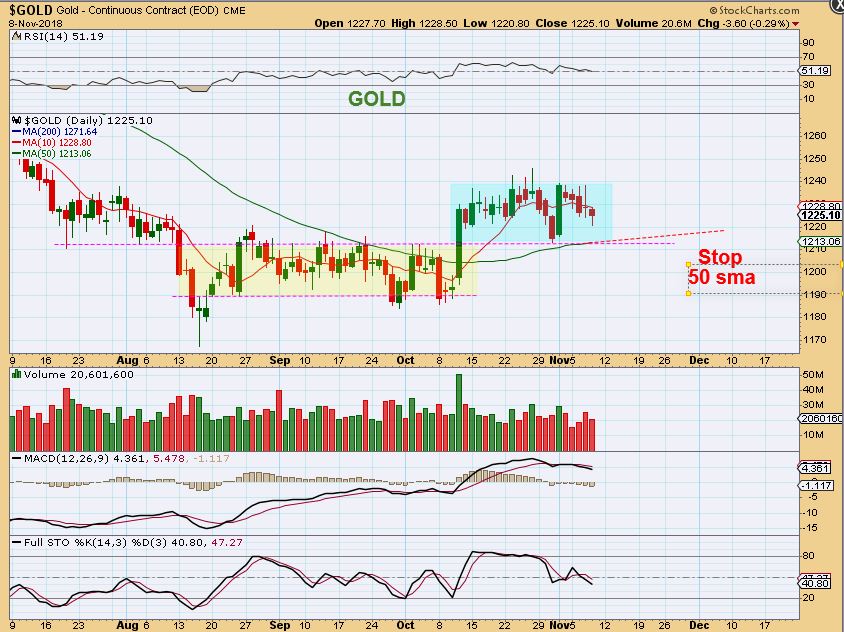
THURSDAY LAST WEEK – Even last Thursday was normal looking.I still wanted to mention in the weekend report that cycle timing was getting late though. I mentioned a stop at the 50sma. The charts still looked bullish price-wise to be honest.
In my weekend report I covered more of a ‘timing problem’ that I was seeing. The intermediate Cycle could be at the 1/2 way point. I wanted to point out that though Gold was still Bullish, and GDX was above the 50sma, but using cycles I mentioned …
” This may actually start peaking as an Intermediate Cycle soon due to the timing, and it may begin to seek out the next intermediate low over time going forward.” I mentioned that, ” We might simply see sideways choppy action, base-building type movement without the kind of a strong continuous Rally expected”. I wasn’t trying to push the panic button, but I started to feel that things may get choppy & stalling. That sideways choppy base building similar to 2015 may take place. It was more of a short term bearish warning in the weekend report, with a Bullish Big Picture view.
.
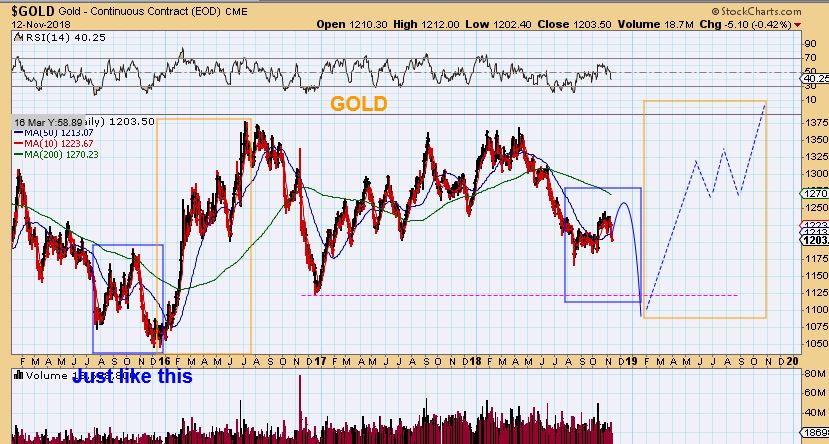
The point that I want to make here is that I still think that we are building a base in the bigger picture. If we are, a run to finish the right side of this large cup should be much better than 2016. We are in a big base building period in my opinion, but it could break higher with any intermediate cycle.
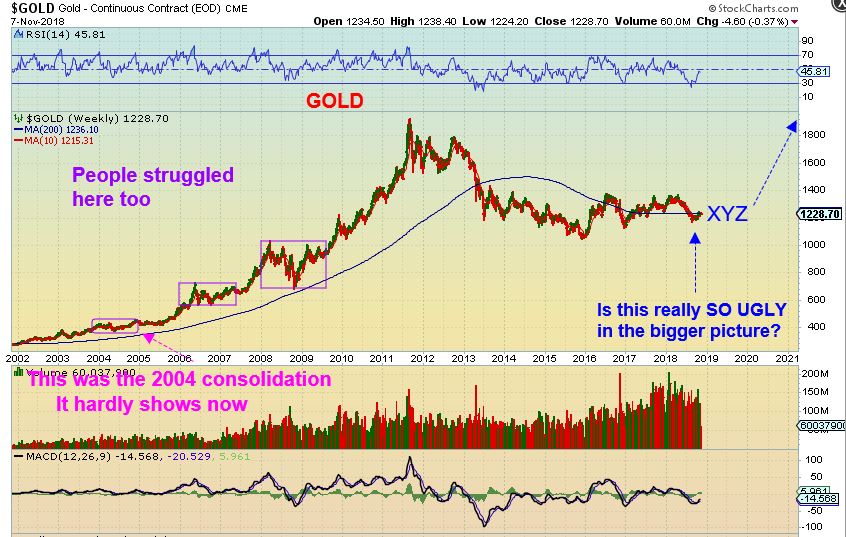
Personally, I will try to trade EVERY ICL in Precious Metals. One day one of these ICLs in this base is going to be better than 2016, in my opinion. That keeps me searching for the ICL on GOLD. And now that the General Markets seem like they may be topping, or may become choppy for 2019, and this precious metals sector could benefit from that.
.
Let’s look at Miners next…
.
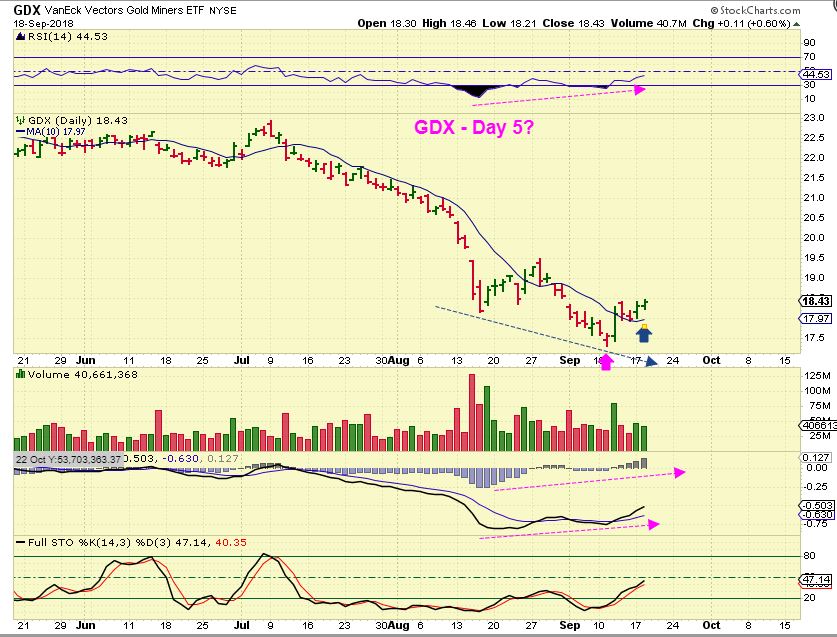
GDX Sept 12 from the report– The strong POP on Sept 12 broke the down trend line. One normal & Bullish idea to watch for was drawn here, and this is almost exactly how it played out to the back test of that 50sma. :
1. Buy with a stop (The trend line was broken),
2. Watch for a run to the 50sma, and then it may crawl.
3. Then Break out & even back test. THIS WOULD BE BULLISH. Again, That is actually what happened too.

GDX Spet 18– GDX meandered above the 10sma. JNUG was around $7 here as a buy.
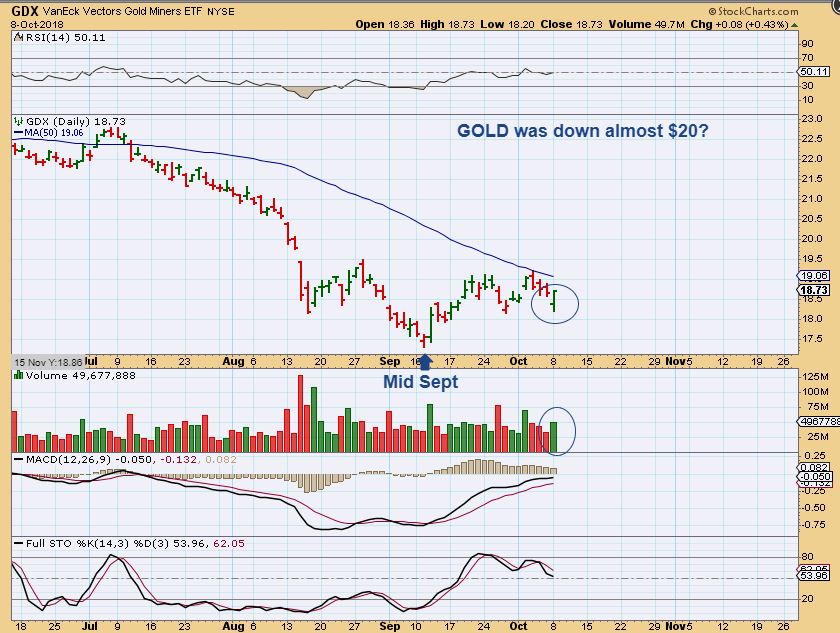
GDX OCT 8 – We got a small run higher & then a dip to form an inverse H&S. Eventually that tag of that 50 sma & that crawl happened. This was similar to what I pictured on the Sept 12 chart, so This reversal would be an additional buy.
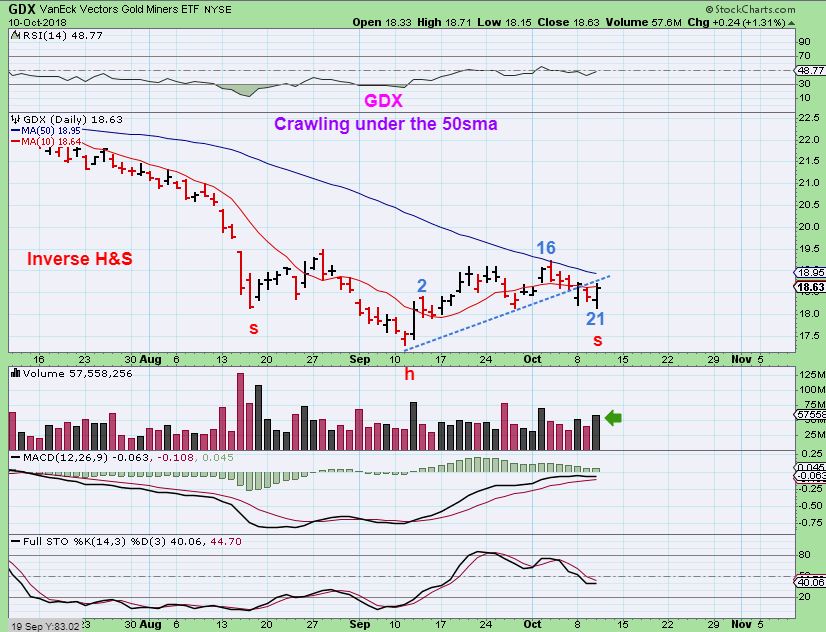
GDX OCT 10 – GDX was still crawling under the 50sma as expected, and that is normal bullish action. The bigger volume was on the Pops higher.
GDX OCT 11 – The next day we got a solid Pop above the 50 sma. This was now even more bullish. I immediately pointed out a possible back test, so that we would be mentally prepared if price does drop. We’d watch the 50 sma for support ( You could raise your stops & lock in gains if it fails, add if it holds).
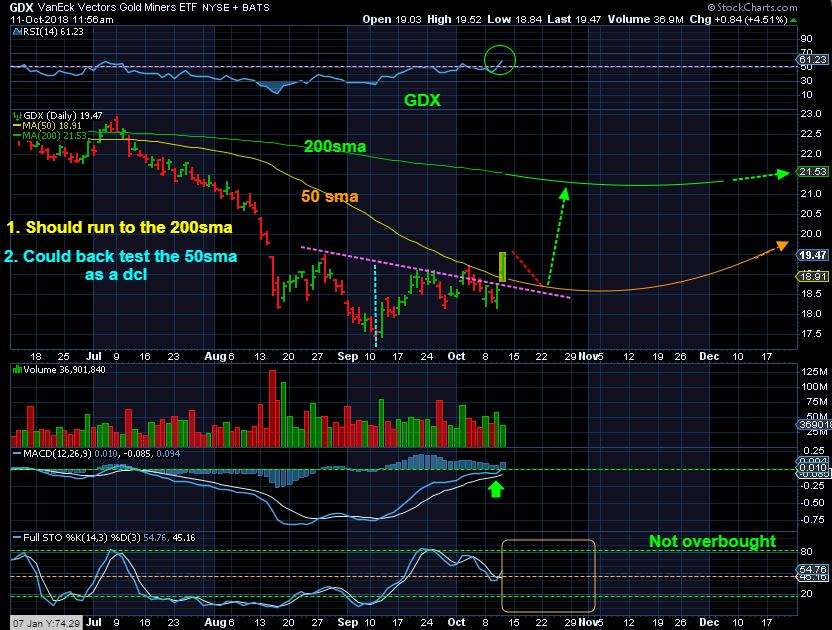
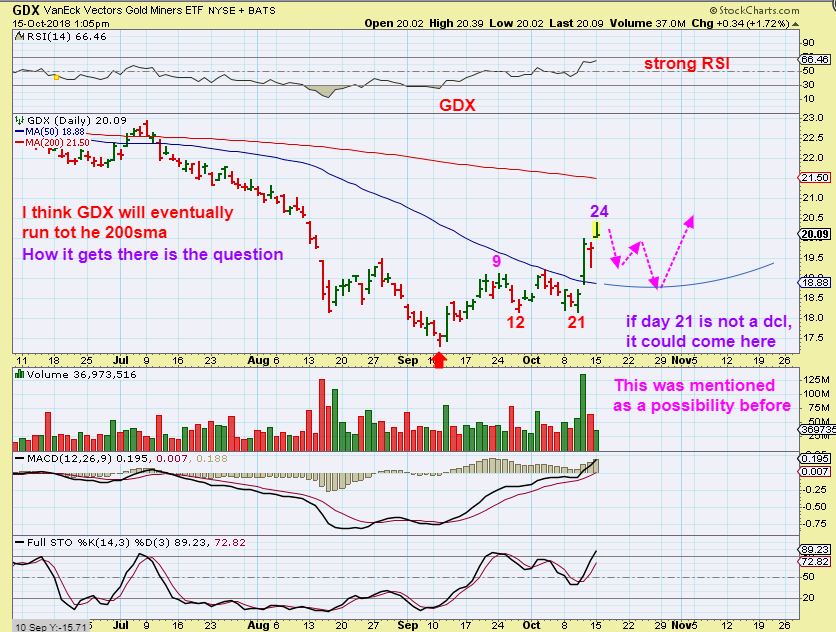
GDX OCT 15 – Already, you could have made money on this ICL if you sold these POPS, but that NOT the way I was going to play this or recommend playing it, even though I still expected the drop. The anticipated back test.
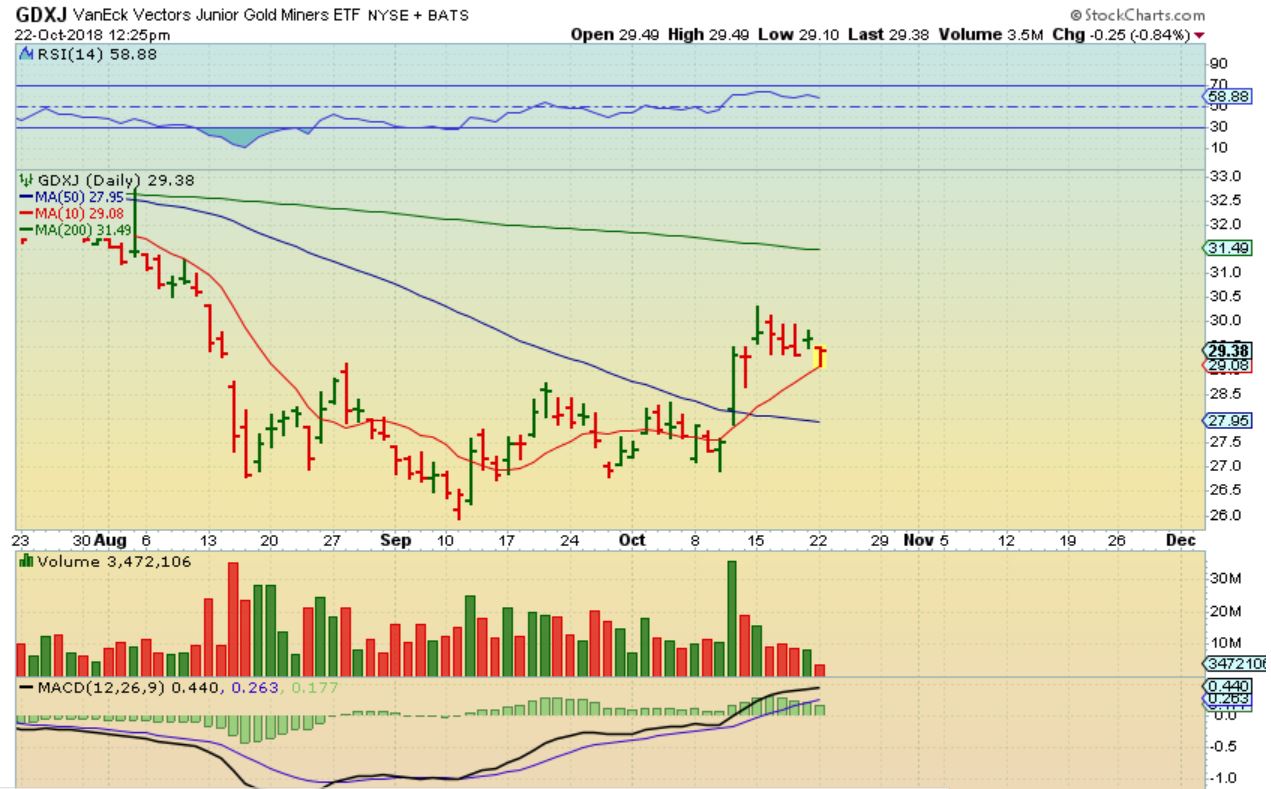
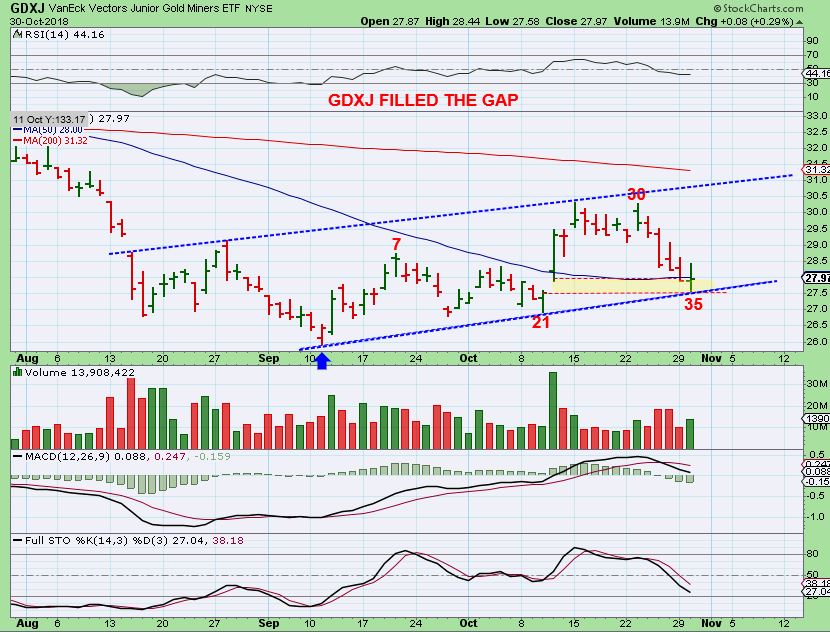
GDXJ OCT 22 – Ugly? Horrible? Should we bail out? No. It went sideways with what looked like a bull flag. That reversal off of the 10sma looked bullish. As of Oct 22, this continued to be a bullish set up..
.
If your memory serves you well, there were actually some pretty good gains in this sector. It’s not like there weren’t any Bullish trade set ups or bullish runs. It isn’t like the sector wasn’t acting correctly and never left the lows . Let’s look at those facts …
.
Was Cash really the best place to be? Not if you can trade the Miners properly, but JNUG deteriorated on me , the way leverage usually does over time in a sideways move. I made money in Miners though.
.
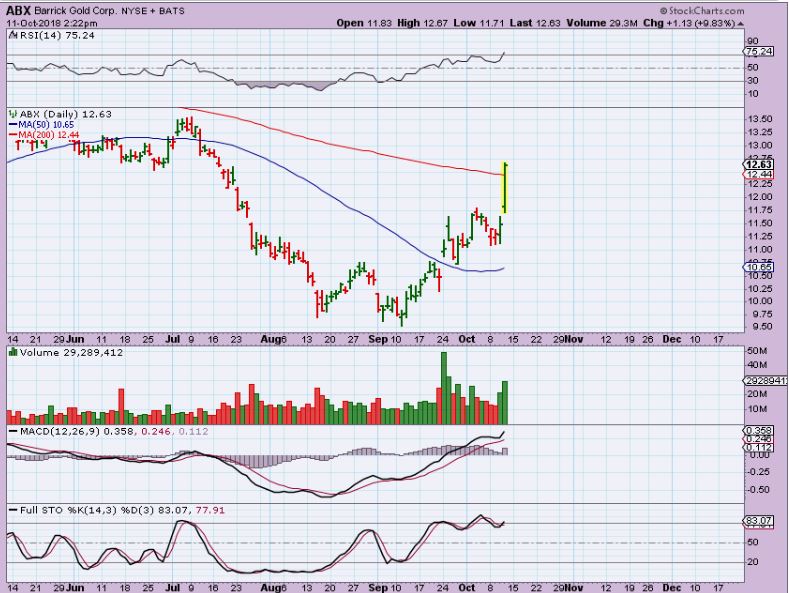
ABX – October 12 This was a buy at $10, and again above the 50 sma, and at the 200 sma here. It ran to $14 from here, and even now has only pulled back to this 200 sma again. Buying this in September was better than cash. This is still $12.50.
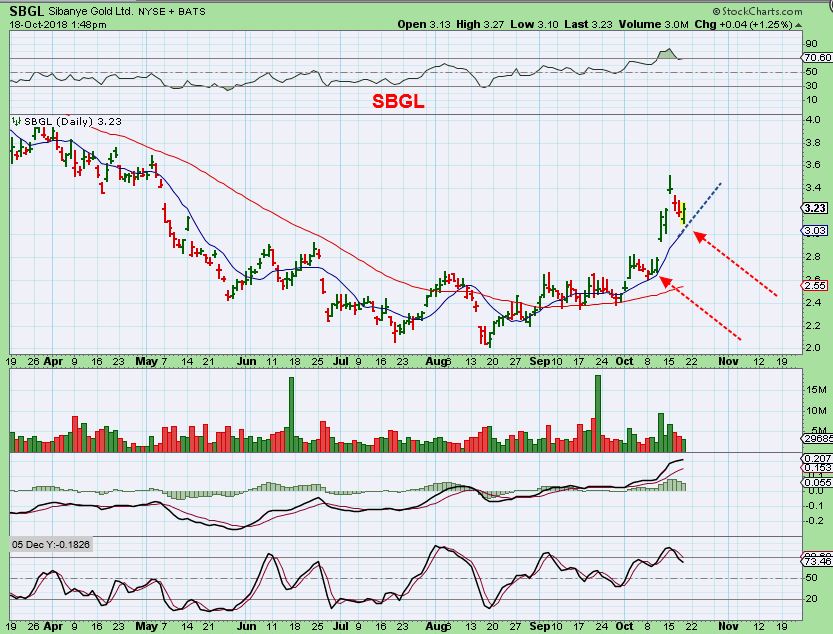
SBGL Bottomed in August, bounced off of the 50sma several times, and ran up almost 80% before that topping candle appeared. Several Miners really did look very promising in this sector, it’s not like things were bearish.
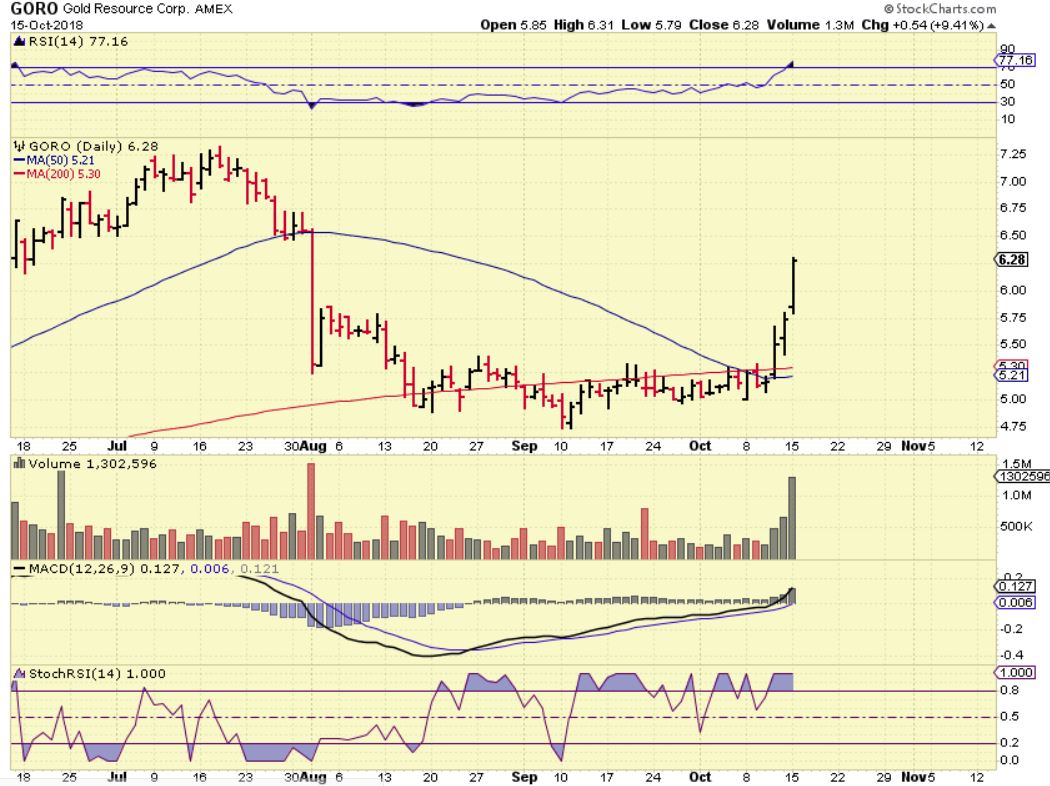
GORO broke out as late as Mid October from a solid base crawling under that 200sma. A Buy at the 50 & 200 sma was near $5.20. It was convincing and it was bullish and GORO ran to $7+. Again, Things were looking quite bullish in several individual Miners out of the ICL.
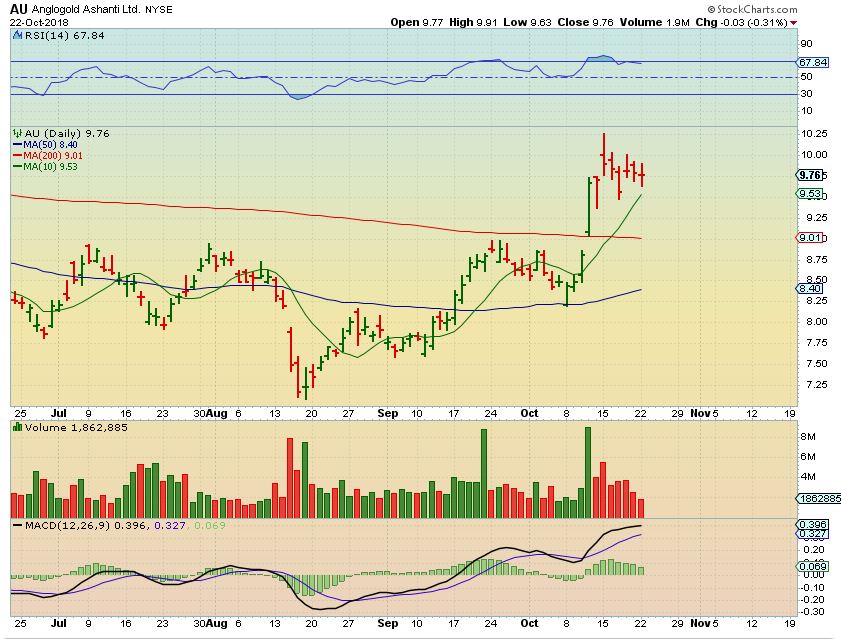
AU as of OCT 22– Wasn’t this Bullish looking? A stair step higher. This was mentioned as crawling Under the 50 sma, and also as it back tested the 50 sma around $8.25ish. It ran to $10.50 last week.
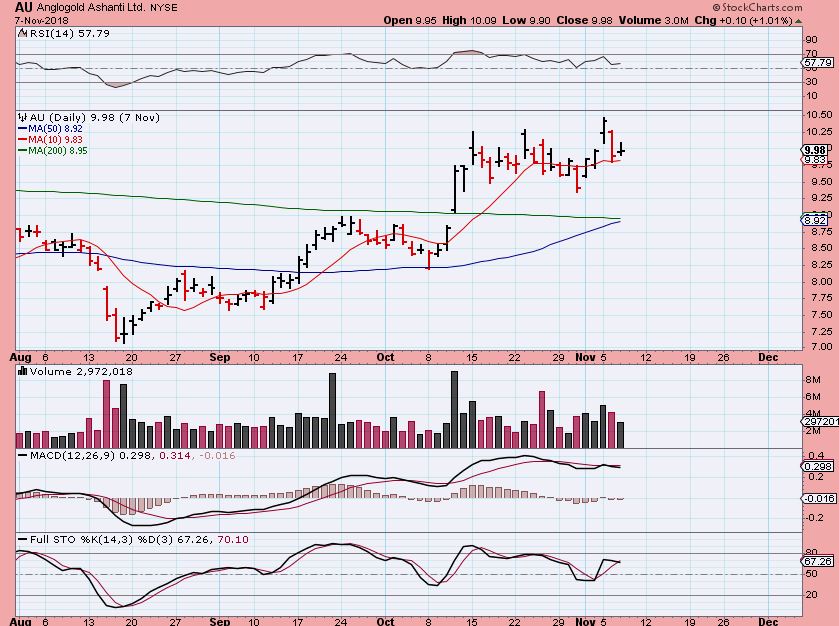
AU as of last Week– This was only 5 trading days ago and even now AU is still $9.50 .
Cash was the only place to be? No, we saw some good trades in Miners, but the leverage and people using ‘calls’ may have been victims of decay. My losses came in Jnug trading.
So honestly, these Miners were running strong, and others were too, while still others formed bases. GDX & GDXJ were acting correctly above the 50 sma, GOLD was bullishly in a base on base set up above the 50sma. Some Miners really started to lose gains when earnings were being released, and that is when the warning signs started popping up.
.
Back to GDX / GDXJ
.
As of Oct 30 – we got our back test of the 50sma and filled a gap. Even this is still all normal action. YES, I ABSOLUTELY WISH WE ALL SOLD THIS ON DAY 30, but a dcl was coming due. This was still a Bullish set up acting correctly, I wanted to ride the next bounce higher.
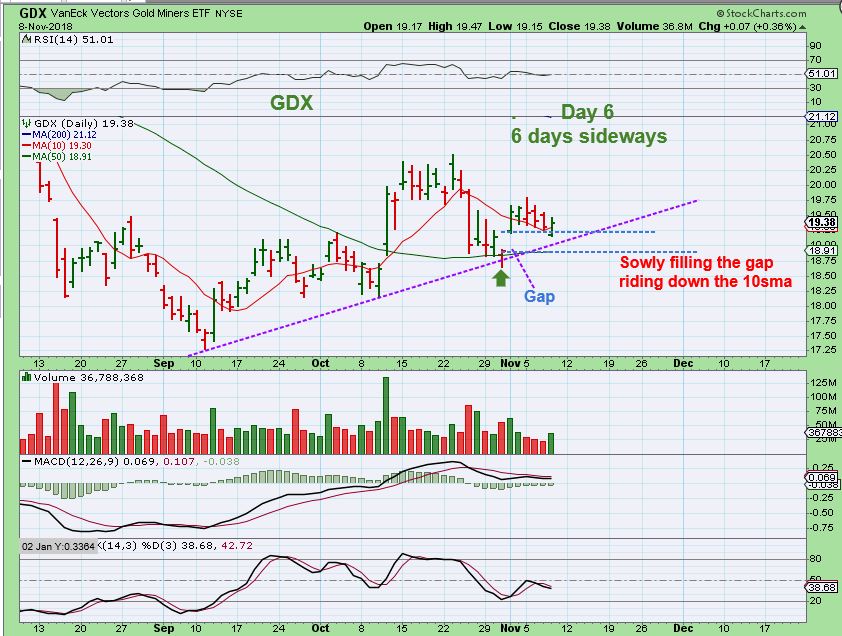
GDX – ATTENTION : THIS CHART WAS ONLY 2 TRADING DAYS AGO. It was last Thursday, still not bearish after gapping up off of the 50sma. Then it started to fill that gap…
SO … after that review, with memories of AU, ABX, GORO, SBGl, Kl, etc. refreshed, we see that this was a very bullish set up at the start of the ICL , This is what we had…
1. The COT was extreme! Smart money was long for the first time that I remember seeing.
2. Sentiment was in the trash.
3. And then after the ICL confirmed, as it played out, it built a base rather than rally as expected, it was producing some Very Bullish Looking Miners like the run higher in SBGL, GORO, AU, ABX, etc etc .
4. The chart even right now are not outwardly bearish. Last week they were bullish.
How could we not take a set up like that. I’m not going to lie and say that I made a ton of money, because I didn’t. For JNUG & NUGT it was choppy, it was tricky, and leverage did more damage than good. I made good gains in a few Miners as they ran higher, but lost money ‘over trading’ some JNUG, and holding on to my core position of JNUG from roughly $7.20 (average) to almost $10, and back to the $7’s. 🙁 But the point is that the ‘set up’ was BULLISH right up to last week. If not for Cycle Timing, I would still expect another run higher with hopes that it will just rally from this base & keep going, but I just feel that time is getting late. It is very peculiar that we still have such a bullish COT & Negative sentiment, but this intermediate Cycle is about 3 months long for Gold. I have to view it as getting a bit old. With age they weaken. Then last week more & more cracks began appearing with post earnings drops and lack of follow through on GDX pops, etc. So my weekend report was to point attention to the weakening areas of this Intermediate Cycle.
.
I said that I am on the sidelines at this point. That said, let me show you an Idea or 2 that could make this Intermediate Cycle still bullish. I said in the weekend report THAT I SEE WEAKNESS, and this Intermediate is maybe 1/2 way through, so downside could start to develop, but a 3rd daily cycle run could make new recent highs. Let me show you a few ideas…
.
GOLD DCL is due – The weakness in many miners and in Silver seem to indicate that this will be the top of this intermediate cycle and that it should follow the orange lines, but it still looks like a decent base with a good COT, so I will draw both lines (favoring the orange at this point).
GOLD ICL AHEAD #1 – Could Golds next daily cycle still put in a higher ICL? Yes, It could by day 12 or so.
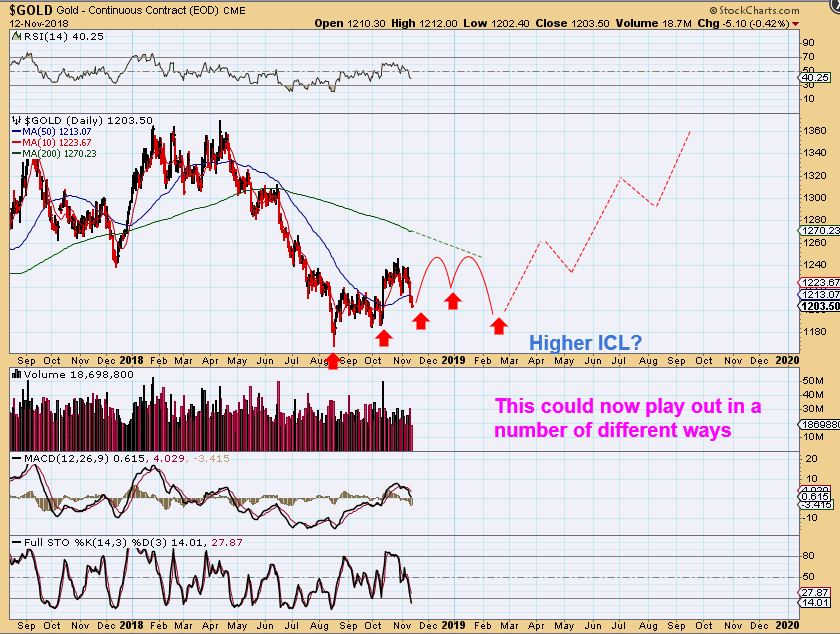
GOLD ICL AHEAD #2 – This would take on a similar pattern as the complex consolidation at the 2015 Gold summer lows. This has easy to identify daily cycles, but the 2015 cycle really didn’t…
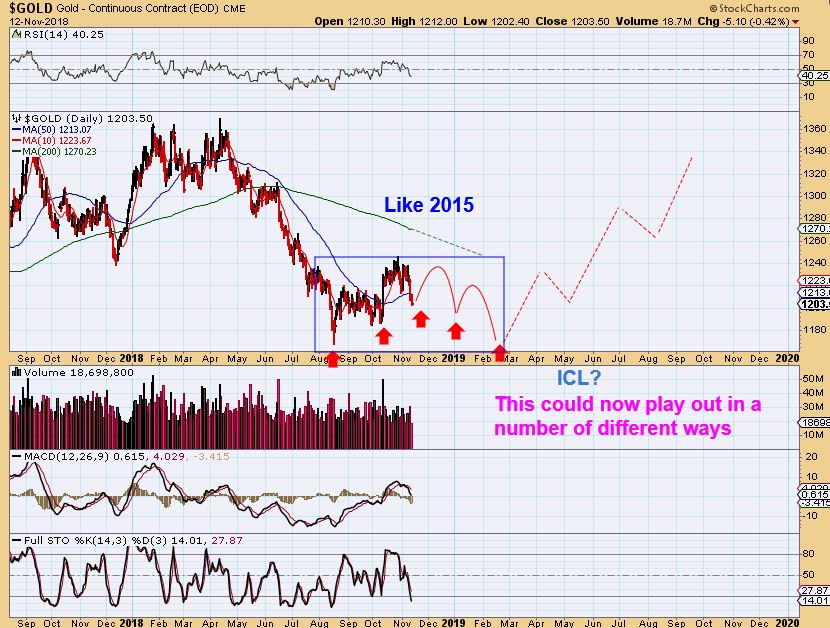
The 2015 intermediate cycle was tricky too. Looking back here at the Red Box, I can’t tell… Do I see 2 or 3 daily cycles in that red box? It was also very choppy. Is that a very long daily Aug to September, and then a short one in September, and a very long one October into December? It is just not clear. This is why I try not to expect normal action at all times, even with cycles. That chop was tricky. Cycles are very helpful the majority of the time for ‘timing’ peaks & lows though. Notice that this intermediate cycle was only slightly over 4 months long too. We may get that now too.
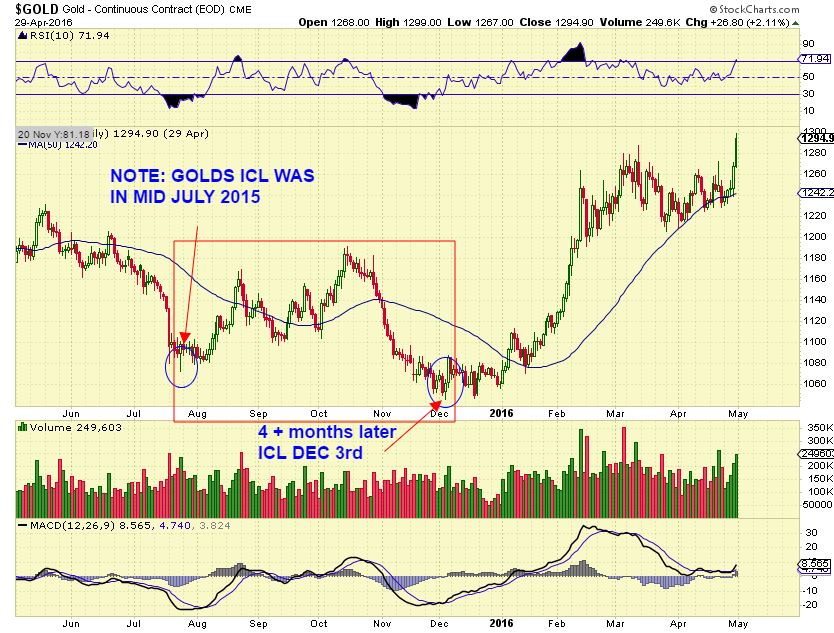
GOLD ICL AHEAD #3 – I drew this one similar to the 2015 here (Blue boxes), but it shows the break to new lows as a bit deeper. The final push higher tagged the green line in 2015 (200 daily sma), so Gold could even do that in the next daily cycle.
GOLD ICL AHEAD #4 – This run in Gold could not get above the Weekly 200 ma. A double top there could peak this, and then a drop. This really would be a choppy base-like IC.
.
CONCLUSION: This is the take-away: That was a very Bullish set up as the confirmation of this ICL developed. The COT remains quite Bullish now, so I don’t know what to make of that. Some Miners really ran well, worth trading, while others did o.k., and still others formed bases & never really got going- those broke down quickly with earnings reports. If you feel beaten up, maybe you trade JNUG & Calls too much at every ICL? If that isnt working for you, maybe you can try smaller positions or just trading the Miners with proper set ups & a stop next time. Jnug does work great at V-shaped Bottoms, but this sideways chop gave leverage decay.
Last week I started to really see the signs of fatigue or weakness appear, especially as various miners fell after they reported earnings. I stepped to the sidelines away from leverage last week, even though a daily cycle low could form here, and move higher for 8-12 days or so into a 3rd daily cycle. I want to watch how things unfold without leverage at this point. I then wanted to point out the ‘timing ‘ in the Intermediate Cycle as possibly at the 1/2 way point, we could see weakness going forward.
,
This ICL in GOLD looks to have built a sideways base so far, but the Cycle still has further to go, possibly 2-3 more months. What kind of bounce will the next daily cycle bring? Will it be short-able after that, or more sideways chop? I’ll be looking for clues. I also want to watch some of these leaders.
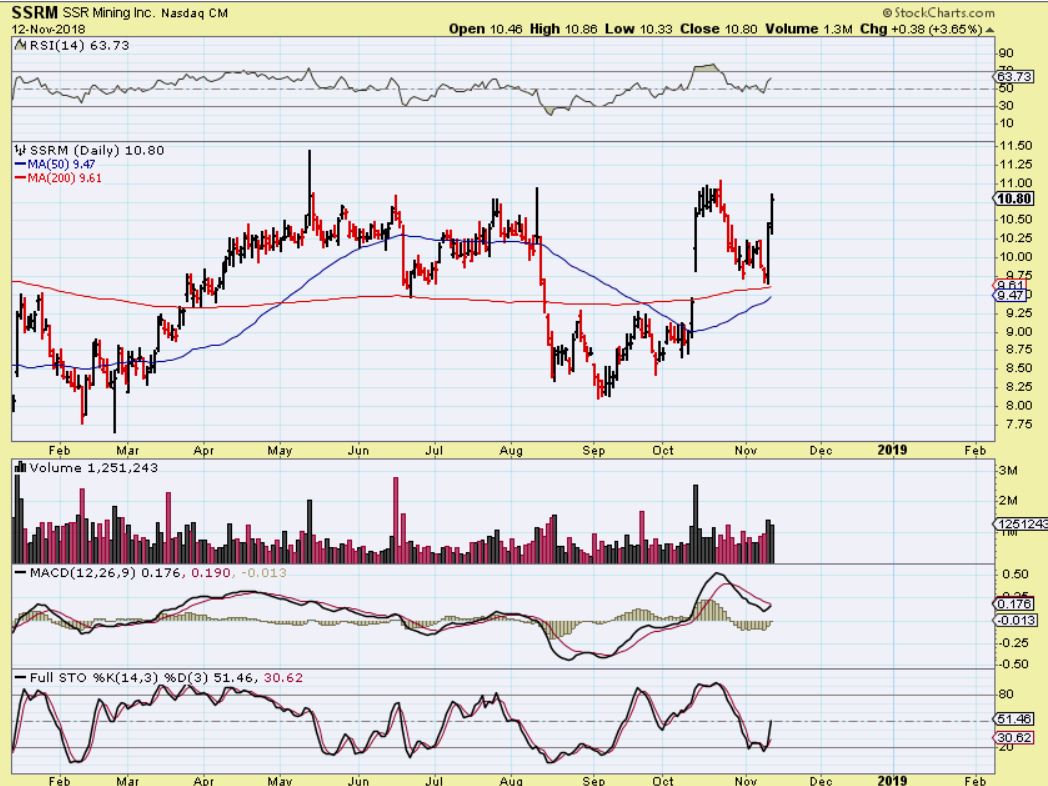
Stocks like AU and ABX remain near their highs, and SSRM is ignoring Silver completely, as seen her from yesterdays chart. Going forward, we may find ‘the leaders’ during the period of weakness.
.
I also am interested in Oil, since I feel that it will put in a swing low anytime now. I’m hoping that it will be a little more upside and lot less ‘choppy sideways’ than Gold was.
.
Enjoy your Tuesday markets
,
~ALEX
.
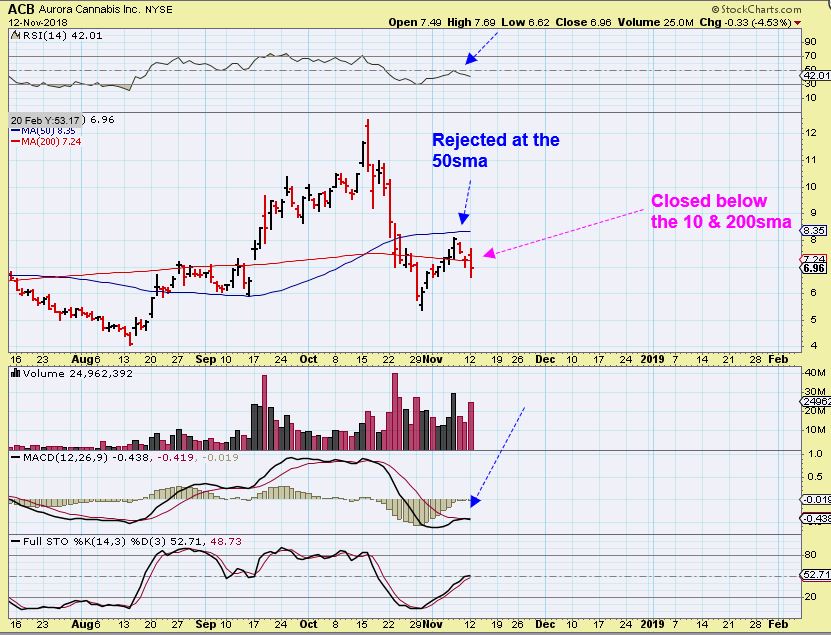
I have been moving to cash , out of many trades recently, just due to choppiness. Some by choice, some by stops. It seems that in this choppiness, even some very good looking set ups are Popping & then breaking down, in other words, No follow through. The MJ Sector is very choppy and questionable now too, so I raised more cash exiting some stocks in this sector too.
.
The MJ Stocks are choppy. Notice how many have bounced after that steep sell off, but I see some back testing & being rejected at the 50 sma now. If they don’t hold their 200 or 10 sma or another important support? For now I will step out. I sold ACB to play it safe in these choppy conditions.
This could become a H&S