November 8th – Propping Up The Markets
As mentioned yesterday, Markets do not like uncertainty, but with elections out of the way, we could get a Post Election Pop. As you can see, we got that Pop. Today is an FOMC Meeting, and there were a few other areas of interest that continued to set up for higher price too. Let’s take a look…
.
SPX – On day 7, we can expect markets to hold up above the swing low from here, but I’m still wondering if they can recover fully, or will things remain a bit choppy again going forward?
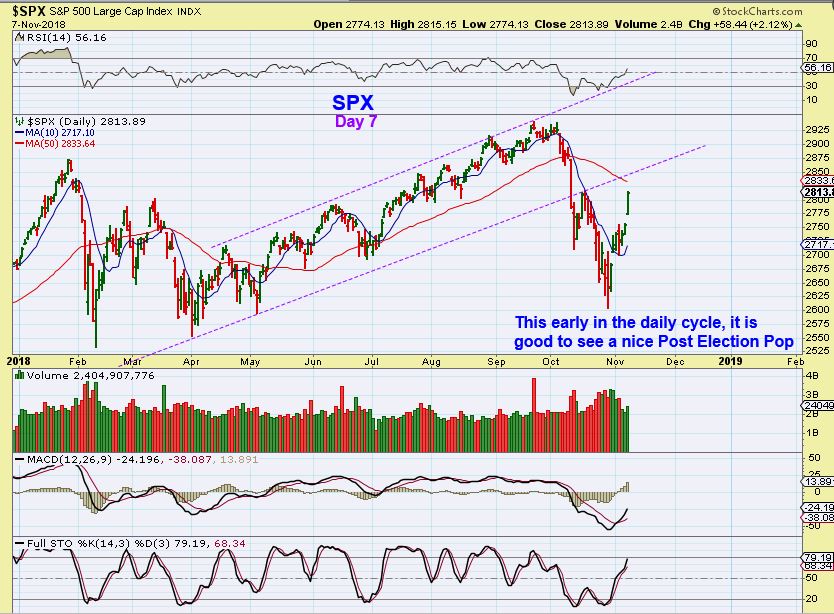
This is what I am looking at…
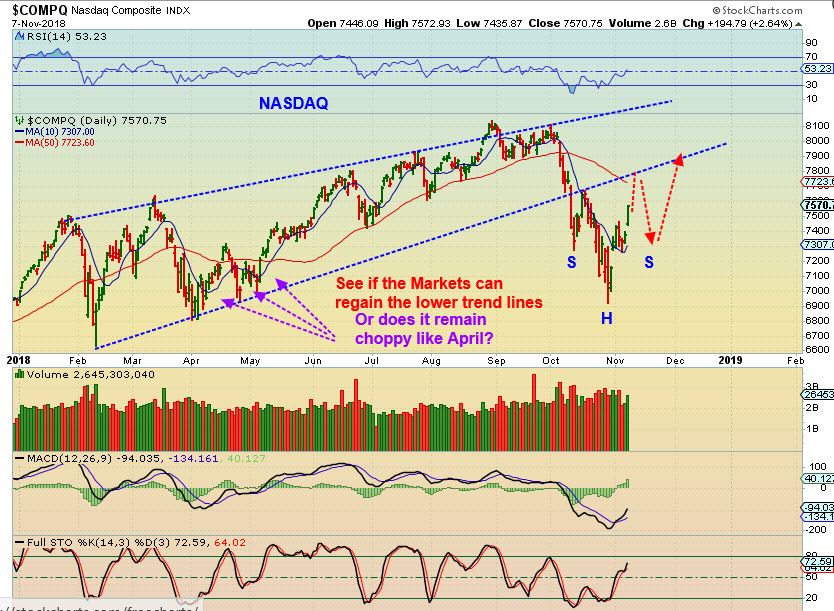
NASDAQ – Price could reach the 50sma and chop around until it breaks back above the lower trend line, or…
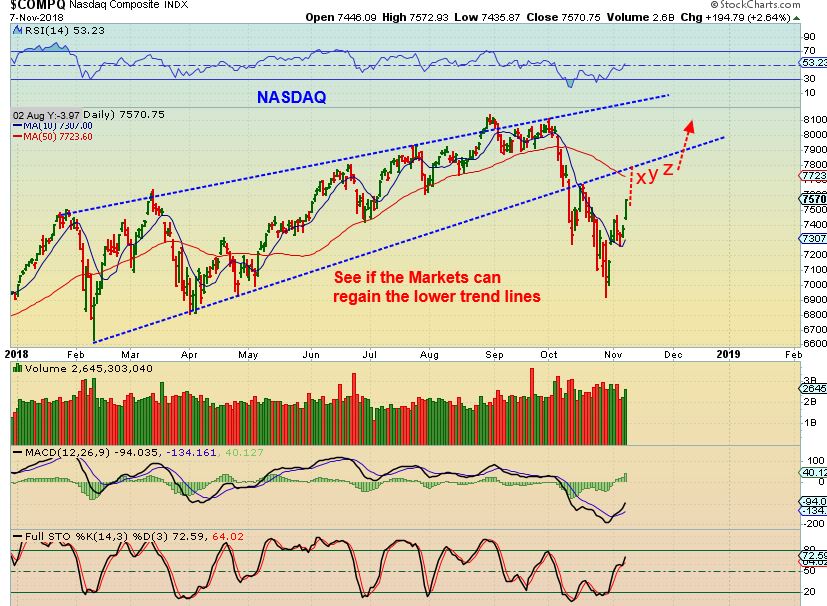
NASDAQ – Resistance could cause a dip, MAYBE even forming an inverse H&S at the 10 sma. We still have ‘time’ on our sides if you went long, so we can watch how things play out going forward and make adjustments if needed.
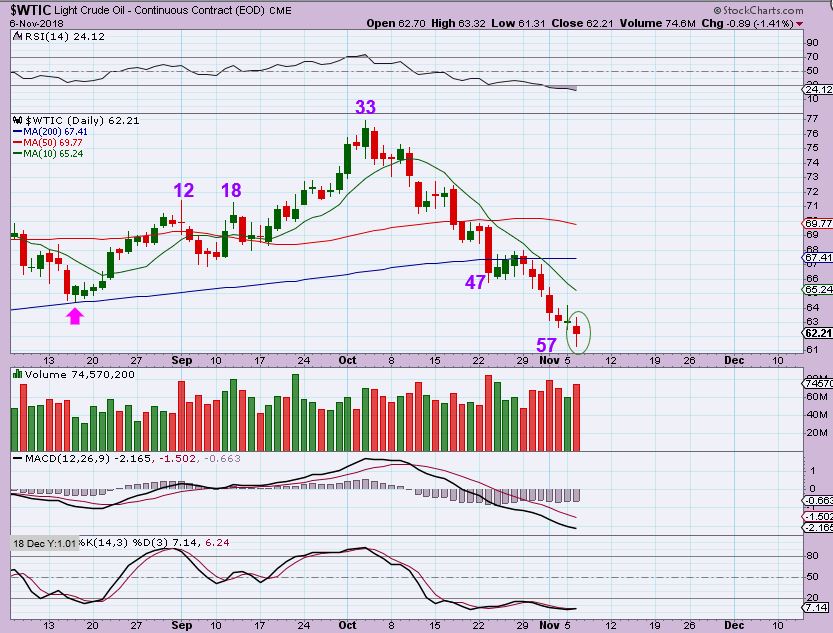
WTIC – Oil is very due for a dcl and this was yesterdays chart showing day 57.
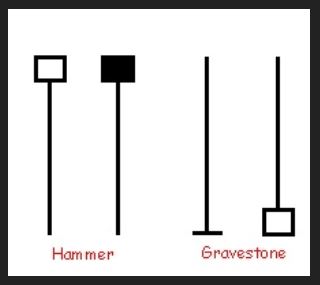
I have pointed out in the past that after a long sell off, a Gravestoe Doji looks bearish, but actually can signal the end of a sell off.
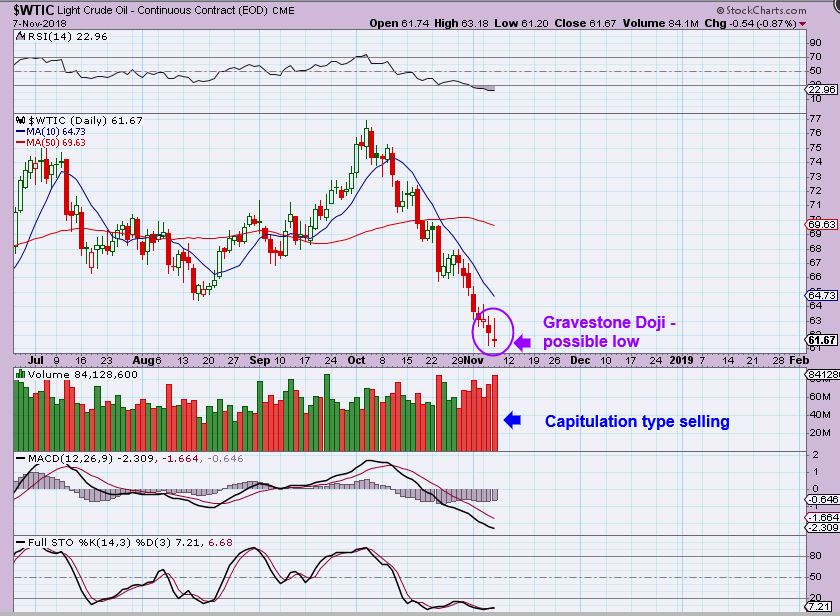
WTIC – This is a gravestone doji, and could be the low for Oil on day 58. It is still best to wait for a reversal and break higher if you want to try a long position via UWT, USO, or UCO.
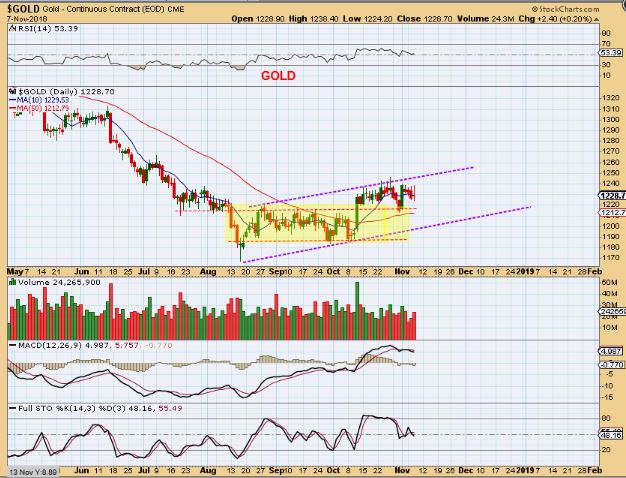
GOLD – Gold formed a base (yellow), and has been trading in a sideways lack luster chop. THIS CAN still break higher & run, but as I mentioned yesterday, time is moving along here.
.
I ( and maybe you have too?) been hearing that this movement for the Miners is just not normal. I have received emails saying” Why bother with Miners? Cycles are not acting correctly, it is due to manipulation. There is no way that this is normal market action. This manipulation is causing sideways chop and it can’t break higher. This never used to happen, but let’s admit it, we’ve never seen anything like this in the past. This is bearish market action.” My answer, ” That is not true, and I have proved that in the past, I will try to show some here proof again.”
I agree, we are seeing a push higher that has turned to periods of sideways choppiness without follow through, and that can get very frustrating, but it never happens in Bull Markets? Cycles are actually working correctly. They do NOT only work correctly if we rally to our expectations, they are used for ‘timing’. The statement that This is only bear market action is very wrong, and this chop has happened with Miners many times. I want you to take a good look at GDX. I agree that it is not really Ramping higher, but is this “Bear market action” coming out of an ICL? 🙂 Let’s discuss.
.
GDX – We have an uptrend and GDX remains ( for now) above the 50sma. GDX ran, from the September lows to the October highs, 18% so far. I warned readers even before the drop started, that GDX could back test the 50sma. Now it has done that, and then it bounced. And now…
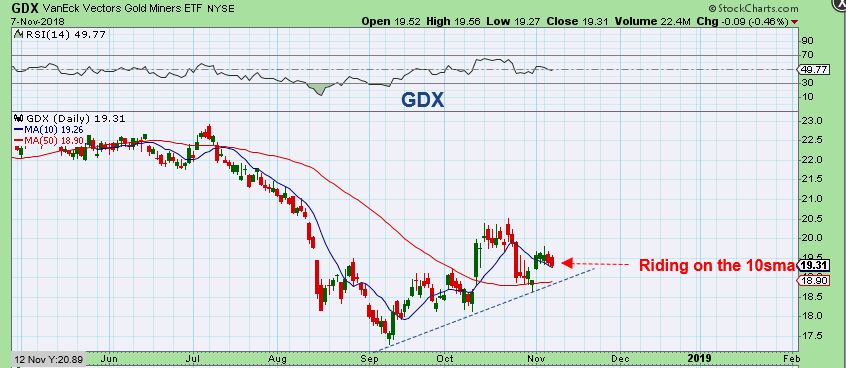
We are now waiting for the rest of this story. Will it ramp up from here or consolidate further? And I mentioned that it could play out this way, as a sideways choppy base. And…
Now let me show you something …
.
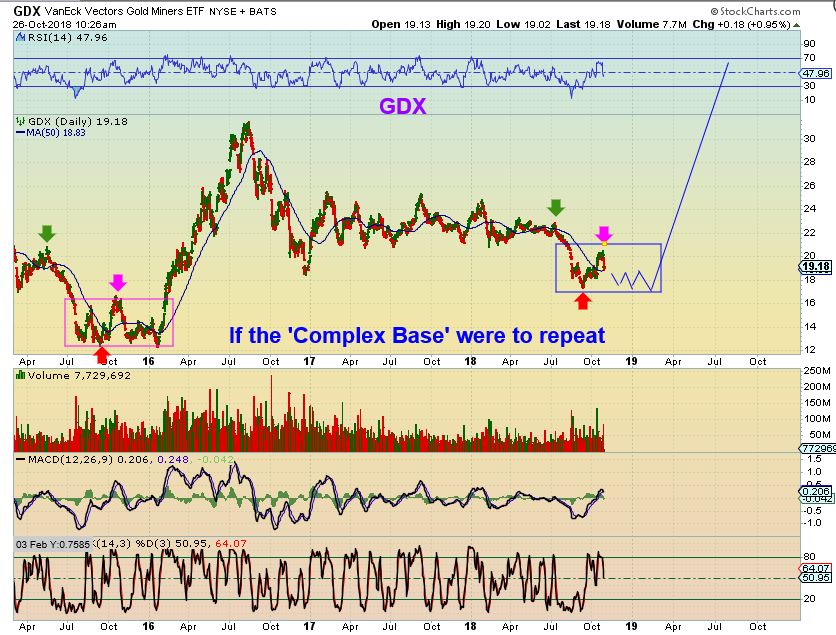
Again, this is GDX currently, look at the move out of the ICL. I am told ‘Big Boys are holding it down and wont let it run‘. “They have done this since that 2016 and this never used to happened. ” Is that true??
Miners never went sideways and got choppy in a Bull market run?
.
And now look at HUI coming out of the ICL in the summer of 2004 – May, June, July, August, and into September saw the Miners rally, and drop, and chop around, and drop & Break -To – A – New – Low, even breaking below the 1st daily cycle low! …and then it bounced & still chopped around sideways for 2 weeks, before taking off higher. I traded Miners back then, this was Bull Market action. This was in the middle of a raging bull in Miners, but we had sideways choppiness then too. THIS WAS NOT EASY.
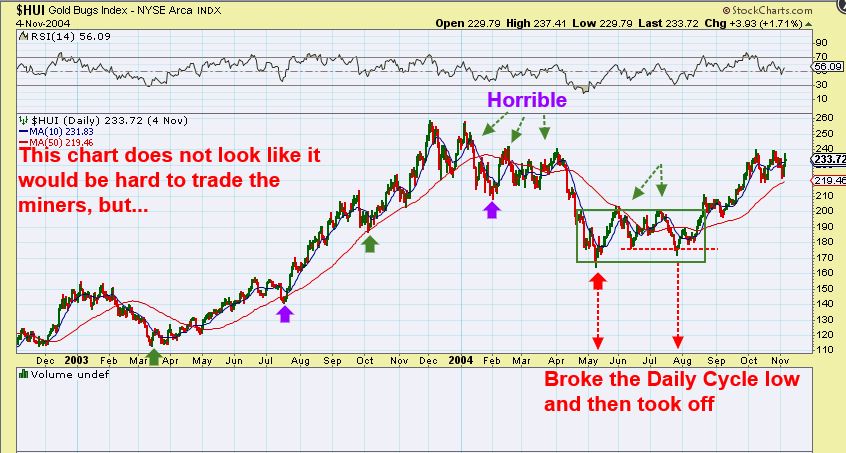
So in this 2004 chart, Miners dropped right back to the lows almost 3 months after the ICL! We are not even close to tagging the ICL price right now (yet), so please understand that this HAS happened in the Bull runs before. I say that ‘Emotions and expectations postponed blur the facts’. What we are doing currently is analyzing the set up of an ICL as it plays out, they almost all play out differently, and we make adjustments along the way. Too many people think that if this isn’t like 2016, it is no good.
Think about this: The May ICL Price was almost tagged in August & then it rallied?
So again, every now and then, I get an email that says basically, ” Why do you bother with Miners? GDX is obviously being manipulated, and this is bear market action. Bull markets do not do this.” as though this sideways chop is abnormal, bearish, and not found in Bull Markets. NOT TRUE. I have pointed out other Bulls charts , like NVDA, AMZN, AAPL, etc – I try to show people that they all go through periods of this sideways chop.
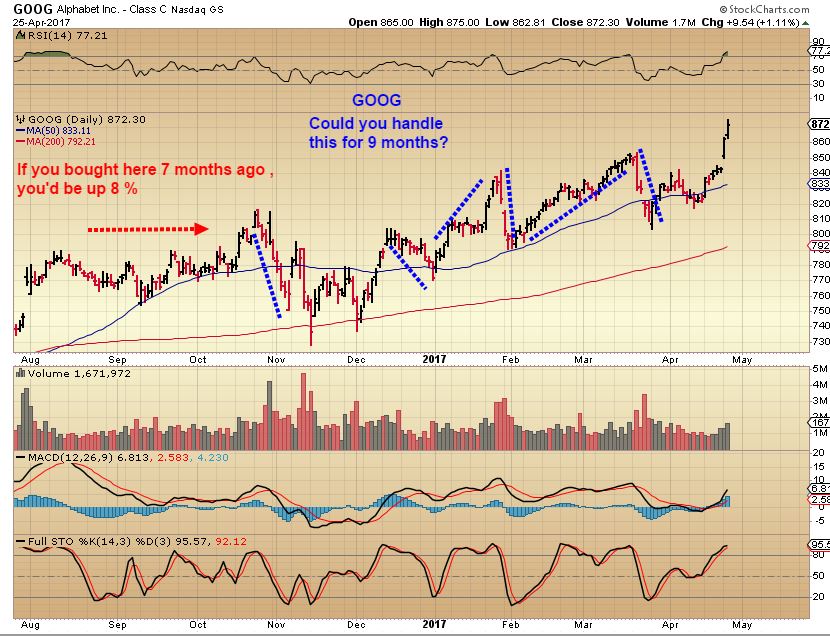
GOOG – Goog ran from here in this 2017 chart to $1250. Does this 9 month price action look like a nice easy ride to you? I see many Miners that look better than this. So many say, ” I wish I just bought GOOG and held it“, and I say, “Could you have held on to this?” Picture buying this and look at each day after day after day. Especially NOT EASY if most of the news at this time is bearish sounding & people throwing out Google conspiracy theories 🙂
Conclusion: So what can you do when an ICL presents itself and the setting is Bullish? You see the COT bullish, Sentiment is extreme, the $BPGDM is Bullish vs Gold, Some Miners are running when Gold sells off, Divergence starts to develop, etc. ? That is your best opportunity in 6 months to take it as a low risk entry position and watch how it plays out. That is all you can do.
That is what I do. I find the ICL – Take the trade, and hope that it is a rocket ship higher. If it is not, I am tasked with the assignment of figuring out step by step, to the best of my knowledge and experience, and share with the readers what to expect next.
Currently, we are fine and it has moved sideways & higher, but we need to recognize that at that point, we are about mid point from ICL to ICL, so we take that into consideration. That is the only thing that I was saying in yesterdays report . I am analyzing how this is playing out and reporting it to you – my readers. So I hope that this helps. All is not lost, but a massive ramp up has not developed, each pop has lead into a consolidation phase. Again, in 2004, Miners dropped almost right down to the ICL, bounced around for 2 weeks, and then rallied.
At this point in time, I do not know exactly what will happen, but I do own a smaller position of leverage. Personally I have cashed out some of my JNUG over time, ( I go in quite heavy at an ICL), and have mentioned that I traded in others areas. I have reported buying MJ Stocks, Shippers, and others stocks, always ready to just jump back into a larger position of Miners if we break out upside.
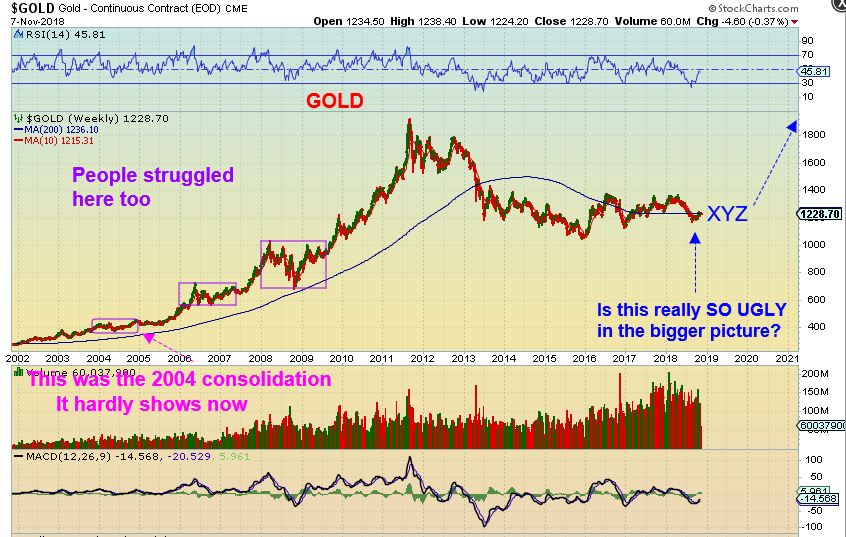
If we see this 2004 type action in the chart below? It likely means that more ‘time’ is needed.
Remember: I have also mentioned in my reports that the General Markets could rally into the end of the year, as Precious Metals go sideways, and then the next ICL is the proper ‘timing’ for a more size-able rally. I will go on record as saying this, I DO EXPECT GOLD to eventually rally in a big way, and I do expect it to catch the majority of people on the sidelines unable to pull the trigger, even after it gets going. They will NOT be mentally prepared to enter, but you will be. That is what my reports are for.
THIS IS A VERY BULLISH CHART TO MY EYES. Look at where we are now on this chart. Scary? bearish? painful? If so, then you must have missed the 2004, 2007, 2008, 2012 chop, because this is Normal Bull Market action to me and 2008 was scary. The drop in 2012 was bad & bearish. This chart looks constructive, based on what we know about bases, right? It is always a matter of ‘time’ .
I do understand the frustration, I have been invested in Miners since this ICL planted itself too, so I will discuss it further in the weekend report. Today is actually the last day of a Fed Meeting, and that may affect Gold & Miners after 2 p.m., but I do not expect any real surprises. The FOMC Meeting usually happens on Tuesday & Wednesday, this is the first time I can recall a Wednesday & Thursday meeting. I am GUESSING that they wanted to be freed up for Election Tuesday, so planned this weeks 2 day meeting after the election. Once today passes, Miners may reveal their short term intentions. I am now lightly invested there with small leverage position, and as mentioned, I have been trading shippers and MJ stocks .
.
I will discuss a few trade thoughts below. Enjoy your Thursday trading!
.
~ALEX
Laws are changing and many of the ‘headwinds’ for the MJ Sector are slowly fading away. We now have several MJ stocks that are listed on the NASDAQ, AMEX, or NYSE.
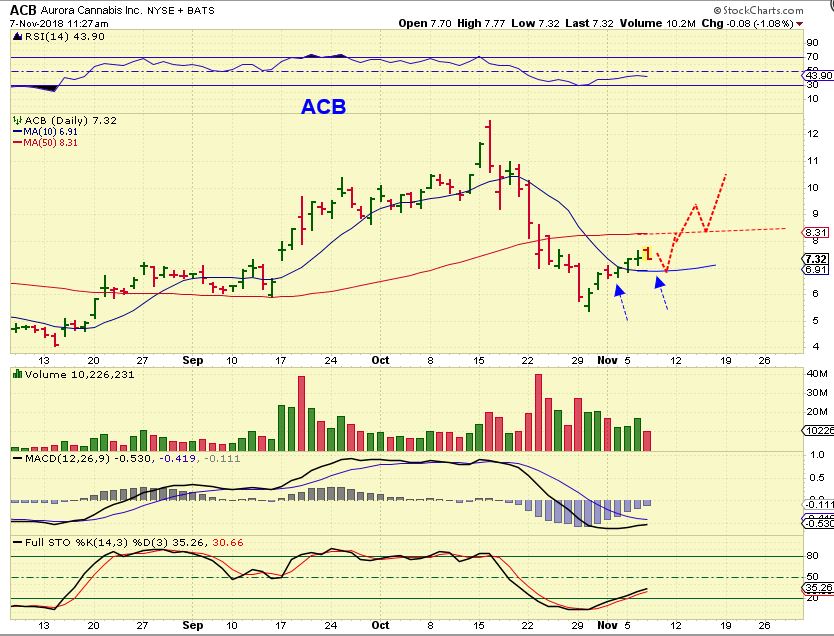
ACB – Recently I pointed that this sector was heating up a again, and I posted this chart and mentioned in the comments that I was adding to my ACB position (this used to be ACBFF) above the 10sma.
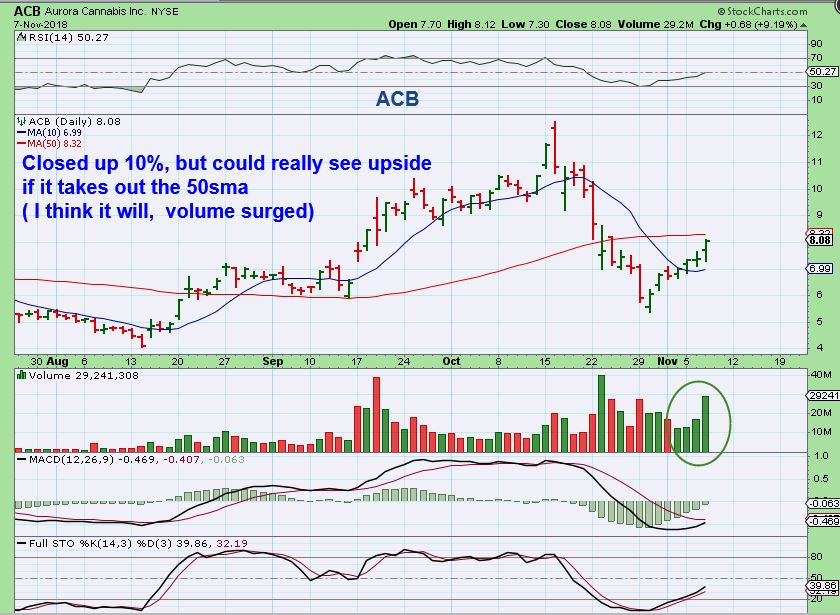
ACB – All of my MJ stocks were down for most of the day, and in the final hour, they ramped up ( Jeff Sessions resigned) Into the close. Volume is swelling and I think that many will break above their 50s ma again. This is closer to oversold than overbought.
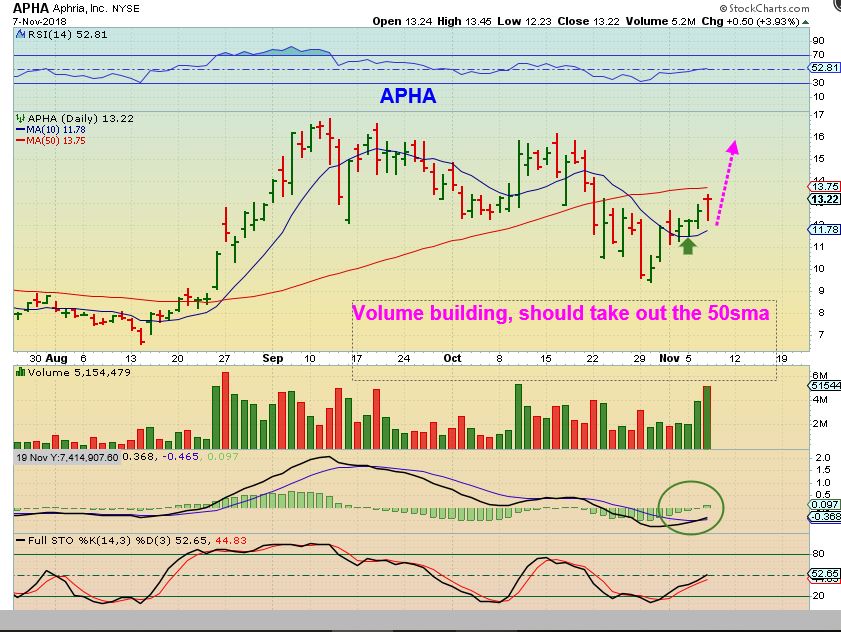
APHA DAILY – This was APHQF, and I repurchased this one too, since it regained the 10sma and volume is also swelling. This shows buying interest and the ability to take out the 50sma if that buying continues. This 2 month consolidation may now be over.
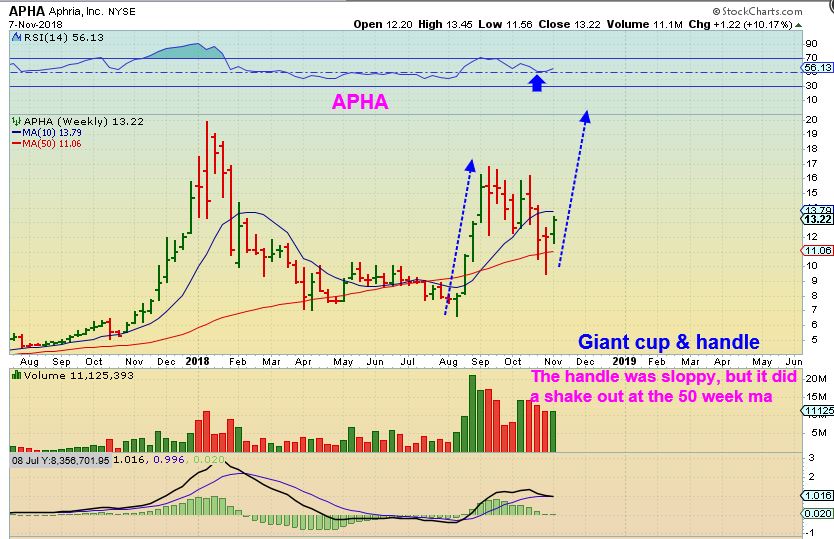
APHA WEEKLY – The weekly APHA Chart shows that the recent sell off & consolidation may be a sloppy handle on a much bigger cup & handle. If so, and if this sector remains hot, the upside is very promising.
YGYI – Very Bullish, but not for the low risk trader. I pointed out this one on Nov 1st at the 50sma. It is Bullish, but can be a very tough one to ride. It moves $1 or even $2 in a single day, in either direction.

YGYI – It ran from $6 to $10 in 3 days!! Then it pulled back to the 50sma and reversed yesterday. This is a buy here, but be ready for a crazy ride. I have traded this ( I am in it). In fact, this chart was at 3:20 p.m. and…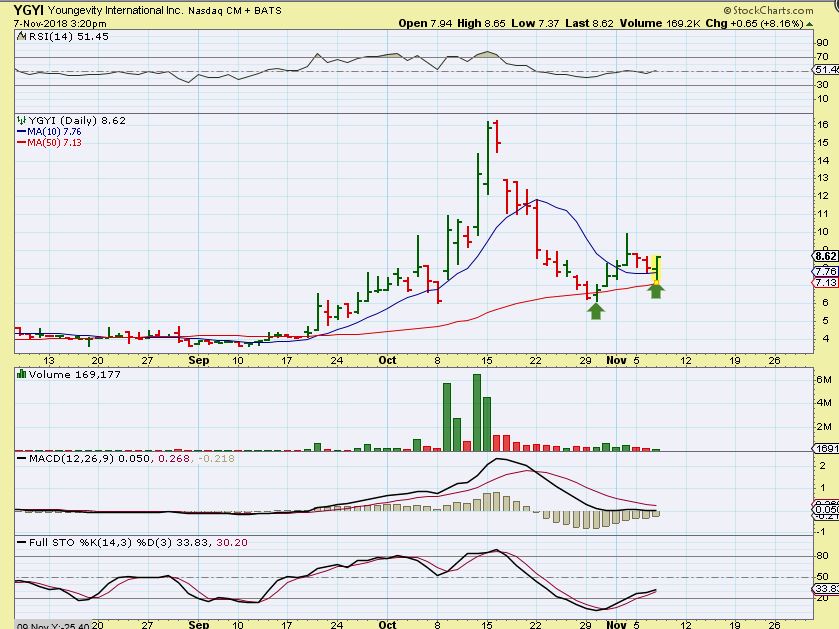
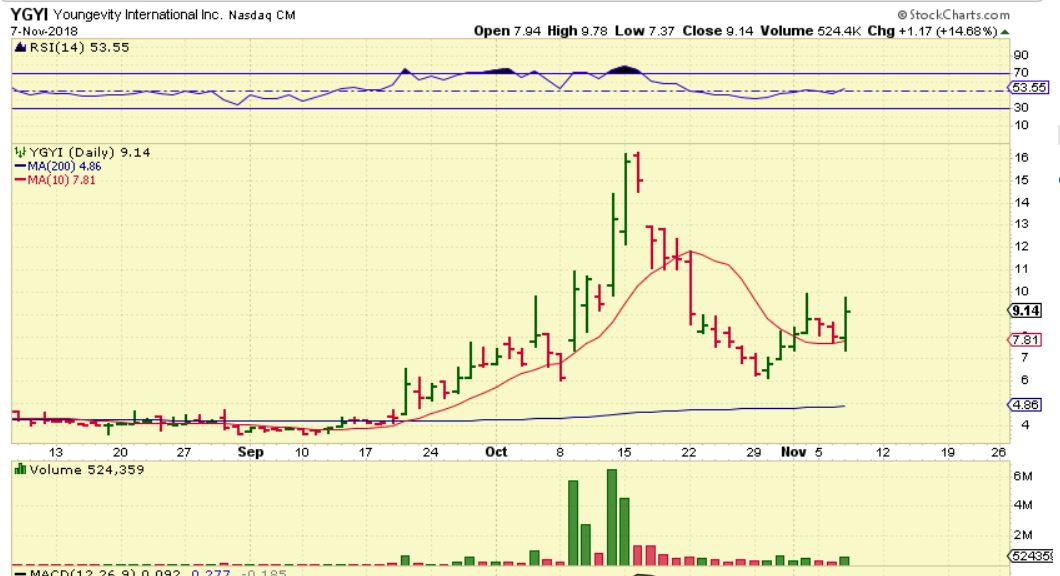
YGYI – As it crossed the 10sma at $7.30, I Bought at $7. 50 and it ran to $9.78 ( over$2) very quickly!! Then dropped back to $9. This can easily run to $16, but it can crash if something goes wrong. Stay Frosty on this one!
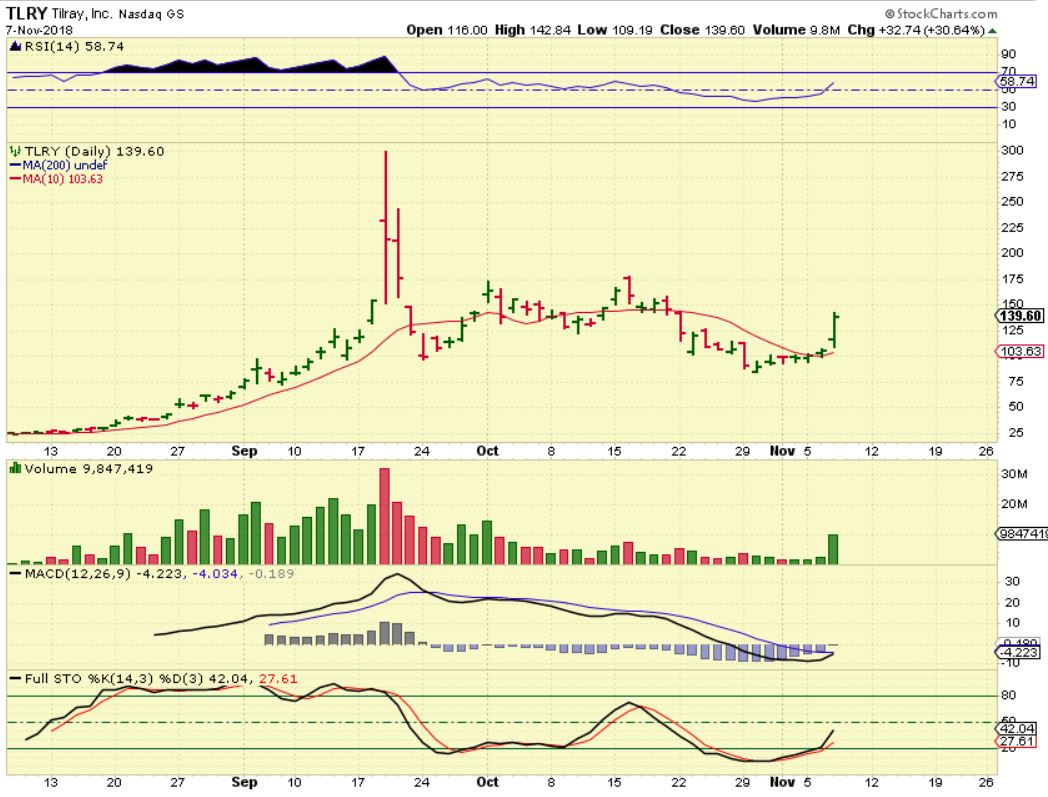
TLRY – Another listed rocket. I mentioned this in the comments section and it was only $115. It shot up like a rocket, up almost 40% at one point, and closed up 30%!! It is $139.60, but we have seen this one run to $200 in 2 days from this point. Scary fast, not for everyone, but this 1 month consolidation may be over too!
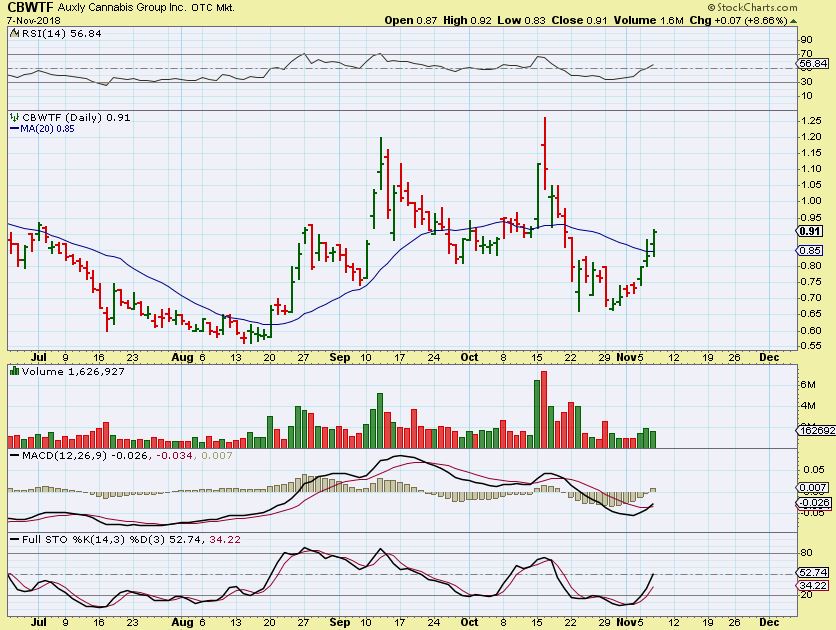
CBWTF DAILY – Not a listed stock, but I wanted to point out that many are coming out of lows, they are oversold, and breaking back above their 10sma ( this is 20sma) and their 50sma. The set ups are acting bullishly.
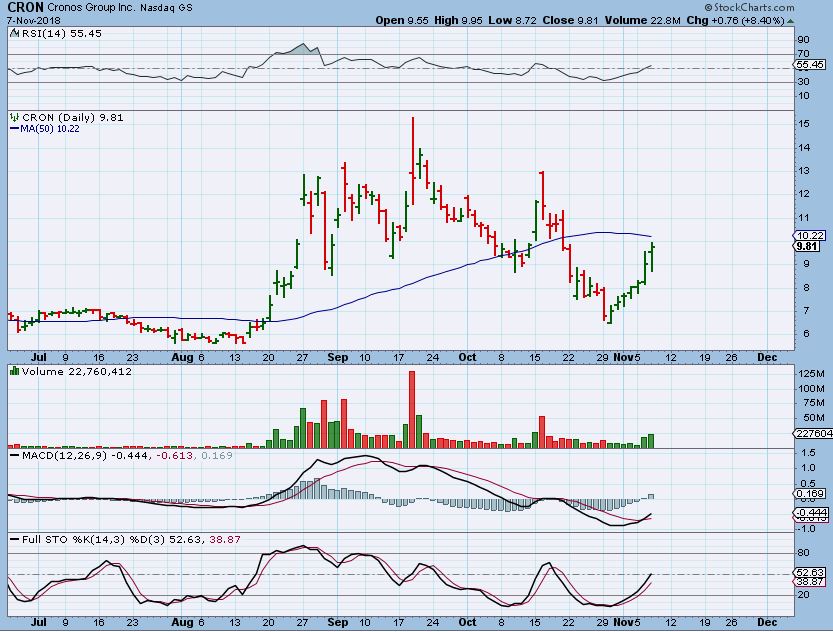
CRON – Another ‘listed’ stock , it is running to the 50sma and volume is increasing, so I think that this can break higher too. Look how fast these go, from $6.50 to $10 in days.
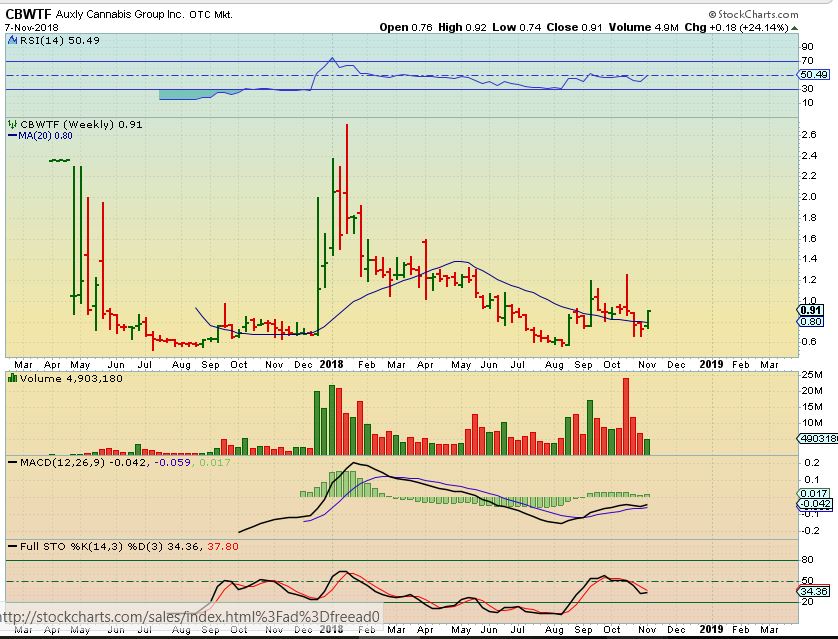
CBWTF WEEKLY – The weekly MACD is bullish, and a stock like this is already up 24% for the week, but they all could have more upside if this sector continues to act bullishly.
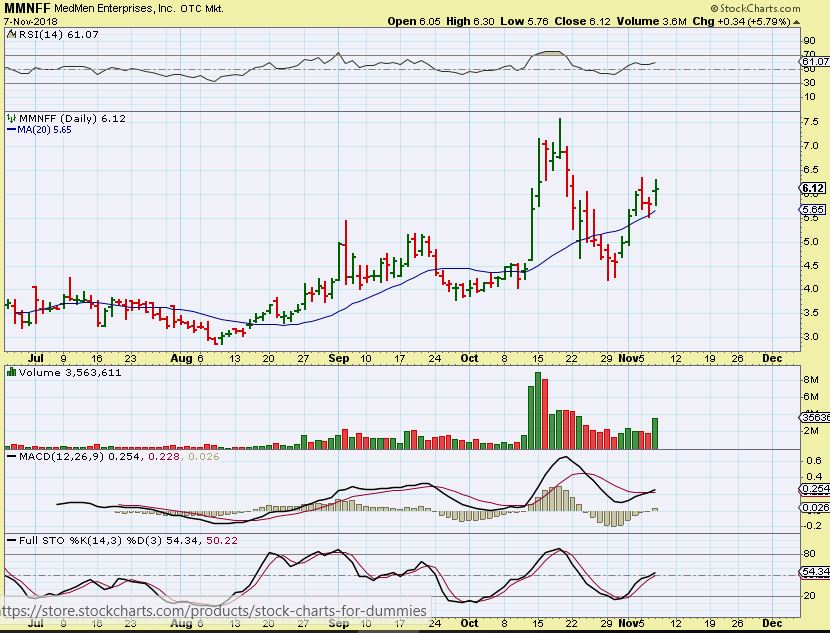
MMNFF– I forgot to change from 20sma to 50sma, but this is a bullish MJ STock that makes good revenue too.
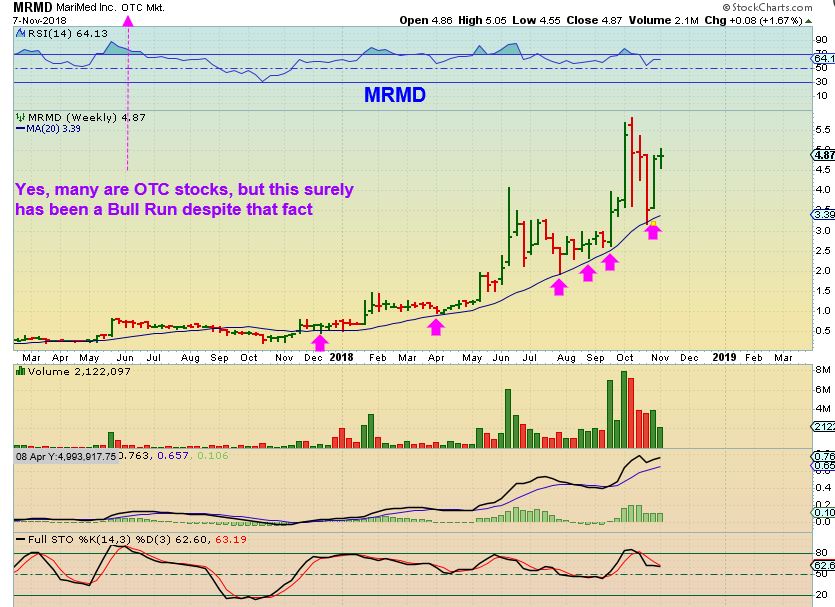
MRMD WEEKLY – If you look at this chart, it shows a very very difficult move, but also a very Bullish move higher taking place over the entire year. This was $0.50 to $5.50! Not an easy ride.
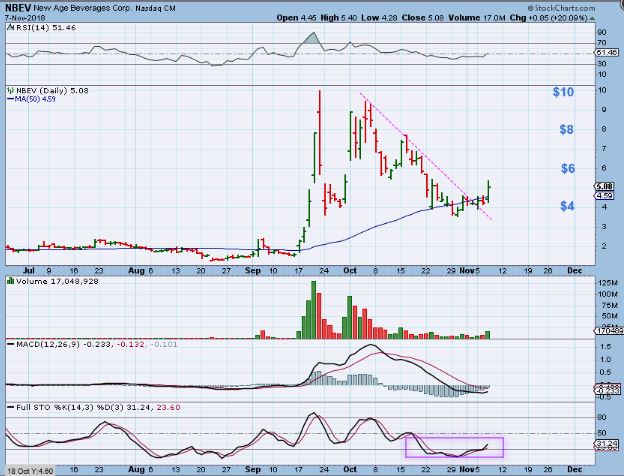
NBEV – You may recall this Beverage Company that ran from under $2 to $10 in days. It has been consolidating at the 50sma and broke higher yesterday. it could be considered a semi- Low risk entry? Well, a stop under the 50sma and trail it up, this moves big.
There are MANY more bullish set ups in this sector after a short consolidation. Check your charts and maybe you want to see when they report earnings too (Earnings for many have been good though). This has to be considered High Risk, with possible High Reward, so enter at your own risk level.
.
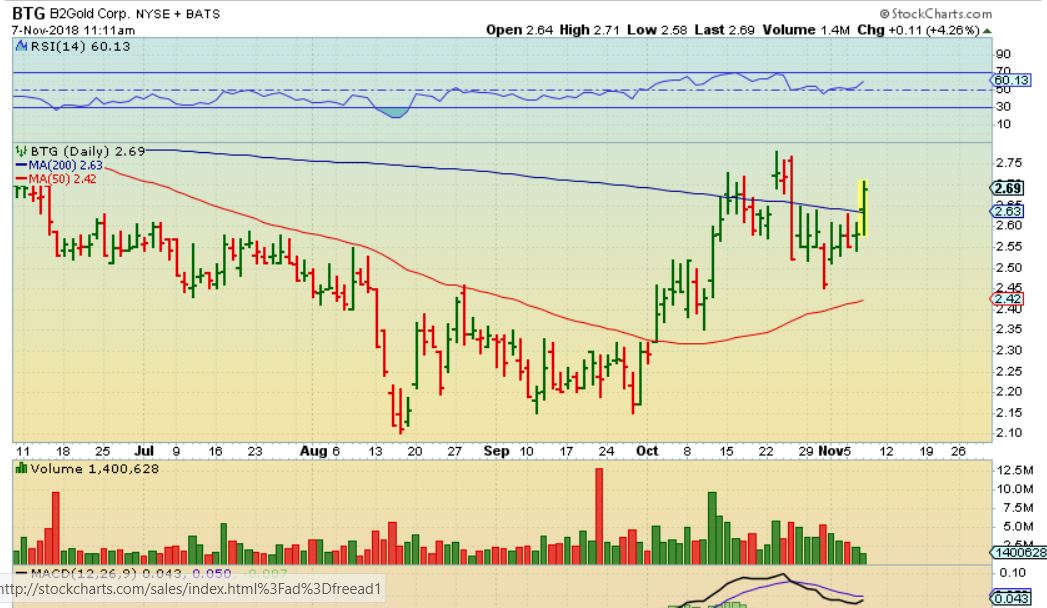
BTG – A miner with a bullish looking set up, it tried crossing the 200sma and the 50sma is curling up. I’d put it on the watch list for a post FOMC view.
SHIPPERS
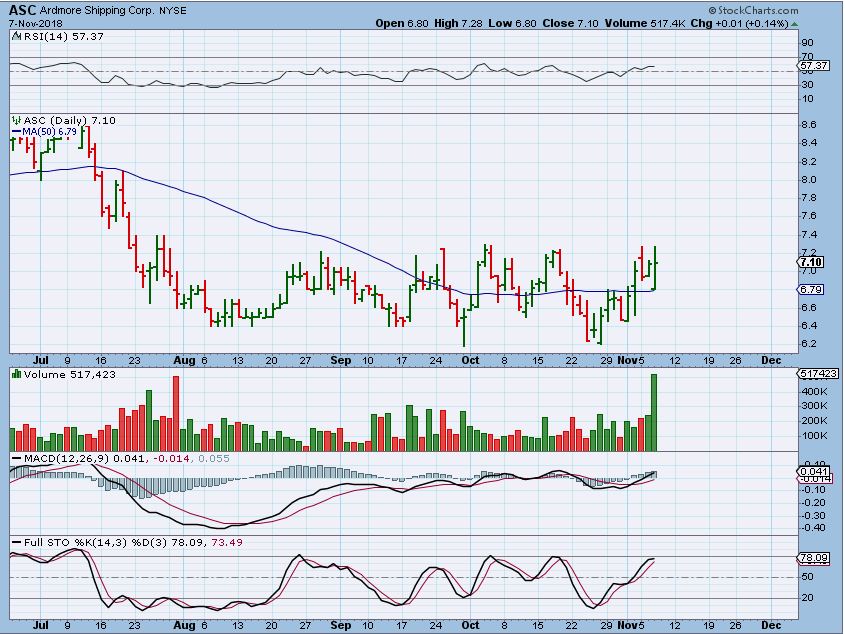
ASC – This is a base, and this shipper had high volume for Midday, so…
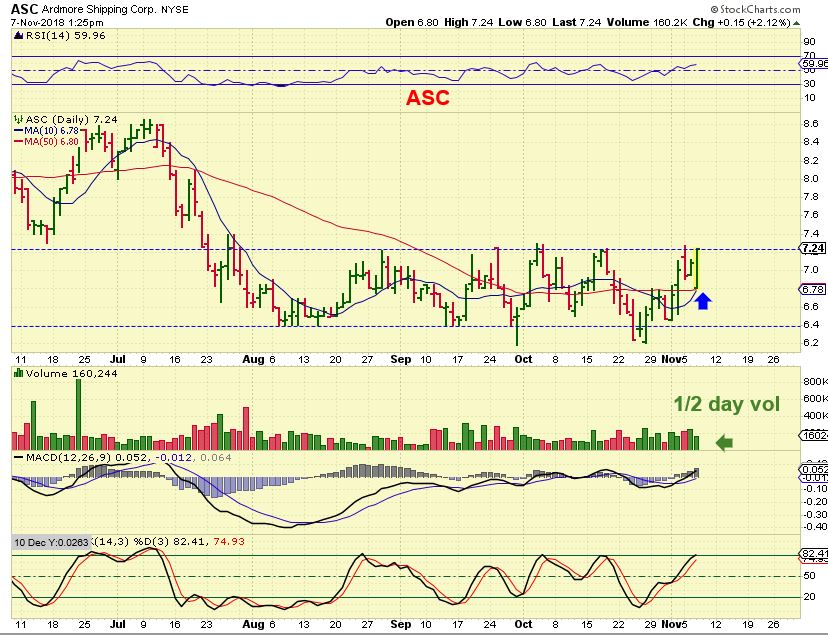
ASC – Look at the volume at the end of the day. I decided to take a position. They released earnings yesterday and conference called at 10:30, this may be ready to break out.
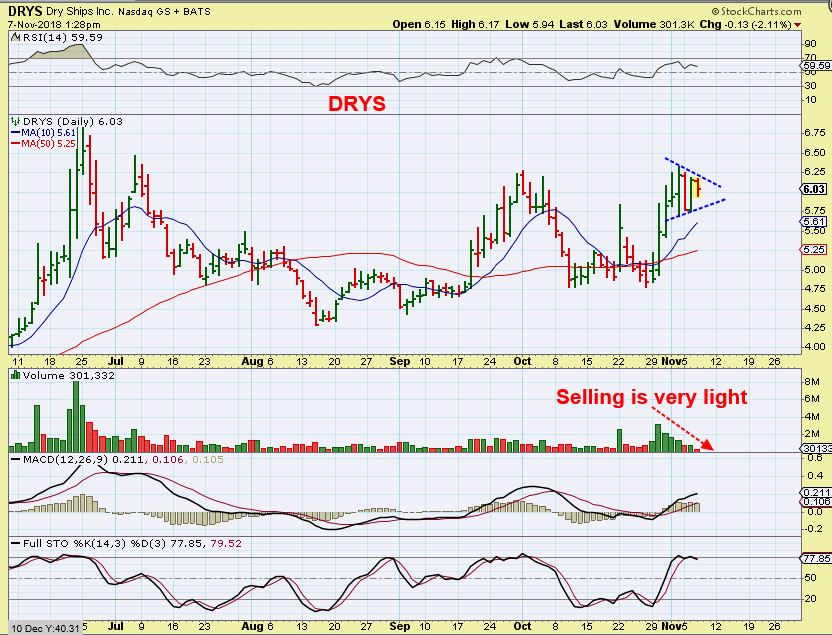
DRYS – Bull Flag? VERY light selling .
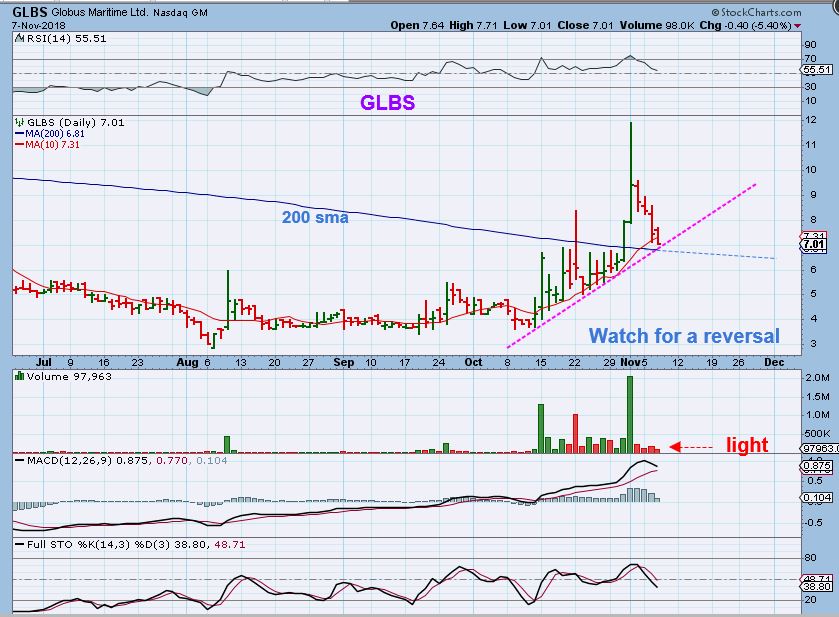
GLBS – Last week I mentioned that GLBS could pull back after riding this stellar run higher. The 200sma might be a place for a low risk entry, if Shippers remain bullish. Well…
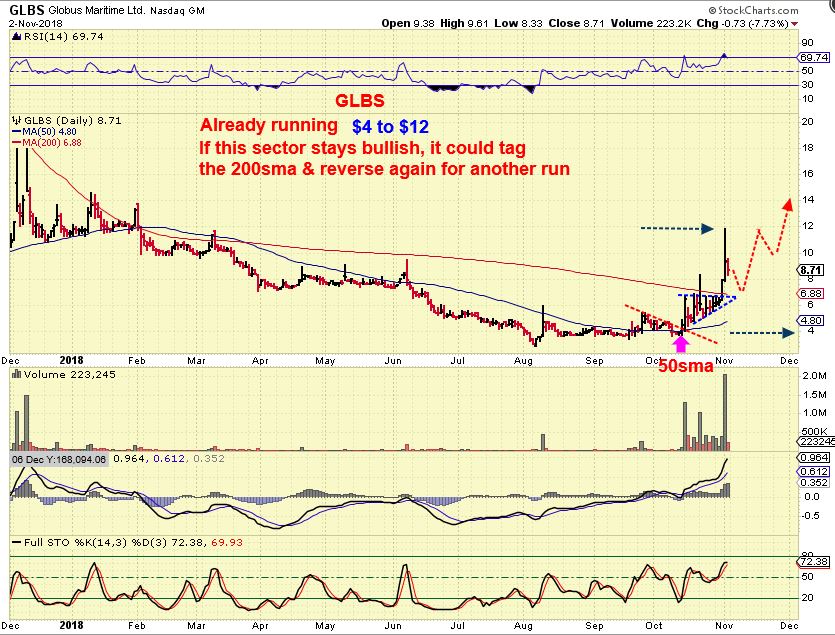
GLBS – It’s almost at the 200 sma, but I wouldn’t buy until I see a good reversal. We could see a ‘shake out’ or break down, but so far it has been a light volume drift lower.