November 8th – Friday
It is the Last day of the week and the Elections have passed, the somewhat non-event of the FOMC Meeting has passed, so now let’s just take a look at what we have going on…
.
SPX – We had a slight pause on day 8, so I have just drawn in a possible dip to an inverse H&S at the 10 sma as support. This is just hypothetical.
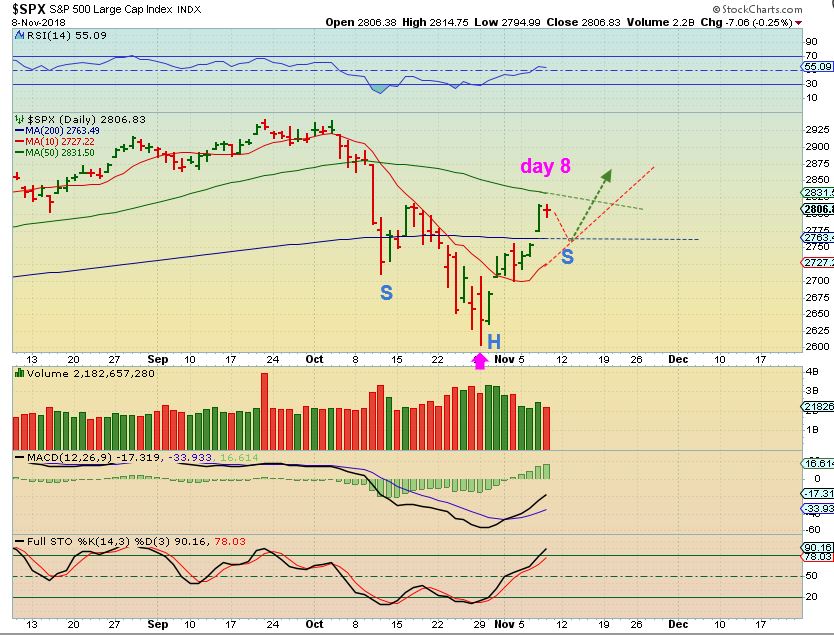
However here is another reason that I think we may see a drop in the General Markets….
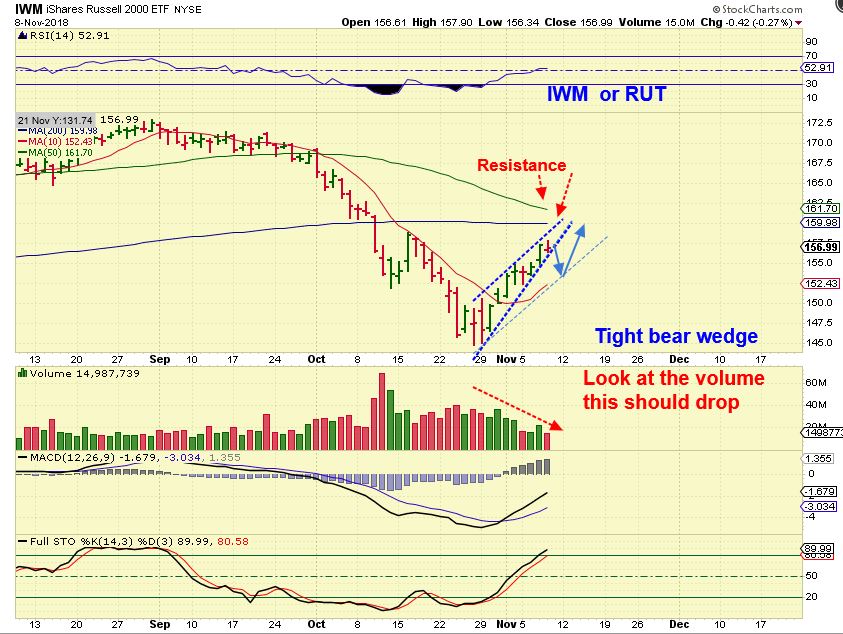
IWM – When I look at the IWM (or RUT) I see what looks like a bearish rising wedge. These usually break DOWN and it is approaching resistance on light volume. I would have to expect a pull back at or before resistance, but…
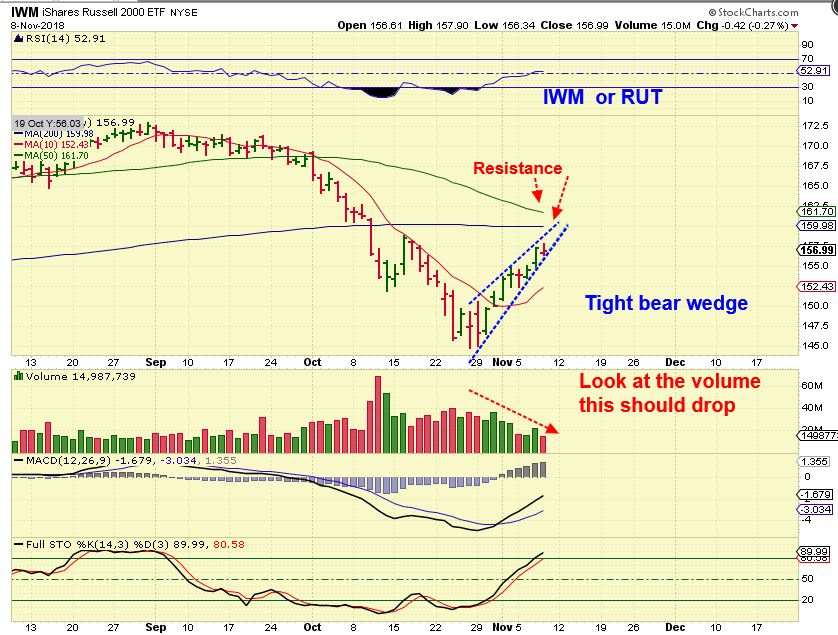
IWM – That doesn’t mean it has to crash. We may just see this for now, with the 10 sma below .
.
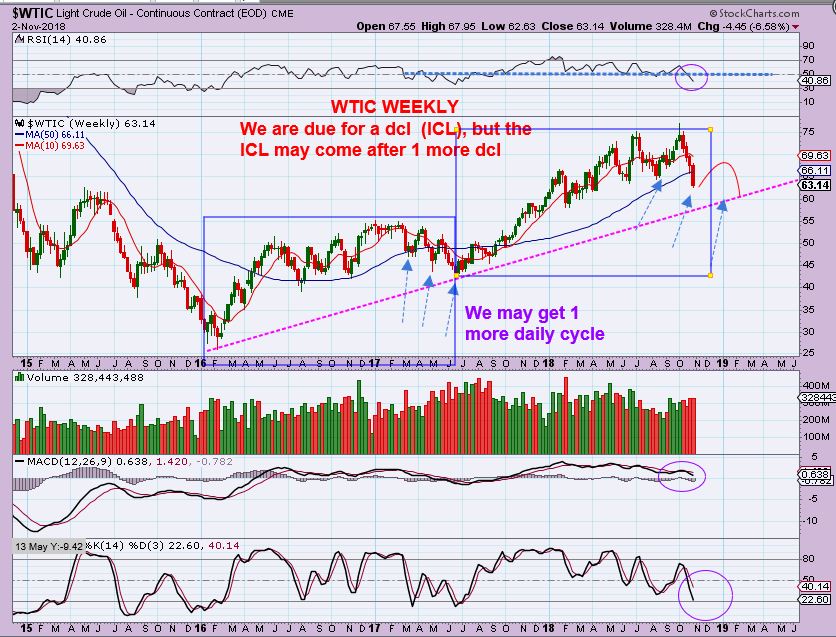
WTIC FROM THE WEEKEND REPORT – This is where I said that Oil may get down to the $60 Area, and we are already there now.
…Using this chart in the weekend report, I mentioned that we could get to the $60 area on the drop , but I thought that it also might happen after another daily cycle, similar to 2017. Currently we just dropped straight to $60, AND THIS IS WHY WE DID NOT JUMP IN YET. It is safer to wait for a proper swing low…
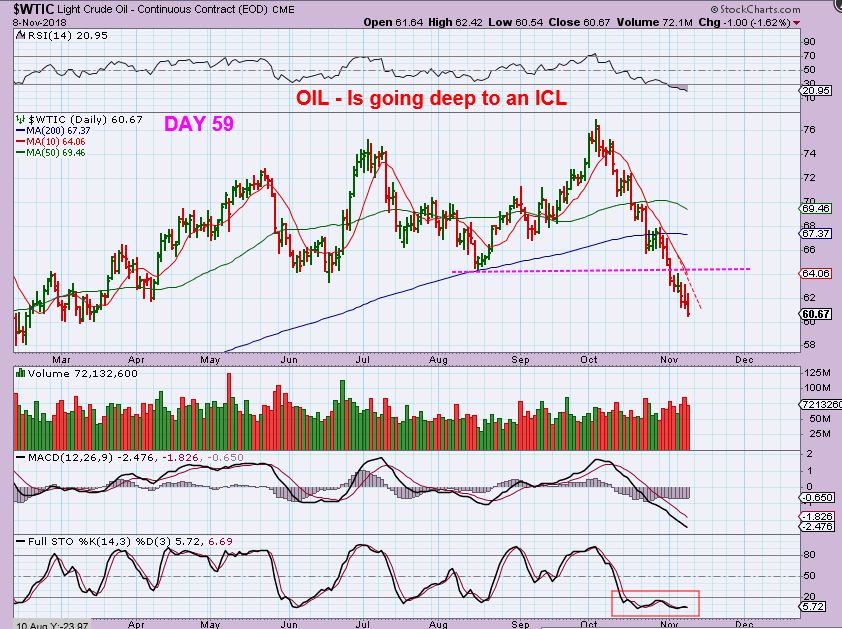
WTIC – Oil just keeps selling off, and we are on day 59. This is an ICL drop to $60 so far.
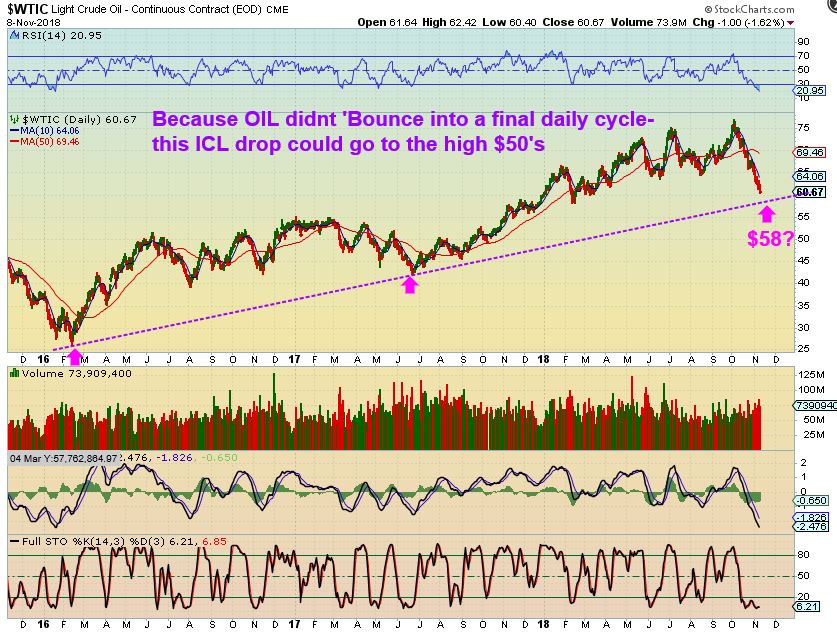
If Oil had bounced in a final daily cycle, it would have met the trend line higher near $60 a month from now, but with this straight drop down, it can go right into the upper $50’s.
.
USD – This looks like a DCL after the FOMC Meeting. The Good news is that THIS pop in the USD happened and GDX closed Green. This may Peak by day 8 or so, and be a Left Translated daily Cycle. The 4th & 5th daily cycle would be rolling over lower into an ICL, but so far, the USD is bullish and has been bullish – but it has not caused a Gold Sell off.
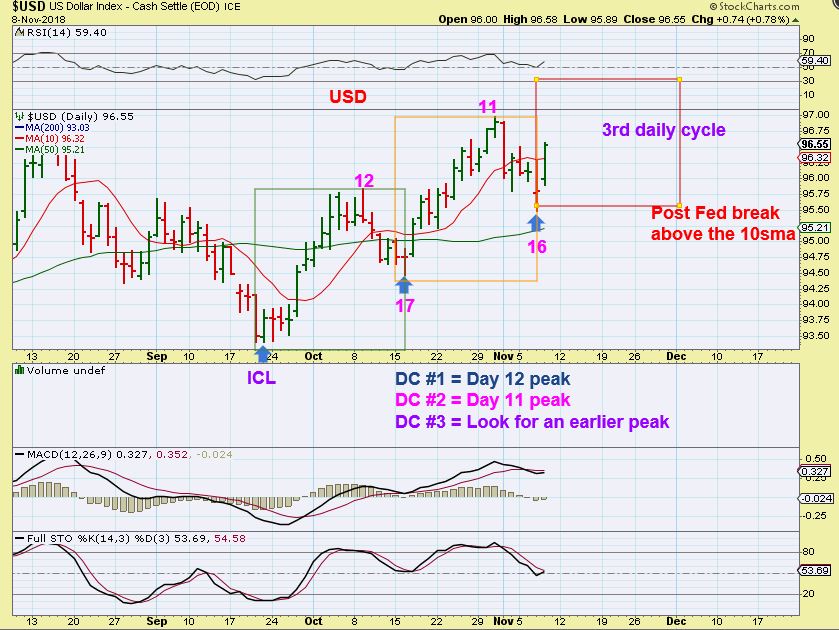
Note the USD has had a solid rise since September in the above chart. Gold has actually moved higher too.
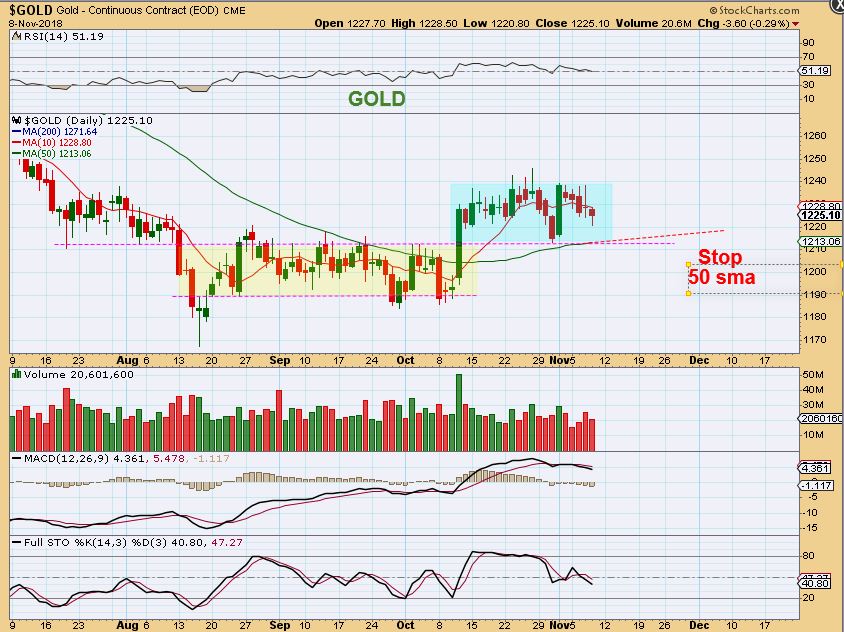
GOLD – We saw that the USD had a big reversal and Popped higher after the FOMC Mtg, yet Gold & the Miners did not drop to the same degree. This remains a base on a base so far, and is above the 50sma.
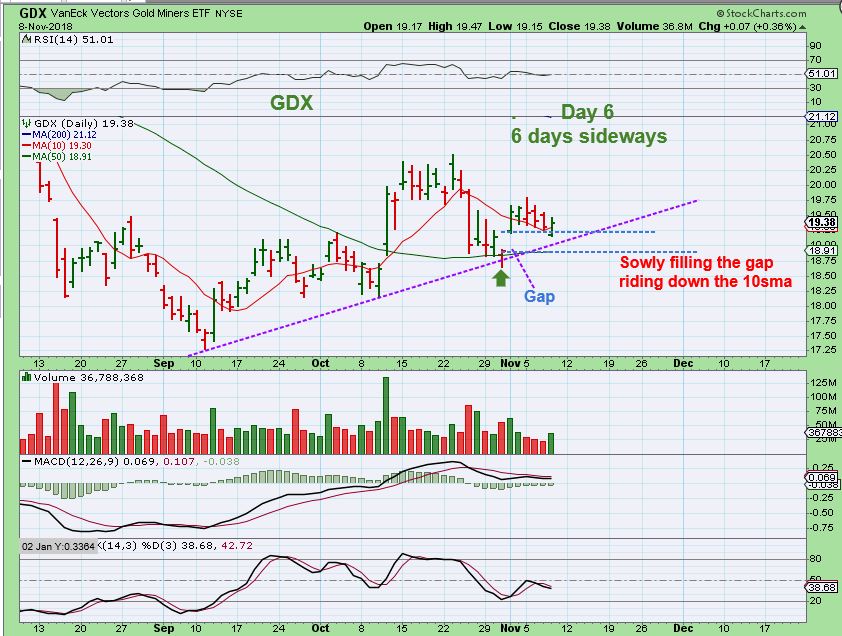
GDX – GDX reversed and closed green.
And that is where we stand on Friday after a busy week. Volatile and choppy markets are tough to trade, especially for the Buy & Hold group, but this too shall pass. For some, it may be best to keep position size smaller and cash on the sidelines, patiently waiting for the better set ups. Others can take trades as they present themselves, and scalp them or ride them as long as time remains favorable (SQ, SAIL, MU, CY, etc, had been decent trades out of the lows, for example, because an ICL has been put in place/ Earnings dropped SQ & SAIL to the 10sma yesterday, so now they need to recover or buyers could get stopped out).
.
It is encouraging to see that such a strong rise by the USD out of an ICL did not push Gold or the Miners lower. Let’s see what Friday brings our way, and I will cover everything in more detail in the Big Picture weekend report.
.
Enjoy your Friday trading!
.
~ALEX
.
For the Watch list or for future trade possibilities : The various ‘Metals’ sectors have been selling off for a while now. At times, there have been indications of ‘bases’ trying to form, or bounces that may indicate a change to trending higher, but many have been proven to be false starts along the way.
The metals stocks could be trying to form a base, anticipating the coming drop of the USD. In the recent past, we’ve looked at HBM, X, AKS, CLF, ETC. Let’s take another quick look in the Metals sector, just in case this sector becomes more bullish after the USD peaks and begins to roll over into an ICL drop.
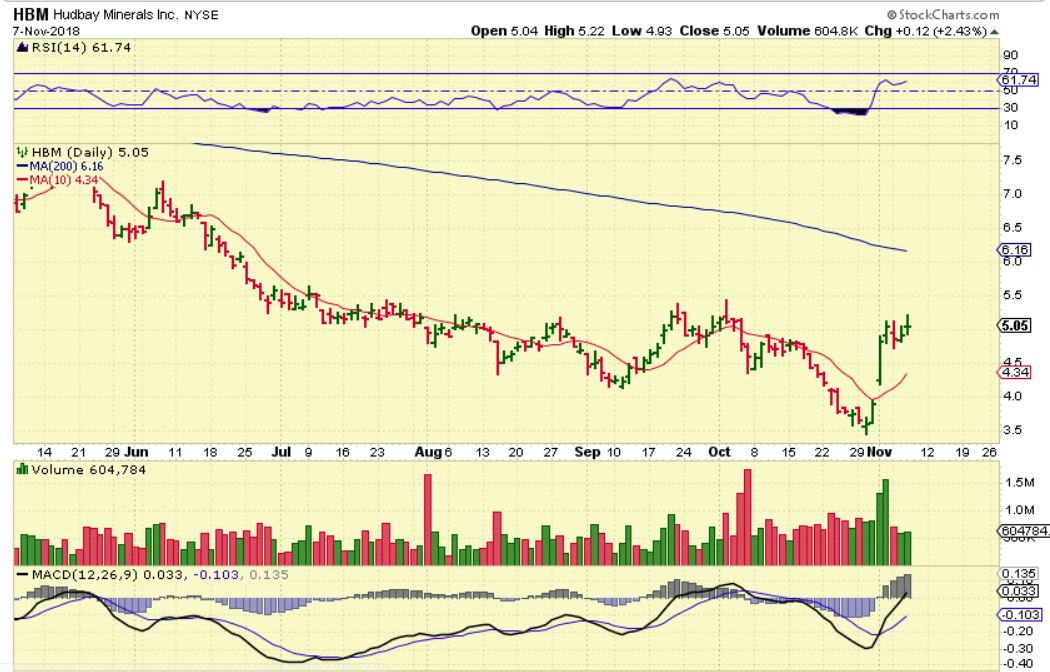
HBM – This copper stock had a stronger than usual Pop and may have a bull flag or ‘pause’ before higher price to the 200 sma. I would look for a higher low and higher high to begin taking place.
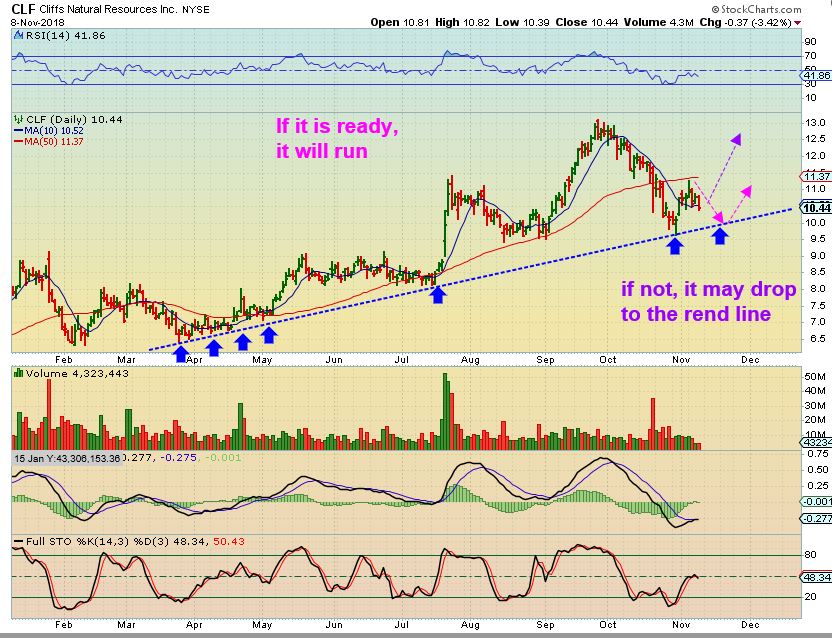
CLF – CLF broke its short term down trend and is back testing that trend line, but closed below the 10sma. It could ride down the trend line to $10. Why do I say that?
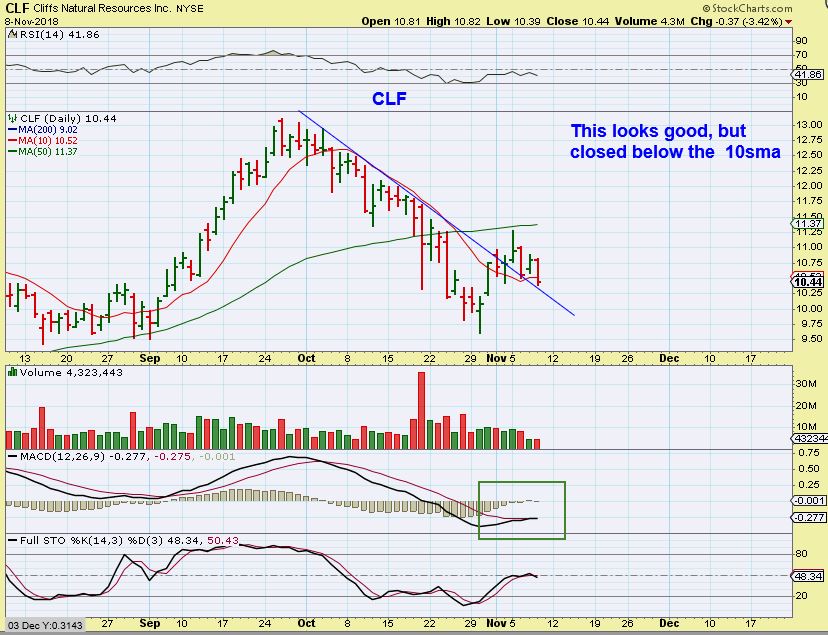
CLF Bigger Picture – As mentioned in an earlier report, CLF has actually been a buy & hold for a while, but it is NOT an easy ride. It revisits this trend line from time to time. This looks like it can reverse here at the 10sma, but it also may drop & bounce off of the trend line at $10 ish as the USD bounces into a peak.
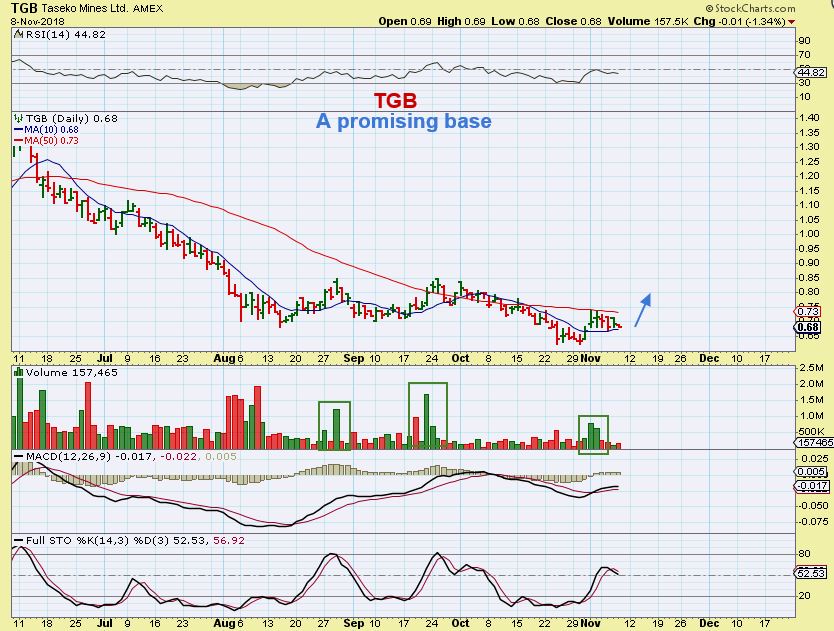
TGB – This copper stock is starting to look like a good base with bullish divergence and bullish set up. A close above the 50 sma would be a great start. So we can keep an eye on the Metals sector going forward too.
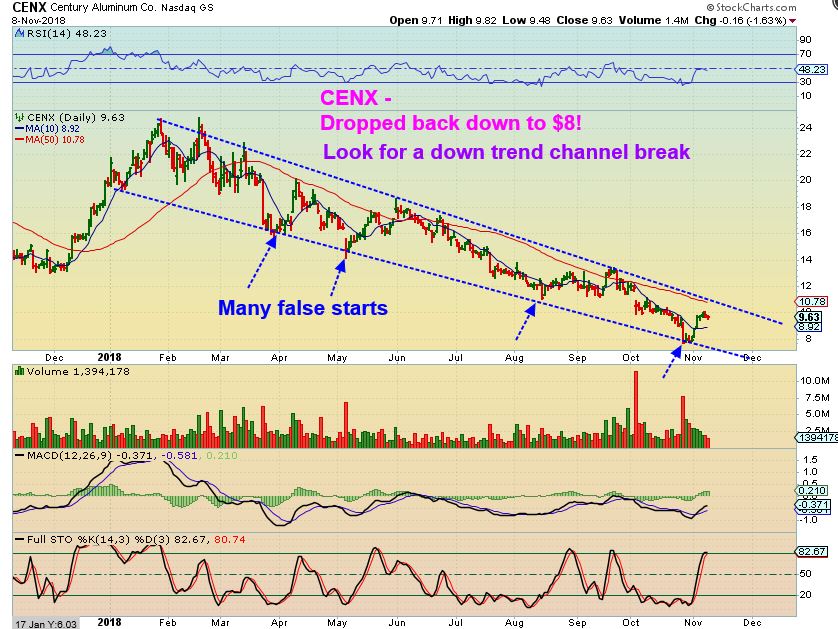
Aluminum Stocks like AA and CENX have been selling off all year long, after a rally into the end of last year. If Cenx can break above the down trending channel, it may start to trend higher or base out too ( This is NOT ready to buy, but it had a strong POP in November too).
Many MJ STOCKS SOLD OFF Thursday – I think that some may just be dropping to the 10 sma. let me show you why I think that.
.
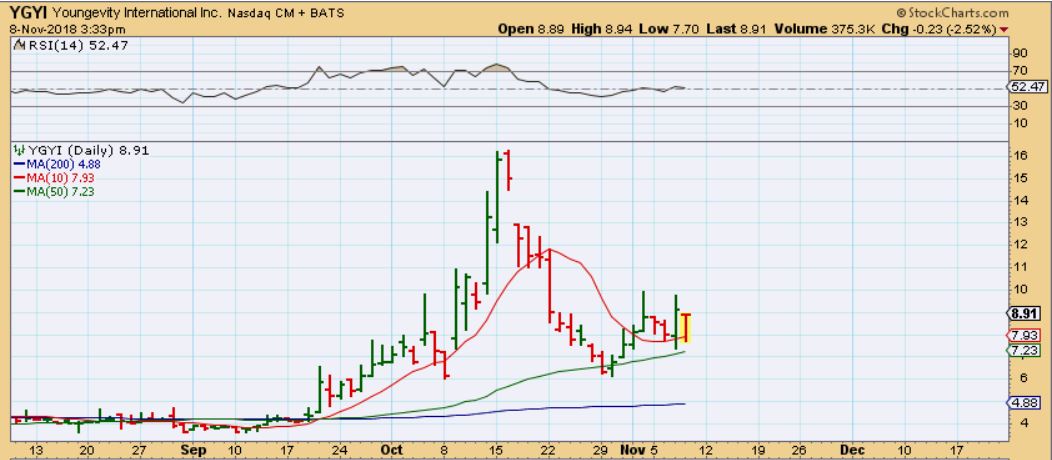
YGYI already dropped down & tagged the 10sma by Thursday morning– This was down big (12% which was $1.45 at one point).
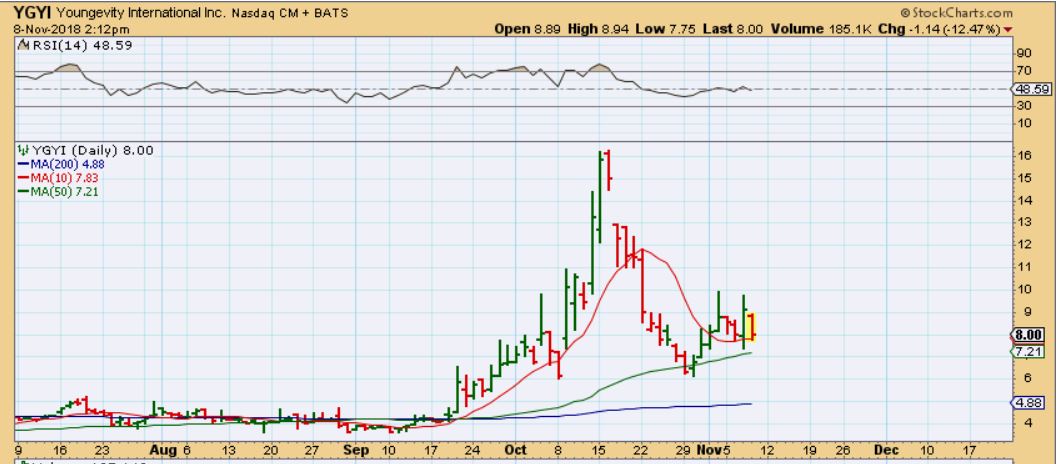
YGYI at 3:30 P.M. – It reversed off of the 10 sma, and was only down 2.5% at 3:30, so the 10 sma could be an area of support.
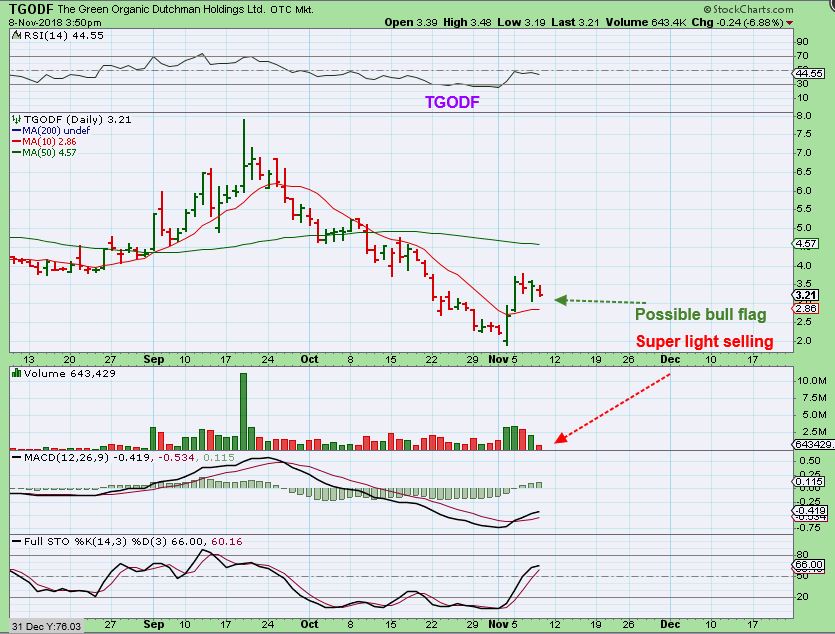
TGODF – This may be a Bull Flag above the 10sma.
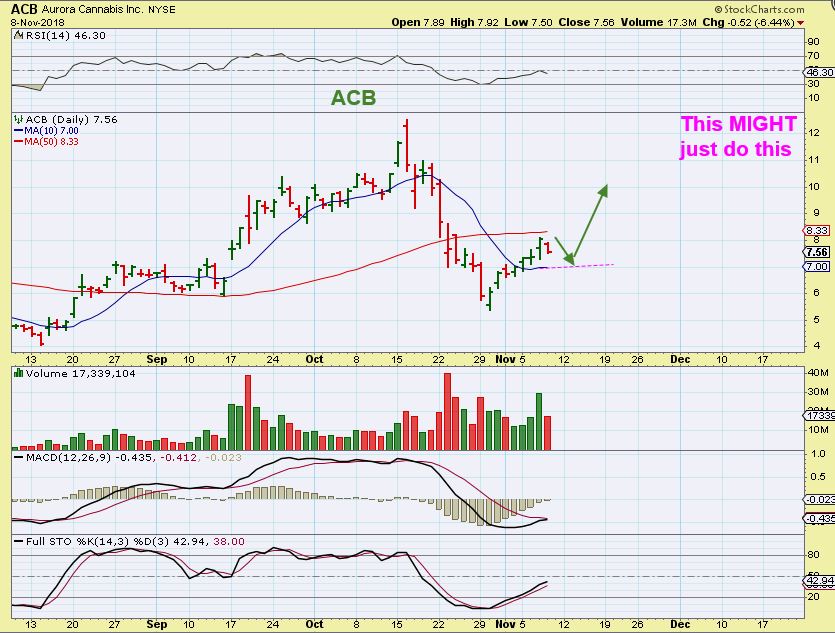
ACB from Nov 7 – I bought this as it moved above the 10sma, and I drew this possible tag of the 10sma on Wednesday morning. It didn’t keep dropping though…
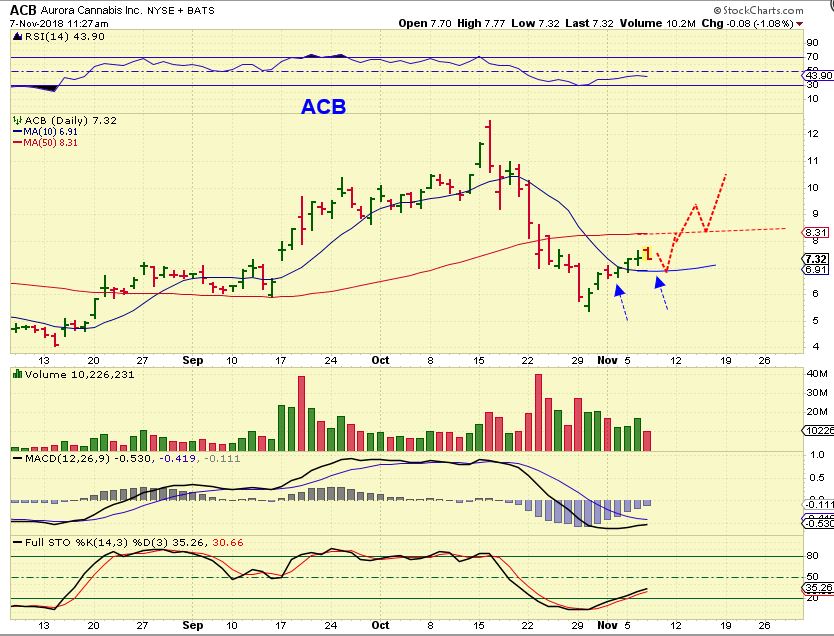
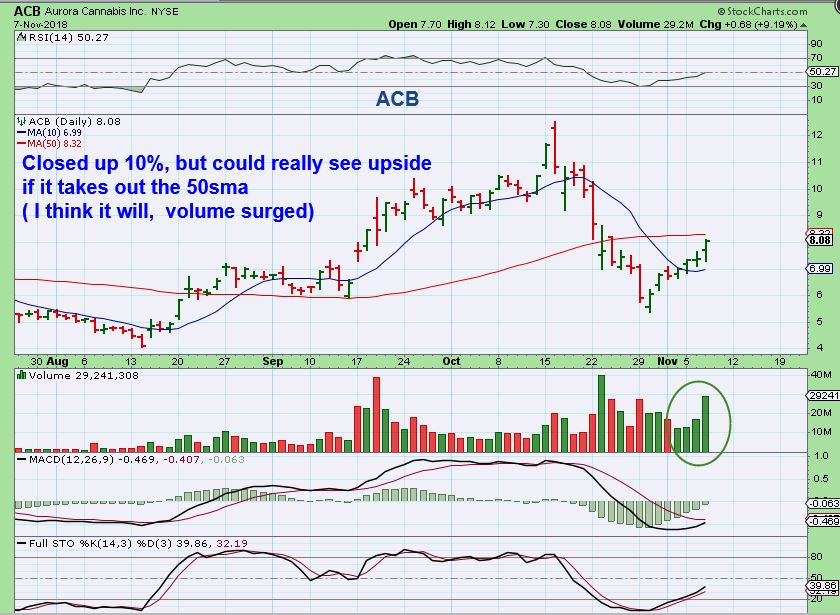
ACB – After Jeff Sessions resigned on Wednesday, ACB reversed higher & closed near the 50sma but…
ACB – Thursday did see it dropping again, so I will assume that it can do this, and watch for ( Hope for) support at the 10sma again.