November 6th – What’s Up?
I’ll tell you what’s up…
It looks like it may again be time to talk about those stocks that are still threatening big growth in revenue. That would be the Medical Marijuana (and now legalized recreational MJ STOCK). They are growing, and even with the recent sharp sell off, many look to have quickly stabilized and are trying to set up and run again. I will discuss that and several other trades in this report, but first,
.
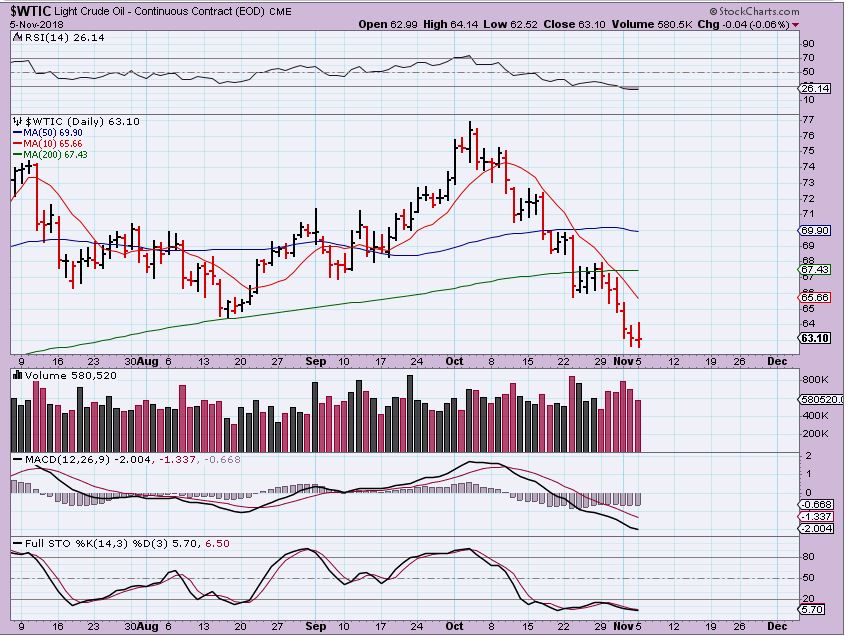
The Various Market Sectors have hardly changed from the weekend report, so there really is no reason for me to cover them again. What I reported in the weekend report still stands, with just a couple of noteworthy Points. Let me start with OIL. We are due for a DCL, so..
WTIC – You can see that OIL is possibly starting to stabilize and we are due for a swing low, but…
XLE – Some of the stocks do seem to be ahead of Oil, so that could be noteworthy. I do see this as a bit of a bearish rising wedge, but the arrow could be a higher low as Oil puts in its low. Something to watch anyway, and some of the Oil or Energy stocks started looking interesting.
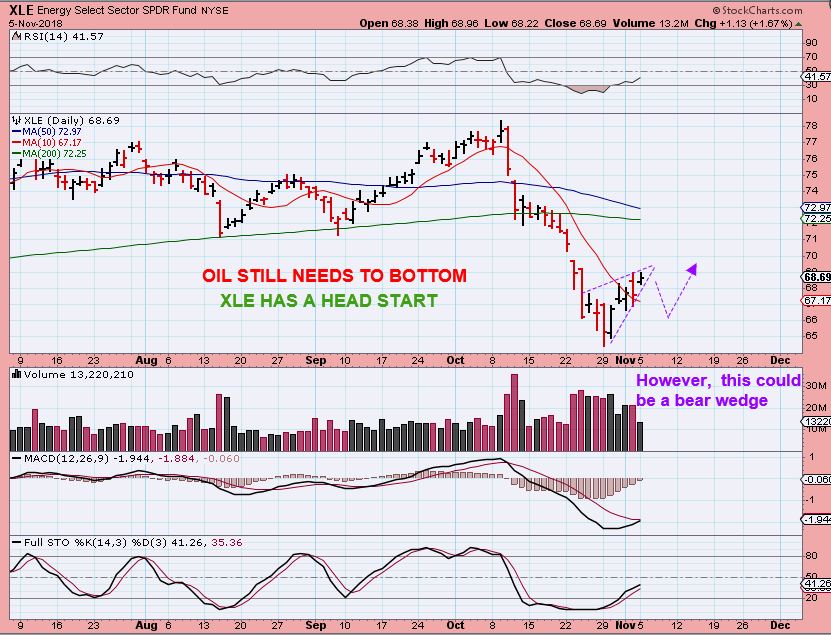
For example, look at WTI, DQ, OAS, HK, and others. They are NOT selling off with Oil anymore. WTI bounced right off of the 200 sma and is already trying to recover the 50sma.
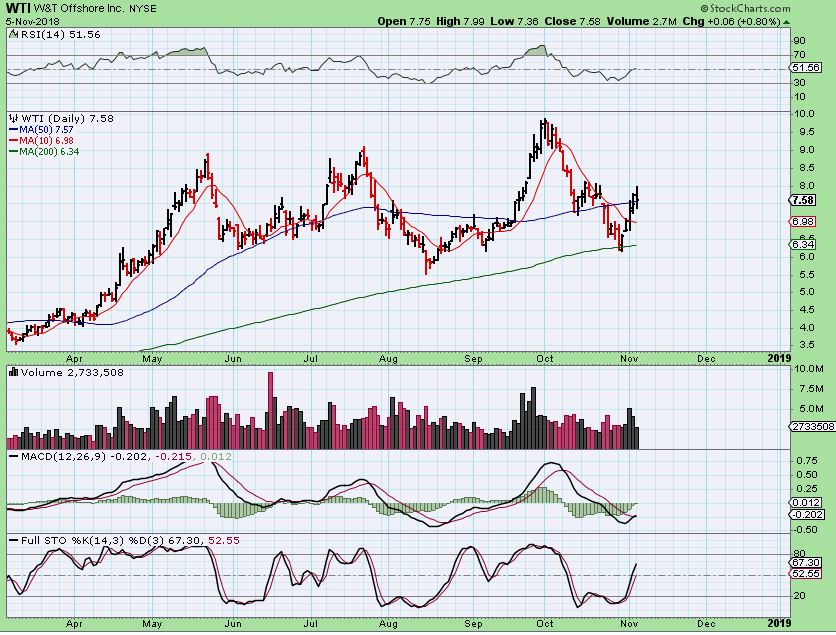
Summary: I AM NOT TRADING THIS OIL SECTOR PERSONALLY RIGHT NOW, however Some Oil / Energy stocks can be considered low risk, since a stop can be placed right below an entry and OIL is due for a swing low anytime now. UWT is also a candidate when OIL swings higher for a quick trade.
.
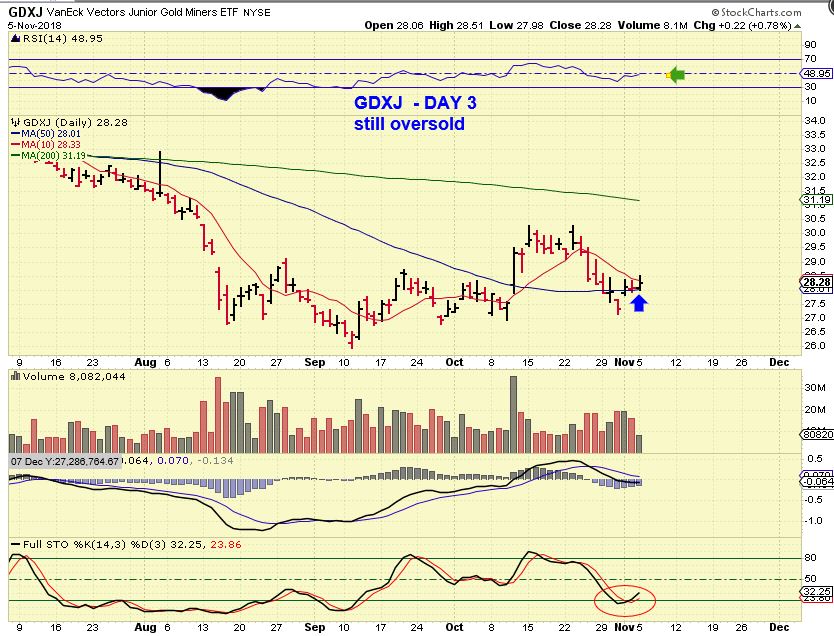
Some readers get concerned when Miners do not take off and run right away, so let’s take a quick look at GDXJ. We’ll call this day 3, it remains Oversold, Sits above the 50 sma, and just needs a push of buyers to drive it higher. GDXJ closed up 22 cents.
.
REVISIT URANIUM
.
RECENTLY I DISCUSSED THE URANIUM LONG TERM AND SHORT TERM BULLISH SET UPS
.
With this chart last week, I mentioned that I bought NXE as it broke above the 50 & 200sma. I also showed UUUU, DNN, etc short & long term charts…

NXE – After just steadily climbing higher day by day, On Monday, Uranium Stocks exploded, and this was NXE. Did I sell this pop? No, because…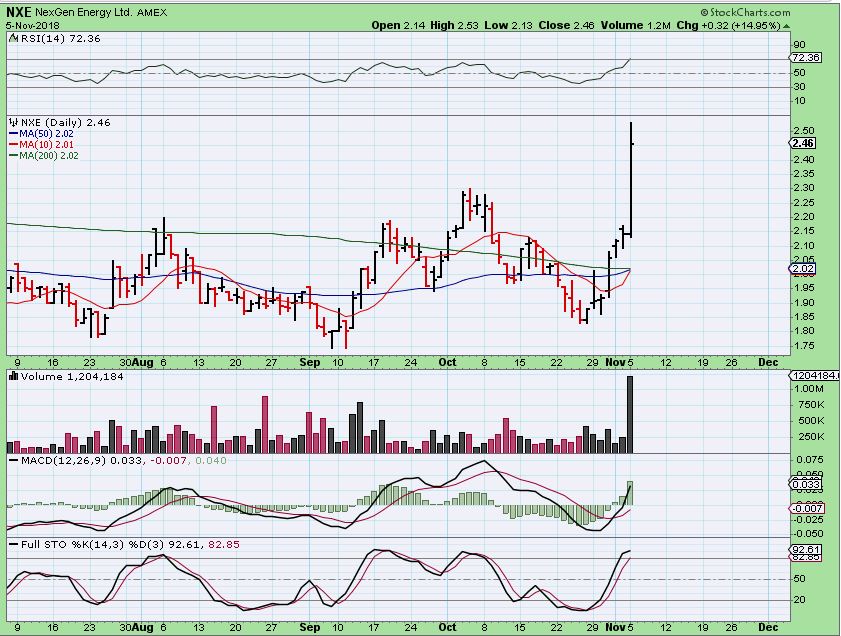
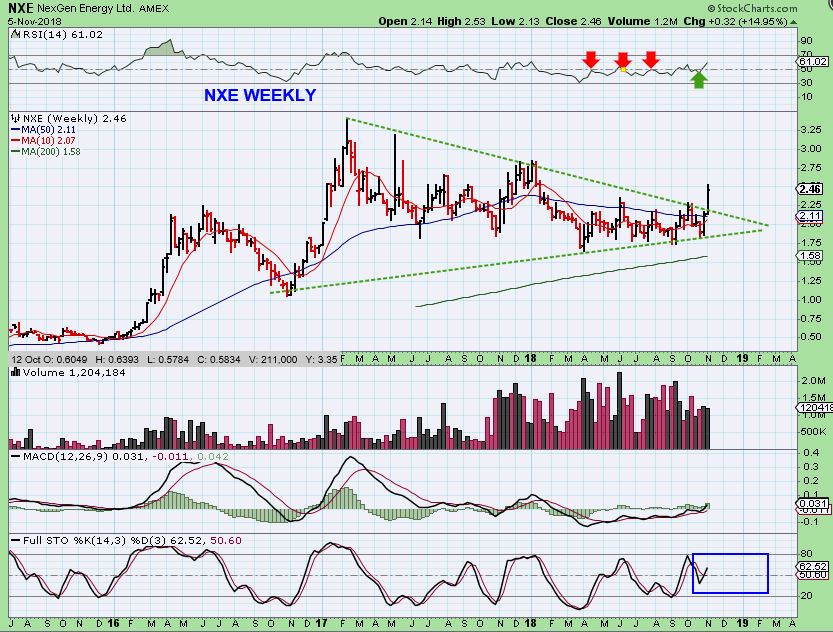
This is the LONG TERM NXE chart. I am not selling, just in case this wants to keep running. Do notice that in the past on this weekly chart ( see the last run higher), it did have a big week, a red week, a big week, and a red week, so it didn’t go straight up last time, but was worth the way.
On Oct 31, I posted this break higher by UUUU above the 50sma with Big Volume.
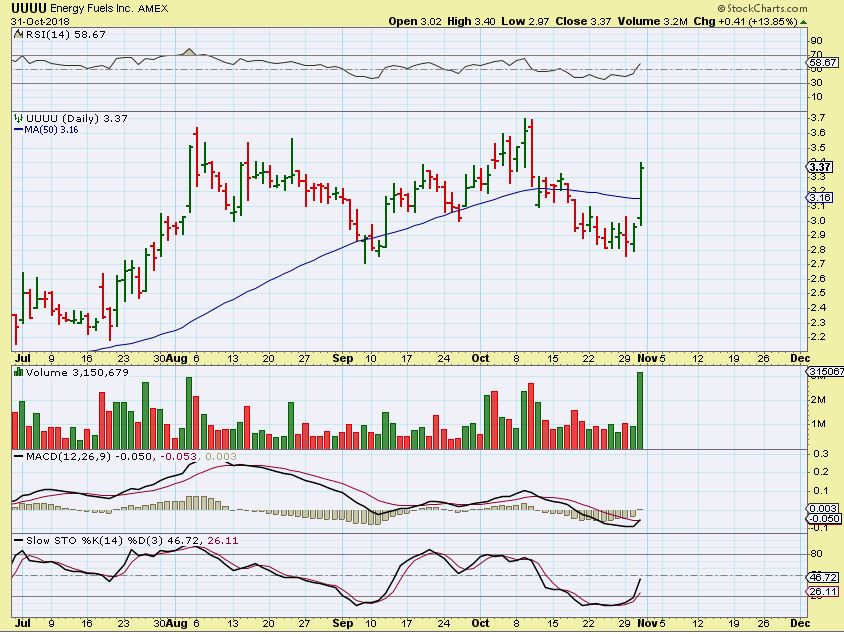
It too just slowly moved higher day by day & then BOOM. Monday was a BIGGER break and even Bigger volume. The Uranium stocks are busting a move.
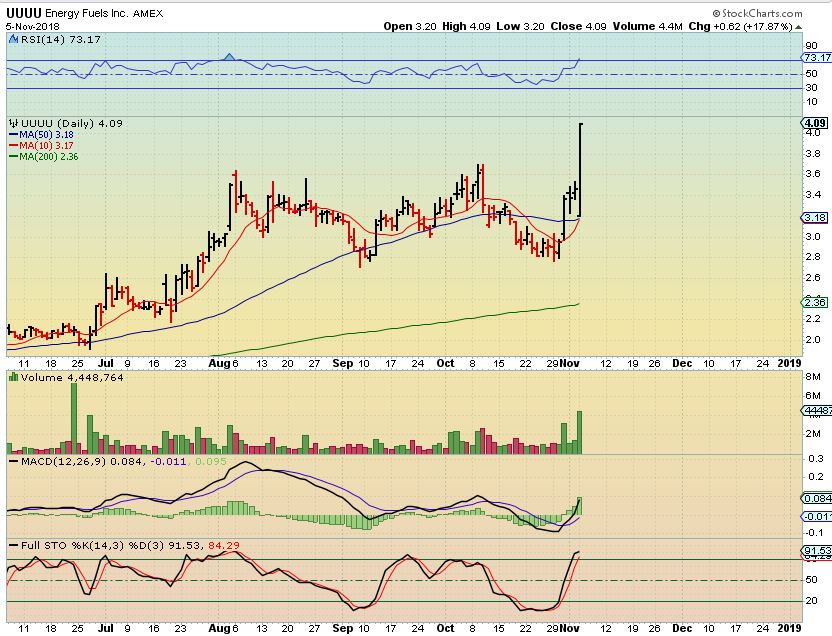
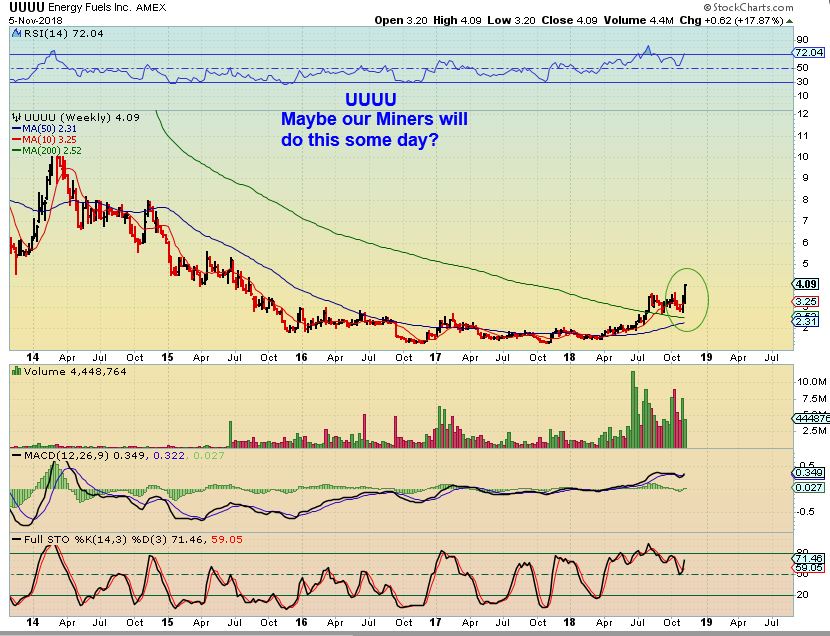
UUUU – And the Big Picture is still very promising too.
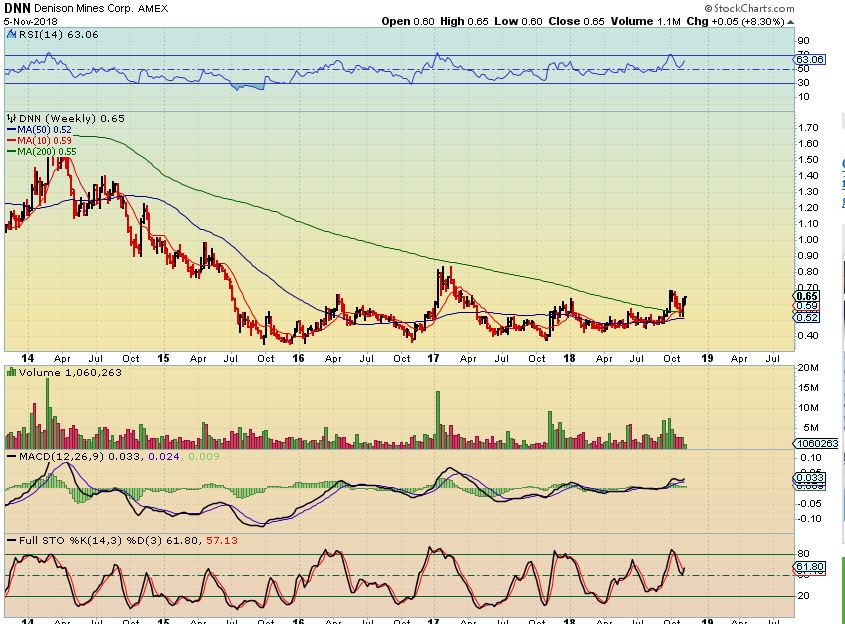
DNN – On Oct 31, I pointed out that DNN also had a big pop above the 50sma. What happened next??
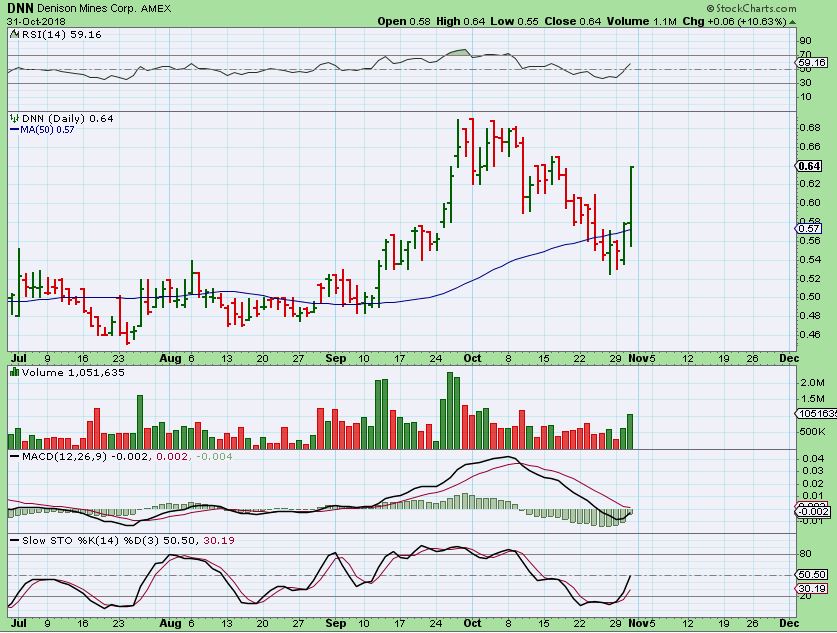
DNN – It actually dropped for 2 days and then Monday surged higher, but this can go much higher in my opinion. (By the way, if Miners POP, and stall, remember these charts ) …
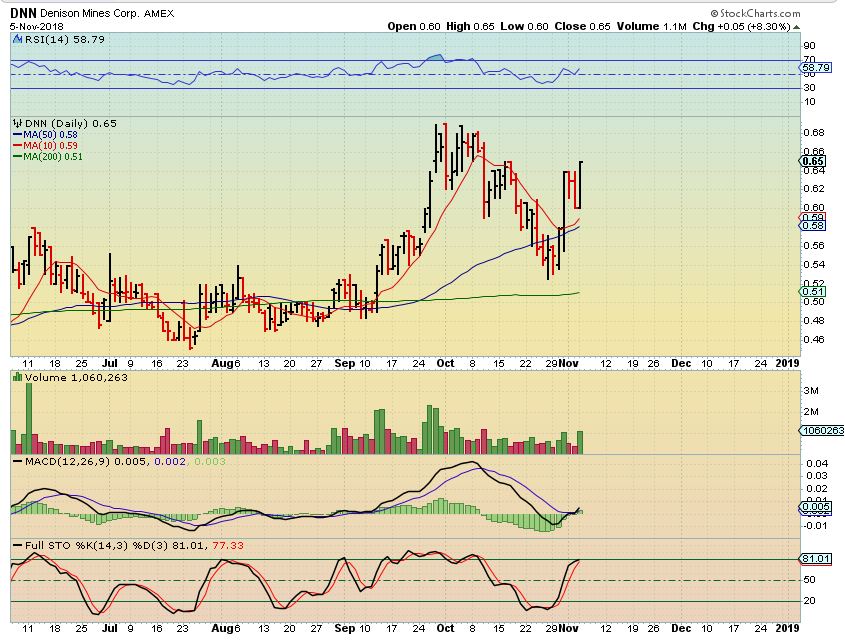
DNN – This is the bigger picture. Very promising as it breaks from a base and above the weekly 200 sma & 50 sma & both have been back tested.
URA is the Uranium ETF, 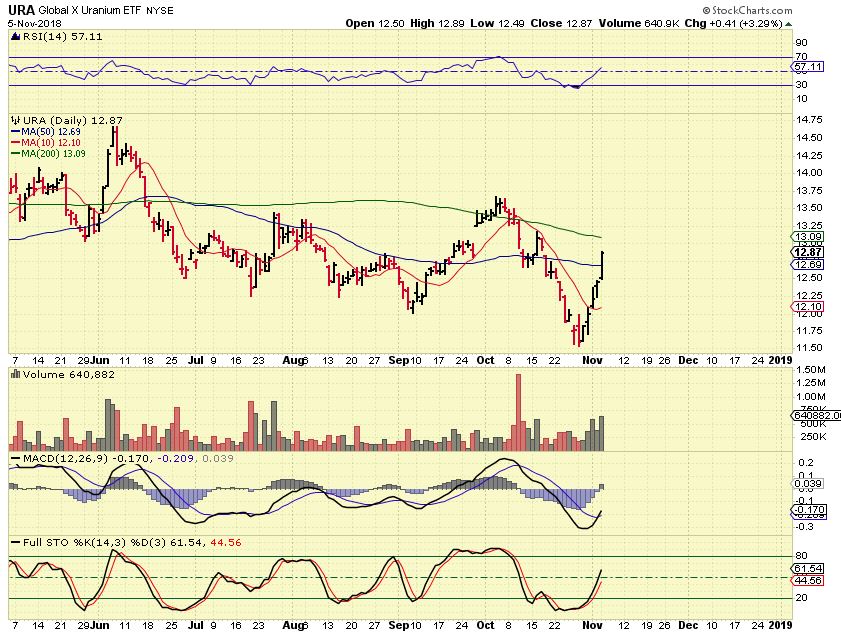
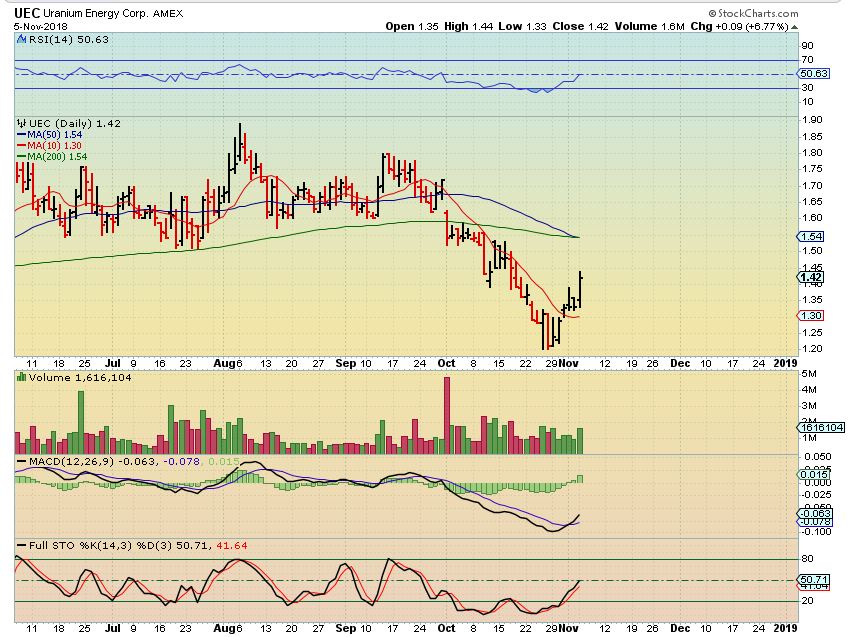
…and UEC & URG are also just getting going in this sector. This may be the next one playing catch up.
.
MJ STOCKS –
Note: I have repeatedly warned about the great risk / Reward of this sector. It simply moves very fast and any bad surprise can take price down quickly. That said, they do also move higher 10-50% per day. please use caution & control risk with position size.
.
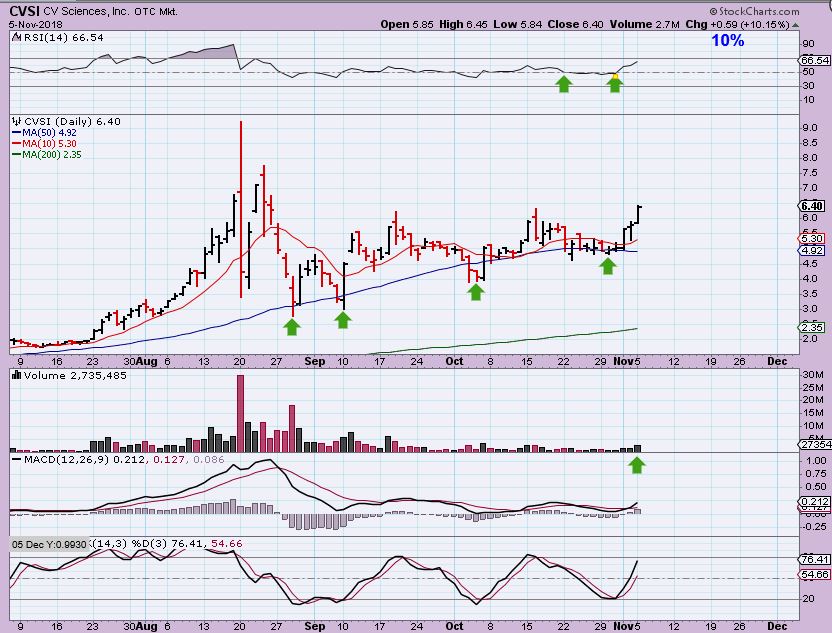
CVSI – I mentioned that even with the “Sell off’ in this sector, CVSI held up around that 50sma, so I bought it. This is a bullish chart pattern.
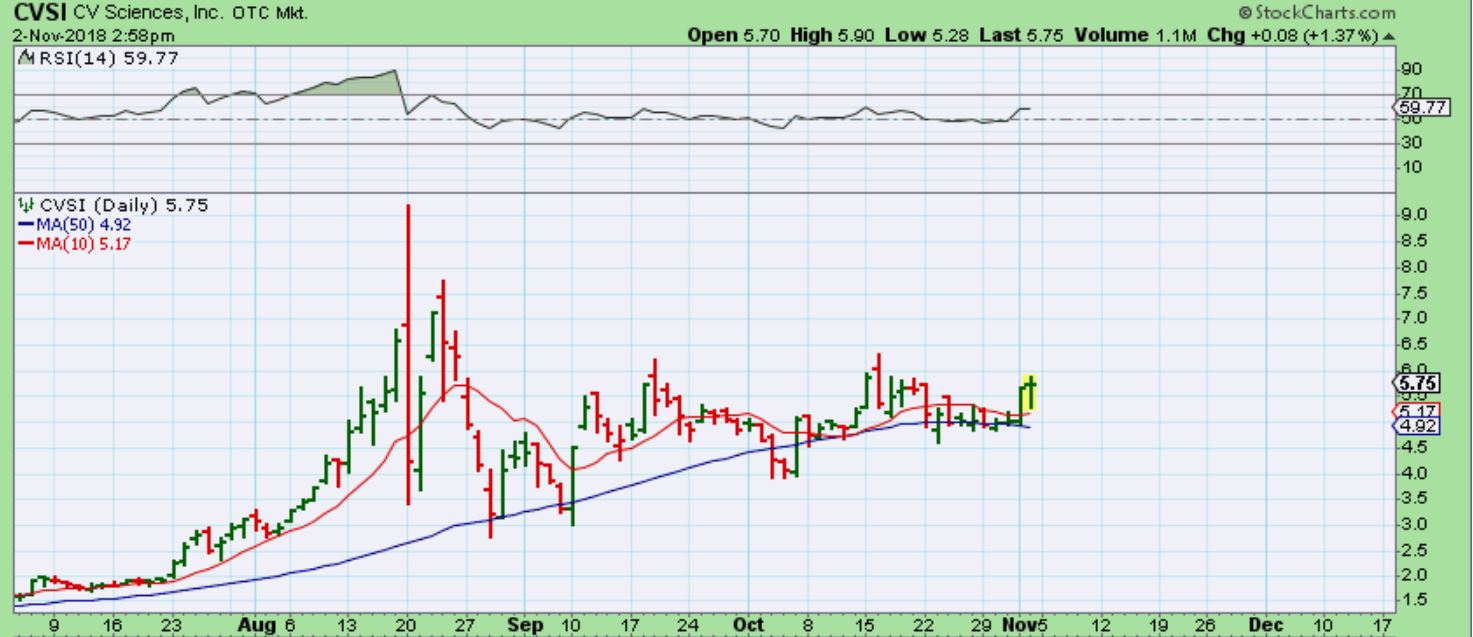
CVSI – It continues higher
TGODF – I also said that I bought this as it was rising, because it was a bullish engulfing at the lows with good potential.
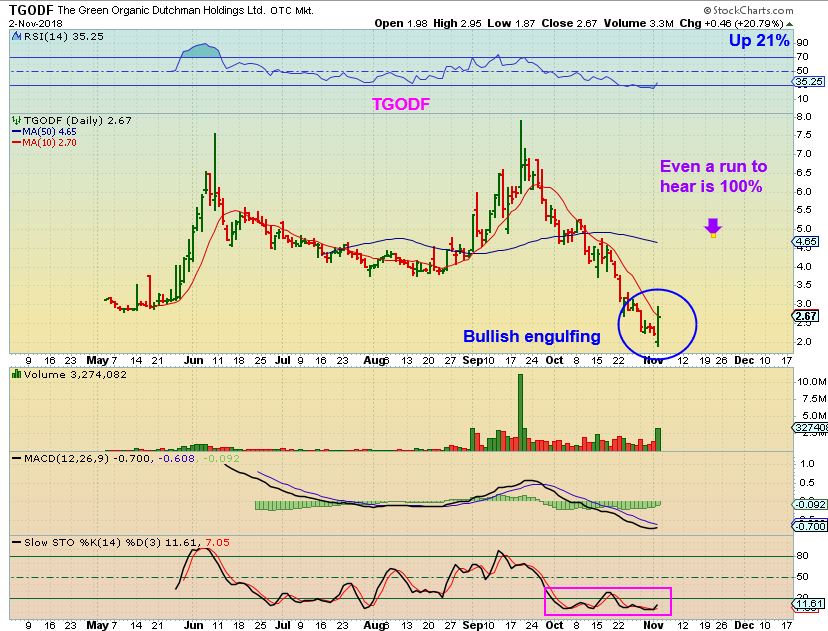
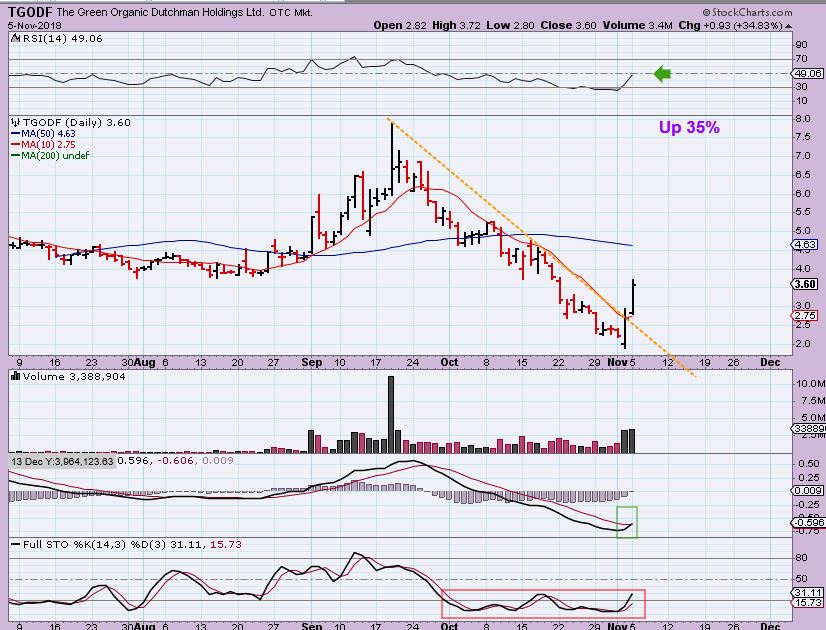
TGODF – It was up 35% Monday.Several have been moving off the lows, and just ran staright to the 50sma and even broke out.
PLNHF– Tammie mentioned this stock, and I actually loved this chart pattern.
1. Steady on the 50smaI
2, A long sideways consolidation, not a sell off t was already up 10% when I bought it, but you can see that it ran higher and sold off.
3. Big Volume
but why would I buy it if it already ran from $1.6 to $2.30 in 3 days? I bought it as it sold off to $2.30 knowing that it can be bought back by the days end. This set up was very bullish, and …
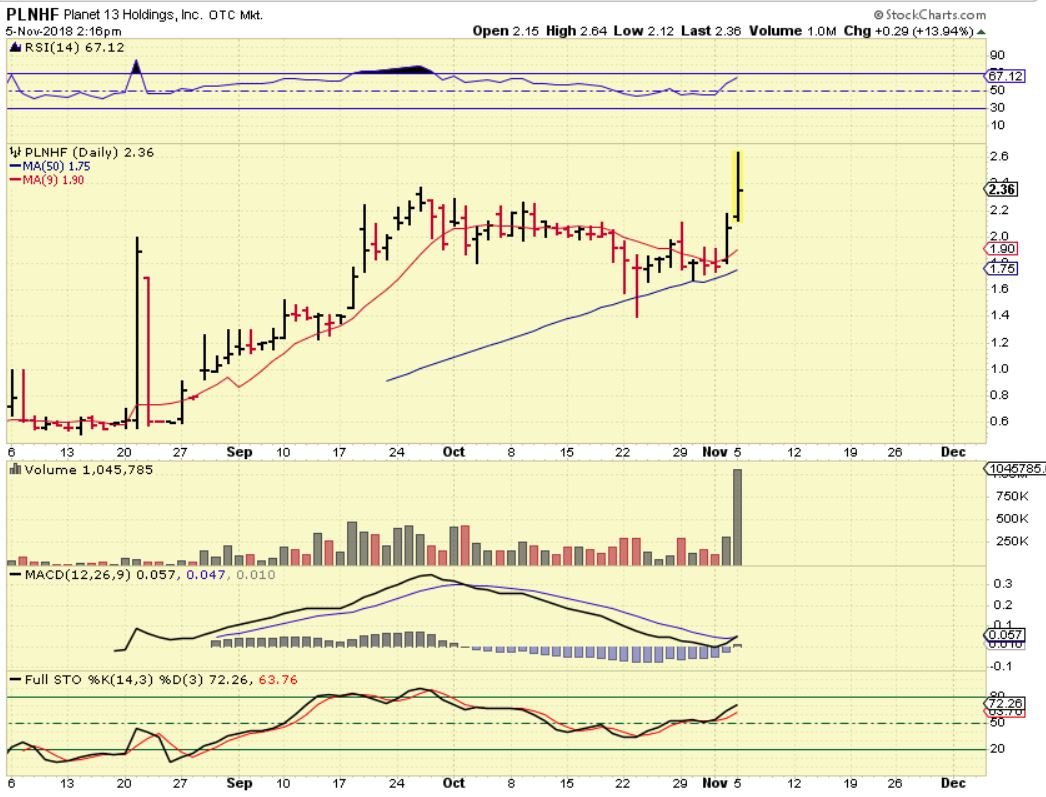
PLNHF – And it closed up 24%. I is at new all time highs, and that is bullish. As a measured move (and with that volume), it does have a target of $4.20 or more, so even though it was already up- This One was buy-able.
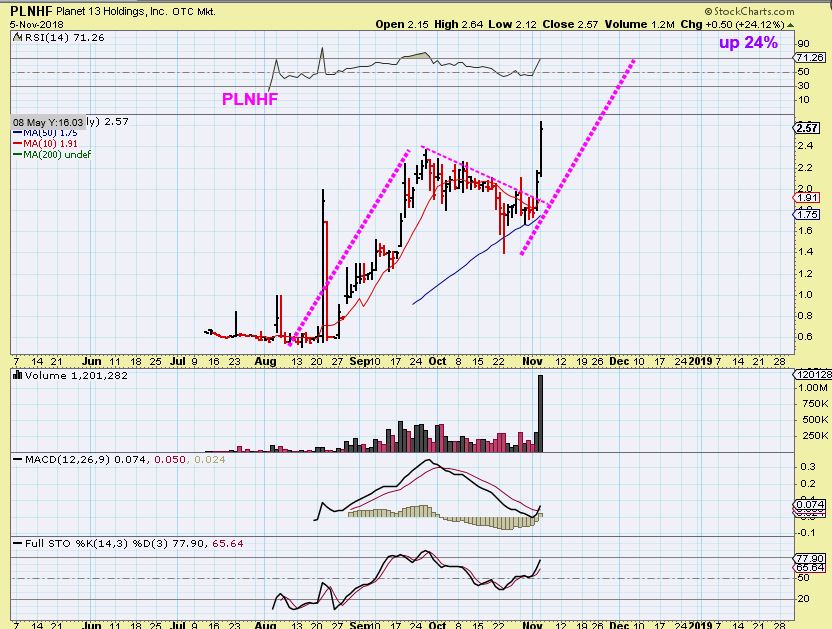
NOTE: THAT PLNHF CHART ABOVE WAS SPECIFICALLY BULLISH OVERALL. I WOULD NOT JUST BUY ANY STOCK UP THAT MUCH, YOU CAN GET CAUGHT IN A DOWNDRAFT.
.
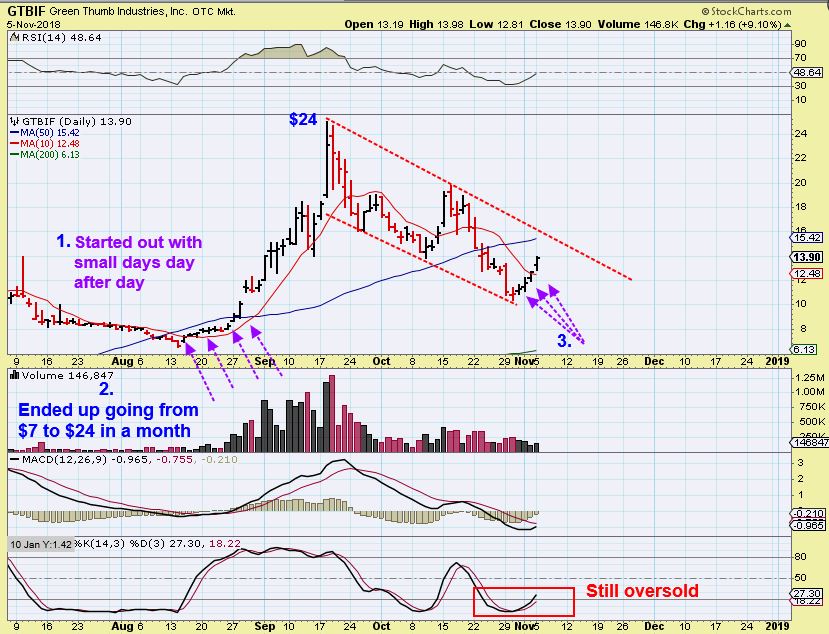
GTBIF – This is an example of what I see many MJ stocks doing now. At first glance, I would expect a ‘Bounce to the 50sma”, but as you see, many of these are breaking out again. Can you see how this slowly ran higher in August to the 50sma, and then ramped up? I’m wondering if We may see the same ( read the chart). This tiny move is already $10 to $14!
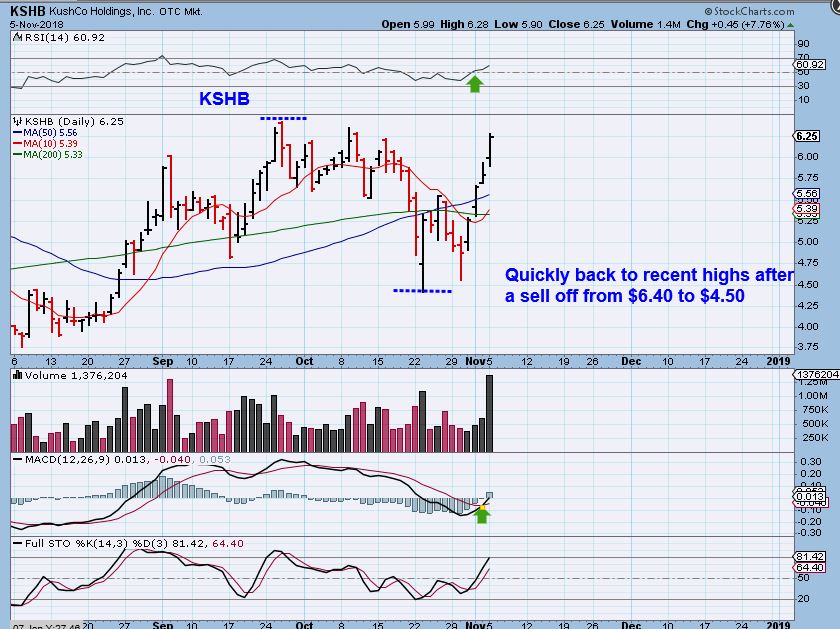
KSHB – KSHB crashed below the 50sma in the recent sell off, but suddenly, the sector got heated up again, and it ran from $4.50 to $6.40 in 5 days. That’s not all…
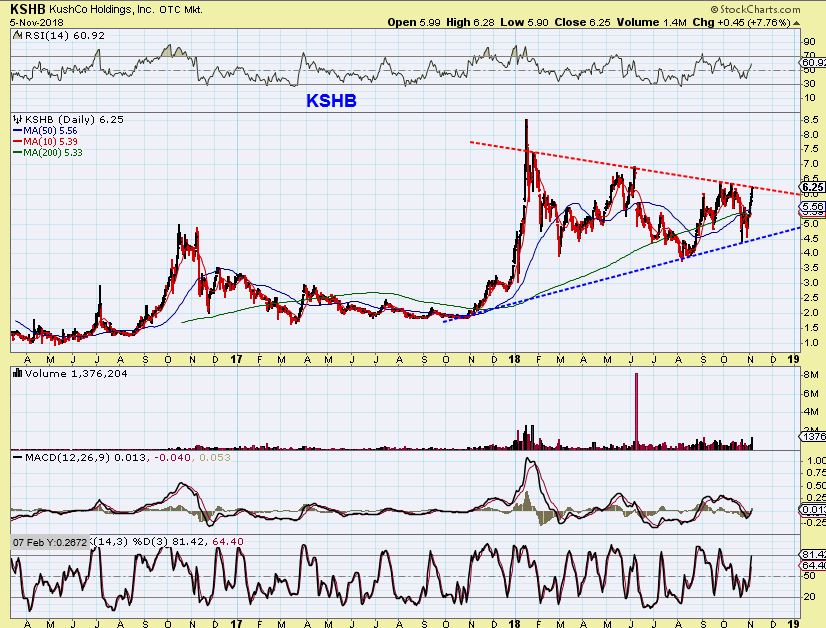
KSHB – I always like to look at the big picture of these, and you can see that KSHB is a bullish triangle, heading for all time new highs. Let’s just say that you held “Buy & Hold’ from last Oct lows, that was $2 to $8.50, but what a bumpy/choppy ride these can be! It is now at $6.25 and could break to all new highs soon though.
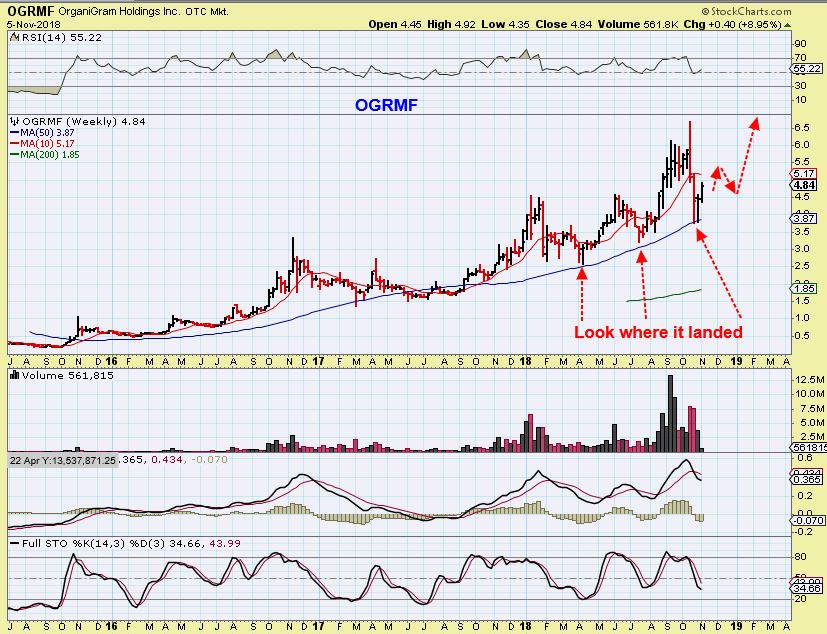
OGRMF – Another long term bullish chart, but VERY difficult to ‘buy & hold’. It has now bounced off of the 50 week moving average after a steep 2 week crash.
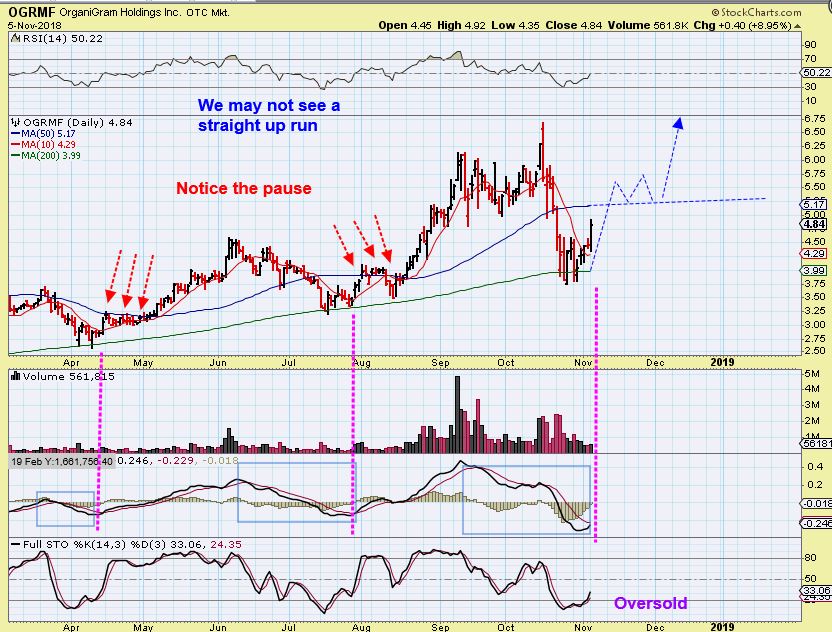
OGRMF – This was the crash on a daily chart and it is just now starting to move higher, up 9% yesterday. Please read the chart, it is difficult to tell if this will meander higher or surge higher.
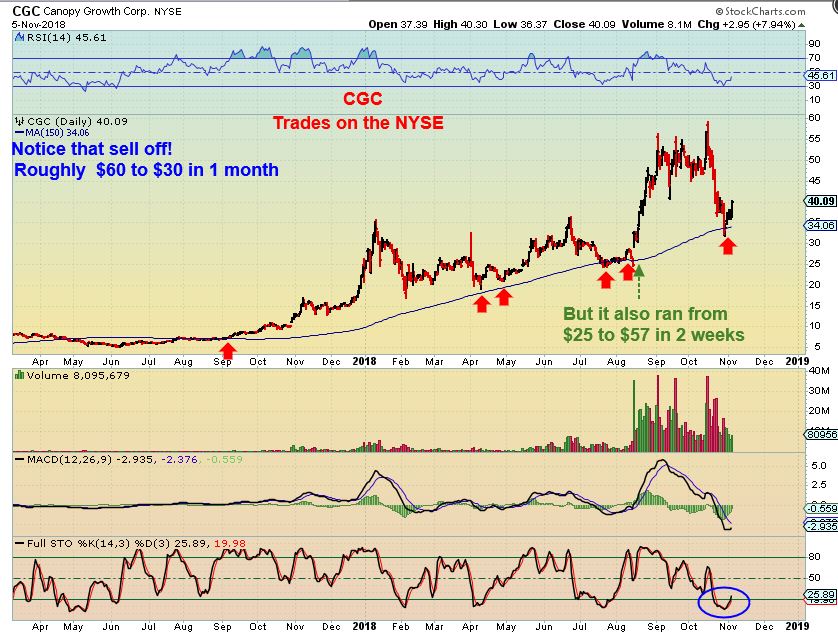
CGC – Read this chart: This is a tough call, and I mentioned it last week. I can’t tell if it is ready for a massive run again, like in August? Maybe it is. Or will it meander, and if so, why? I say this because there may be a lot of Buyers in September that may now be stuck after that sell off, so they become sellers stuck in this stock just ready to bail out on a rise higher. It is a buy near this support level though.
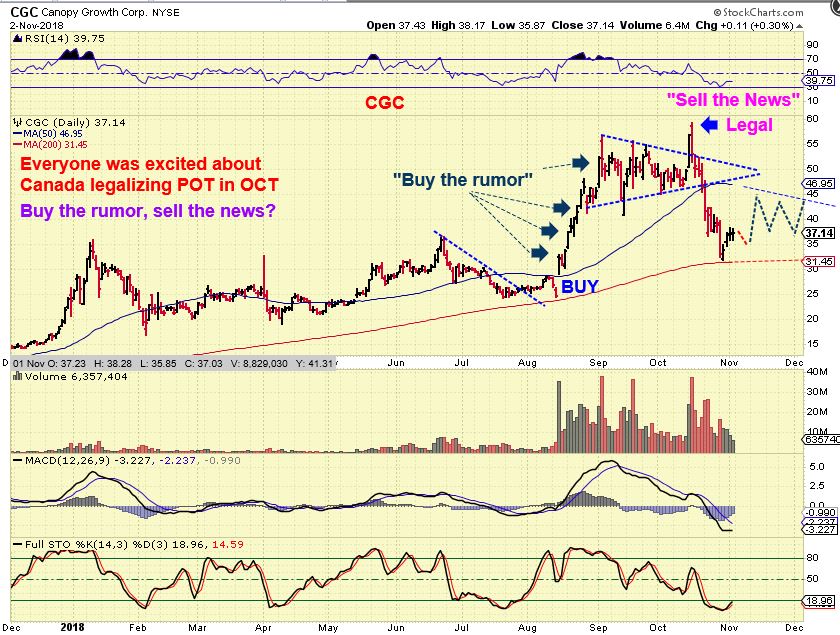
So I posted this and wrote this chart about CGC last week, thinking that maybe sellers could be caught in this stock ready to bail out. I could also be wrong, they may just add to position and ride it higher.
I have a list of maybe 60-80 MJ Stocks, and that is too many to mention here, So check your list of MJ STOCKS and see if they may be rising from a support level with increasing volume. You may have a nice trade developing if you do.
.
EVEN SOLAR STOCKS LOOK TO BE JOINING THE MOVE –
.
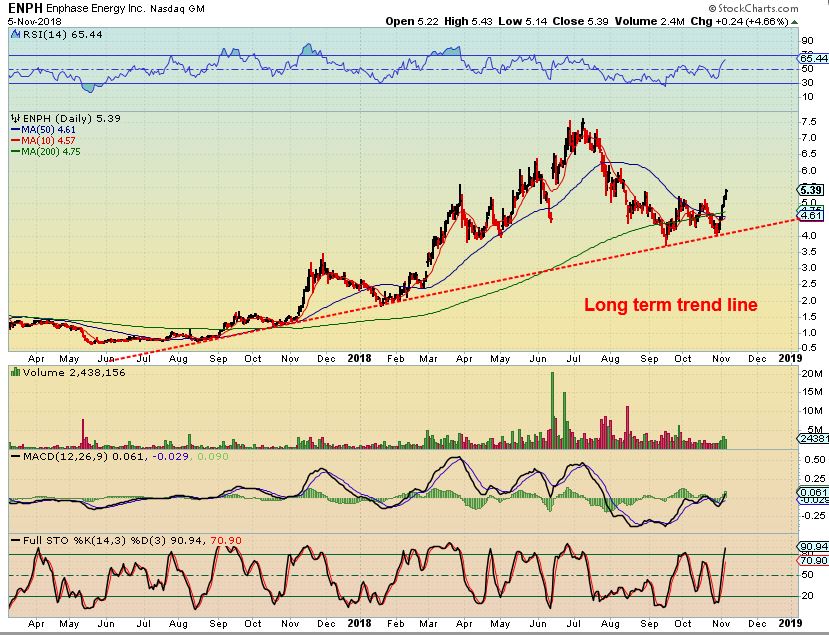
ENPH – ENPH tagged the long term trend line and has swiftly moved from $4 to $5.40, but I think it can run back to former highs over time. They supply components to the Solar Industry
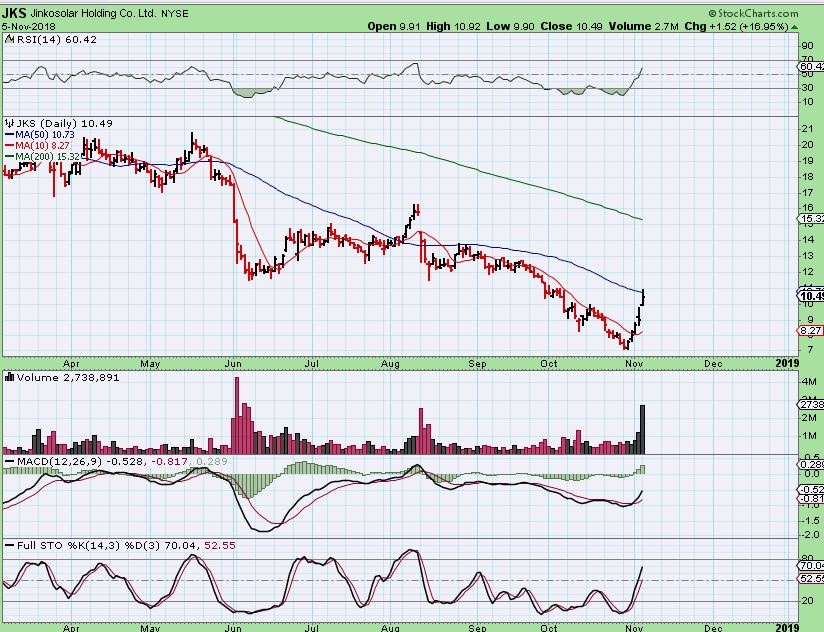
JKS – JKS popped & ran to the 50sma. These moving averages are downward sloping, but the volume came in and price can get above the 50sma and back test it after a tag of the 200sma. That is a big run.
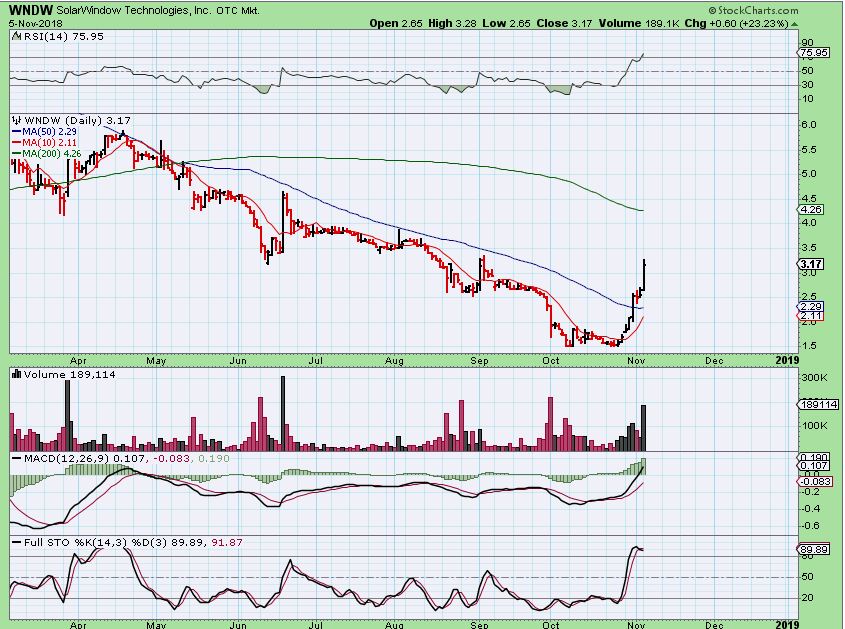
WNDW – WNDW is doing just that. Breaking above the 50sma last week, it stalled similar to Uranium stocks, and then burst higher again.
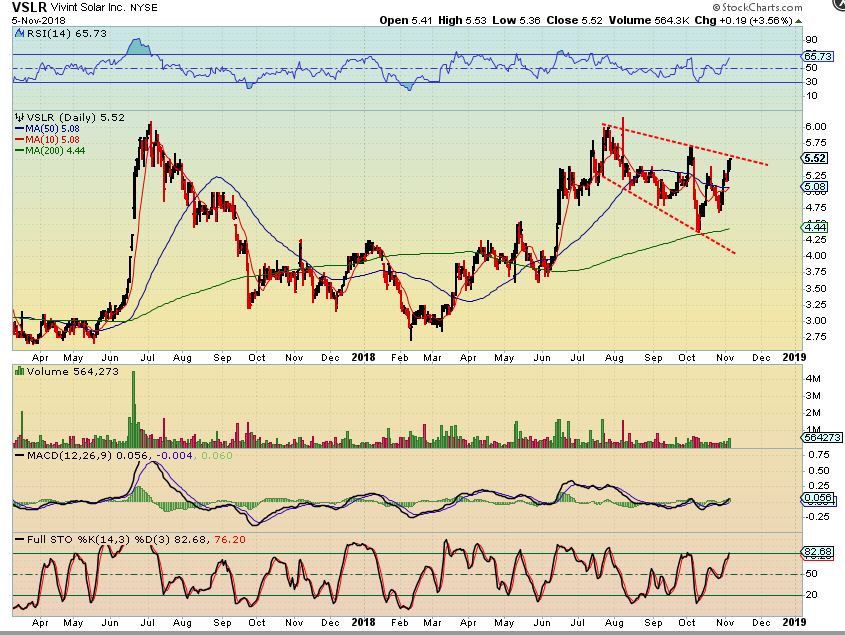
VSLR – This looks ready to break from a bit of a megaphone pattern, and if I zoomed back, this is a large cup & handle.
So basically we are seeing a traders paradise again. Several sectors have stocks that are set up & breaking higher ( Uranium, MJ Stocks, Some Solar, Energy may start moving with Oil due for a low, and Miners should be set up to move higher too). The Market expectations were covered in the weekend report.
Enjoy your Tuesday trading, and if you have your own watch list of MJ stocks or Miners, etc, try to catch them low, maybe near a support level for a reasonable stop, and sell them higher.
.
~ALEX
.
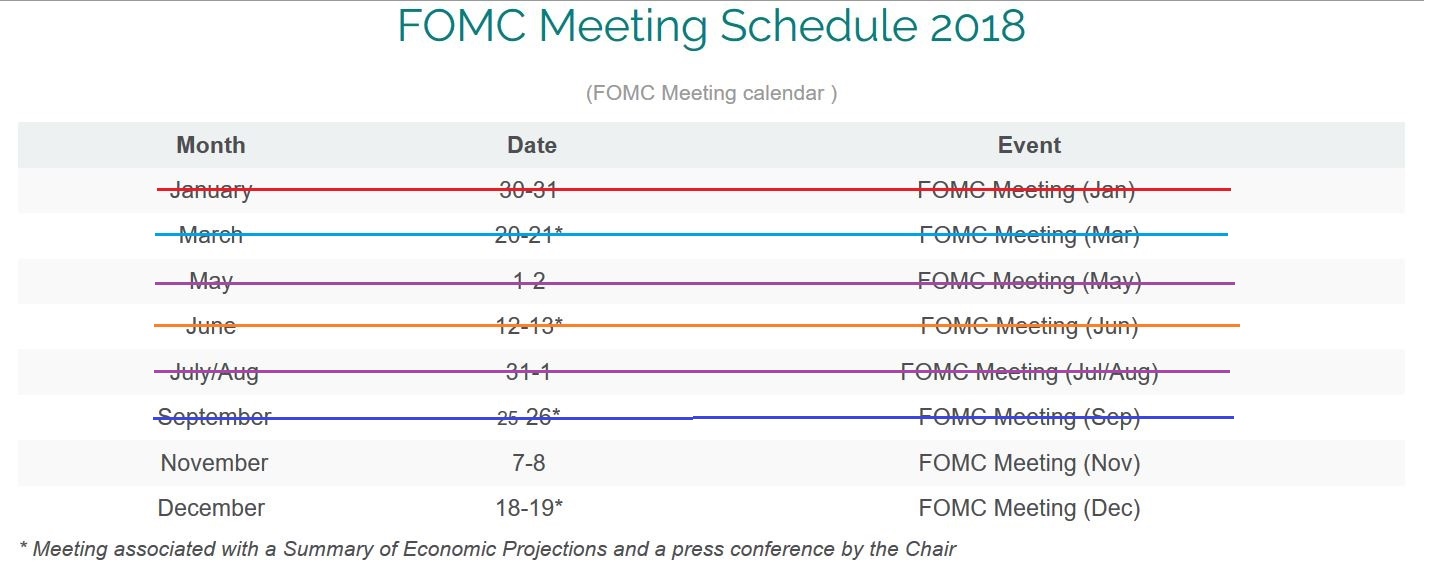
Here is something very off that I just noticed.
This is my personal FOMC MTG list that I keep on my desk top, and it says that there is a meeting NOV 7&8 (That is Wednesday and Thursday of this week). Usually, it is on Tuesday & Wednesday when the decision or any announcements come out. I have not really heard any talk of a Fed Meeting this week, but I googled it and this is correct. That said: Stay frosty my Friends, and maybe THIS will put some Fire under the Miners, since they appear to only be on day 4 as of today.