November 3rd – The Weekend Fire Sale
When you take a look at the weekend reports charts, you will see that we have been buying in areas that went on sale recently. To The Charts!!…
SPX WEEKLY – We have our weekly reversal in the General markets.
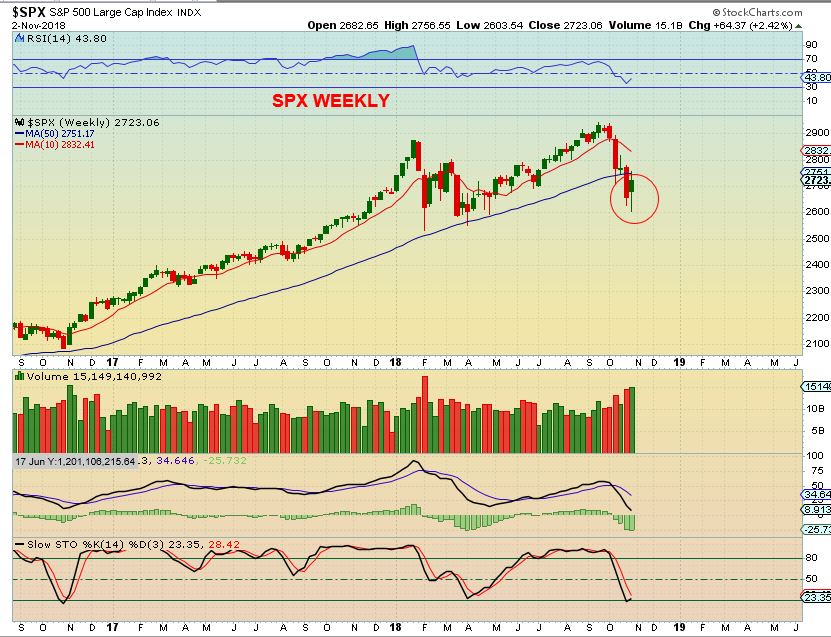
Let’s discuss this further…
SPX WEEKLY #1 – A reversal doesn’t always mean a strong rally bursts higher, so I wanted to point out the chopping trading that took place the last time we broke the weekly 200 ma. We did get a rally, but then we actually saw new lows at the next ICL.
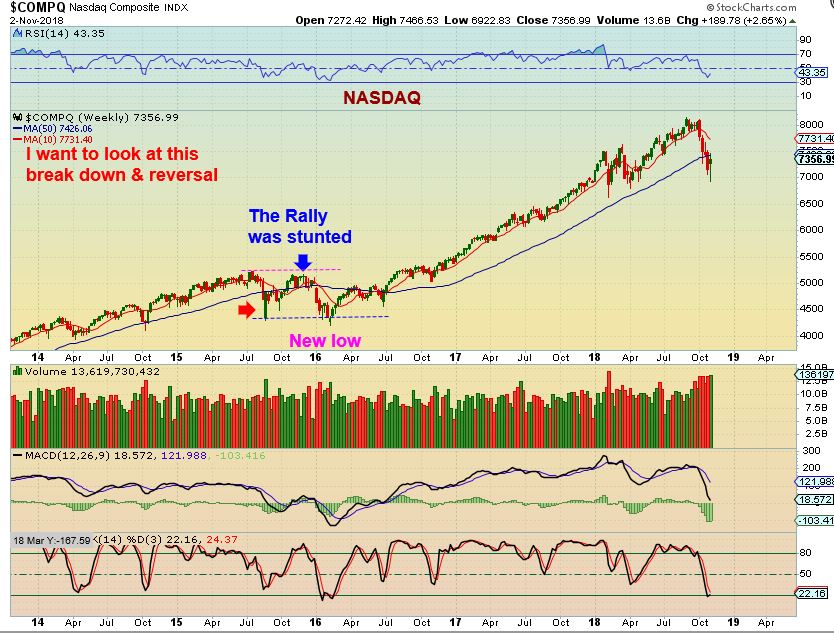
SPX WEEKLY #2 – Almost a year later, we saw a trend line break higher and the Bull resumed the run, so I drew a similar possible idea here. That’s still a year of possible choppiness. There is another view though…
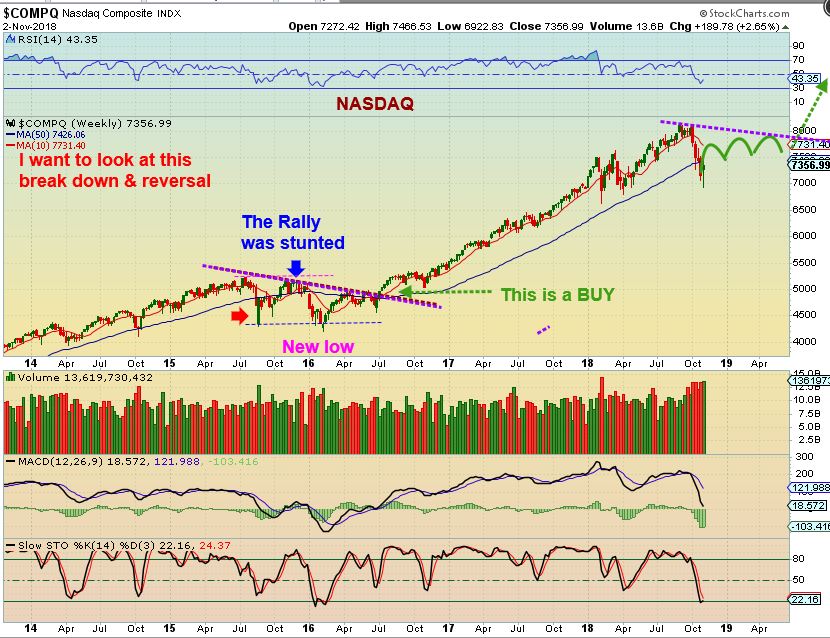
SPX WEEKLY #3 – That view is that the General Markets have had their massive Bull Run ( One of the longest in history) , and could top as Precious Metals and Commodities bottom & have their bull run.
Those are 2 of the Longer Term ideas possible after that serious sell off in October. Short term, I am expecting 2 daily cycles that are trade-able, and the way those unfold will clue us in on which above scenario will play out- Bull or Bear. so we could move higher into the years end.
.
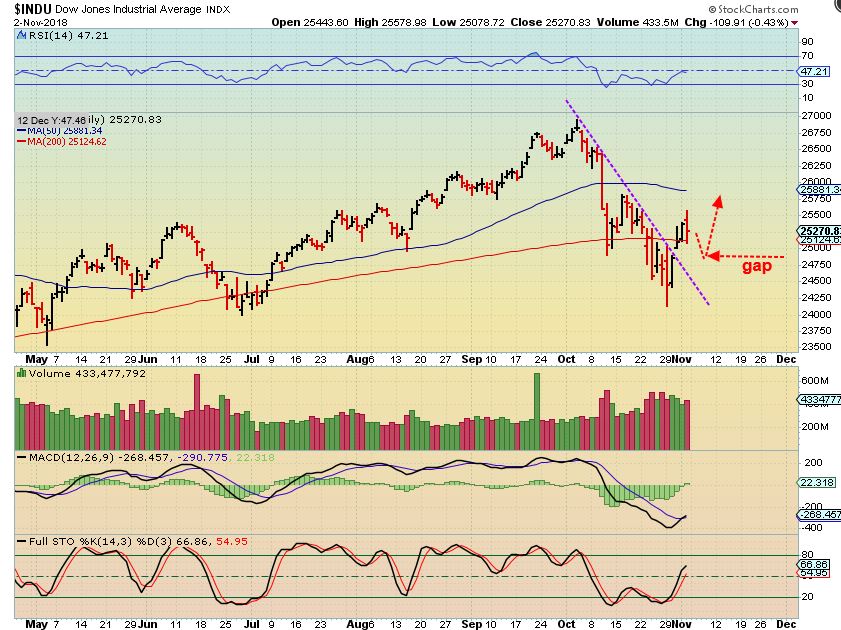
DJIA DAILY – A reversal Friday adds to the choppiness that I warned about last week, but it did bounce off of the 200 sma. My guess is if the gap fills ( and maybe a Back Test of the trend line) it could form an inverse H&S. I do not think that a drop to fill that gap would not be bearish this early in a daily cycle, that’s my opinion.
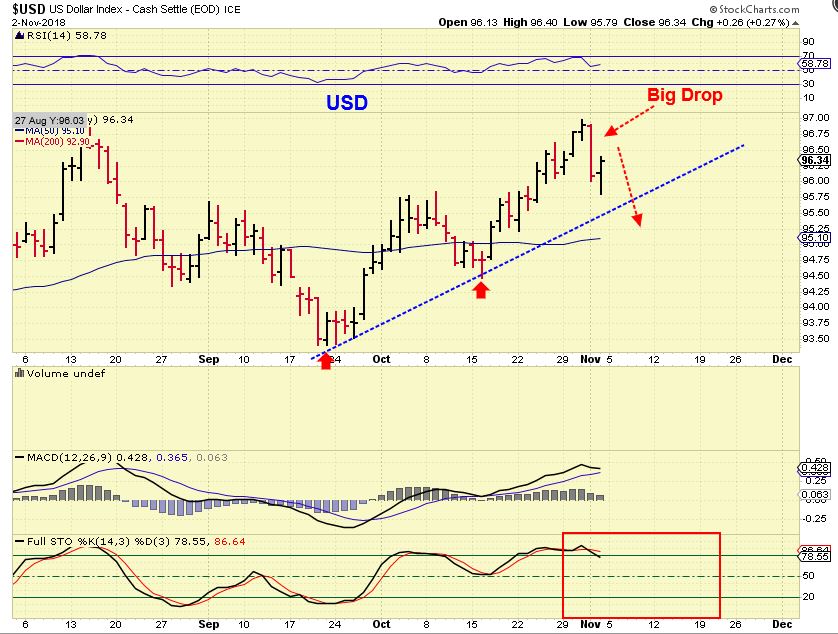
USD DAILY – We saw a BIG DROP in the USD Thursday (And a BIG POP in Gold). Friday saw the USD reverse, is this recovering for a run higher? I do not think so …
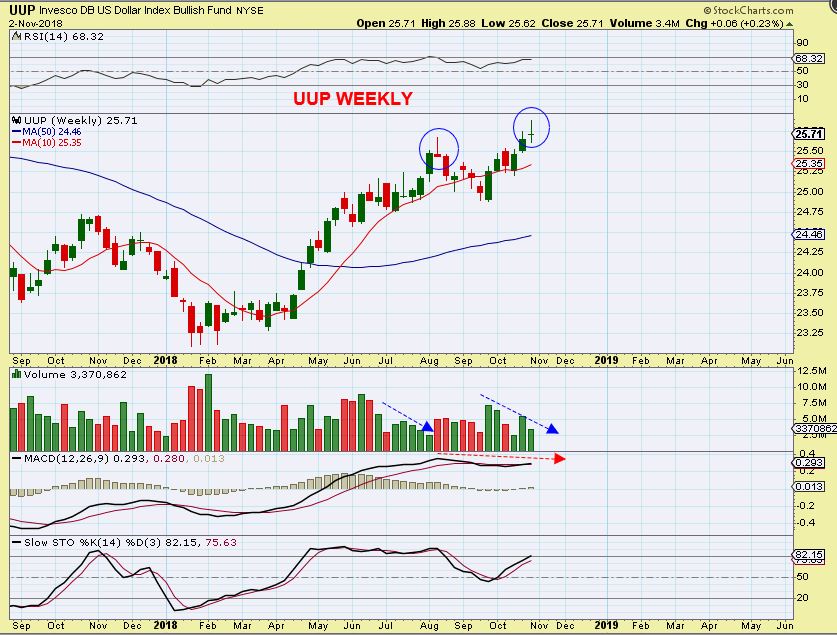
UUP WEEKLY, used for Volume – The weekly has a Doji Top. This should be the top for now, and I expect the USD to drop and Gold to rally.
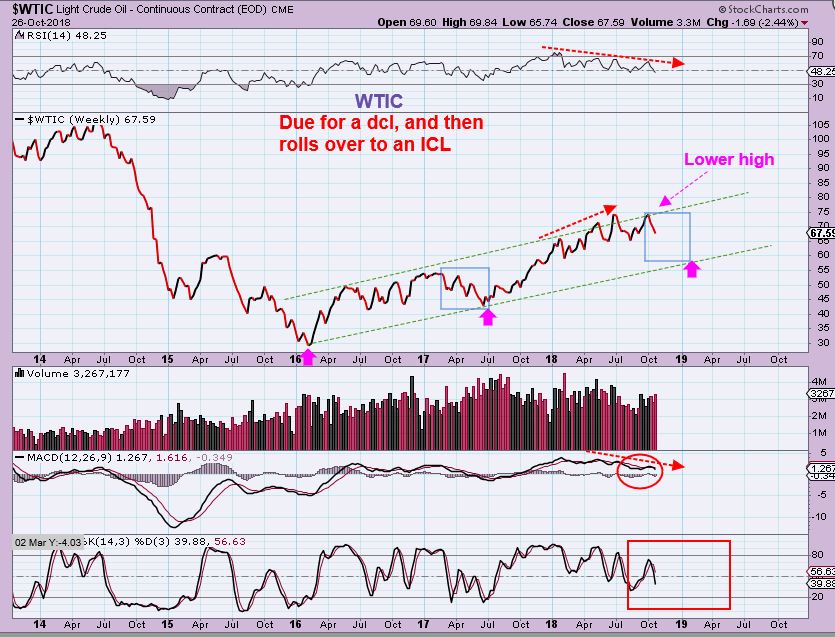
WTIC WEEKLY – I have detailed the daily count in this weeks reports, we are over day 50. After the low is in place, we may rally and roll over into an ICL, if this is not the ICL.
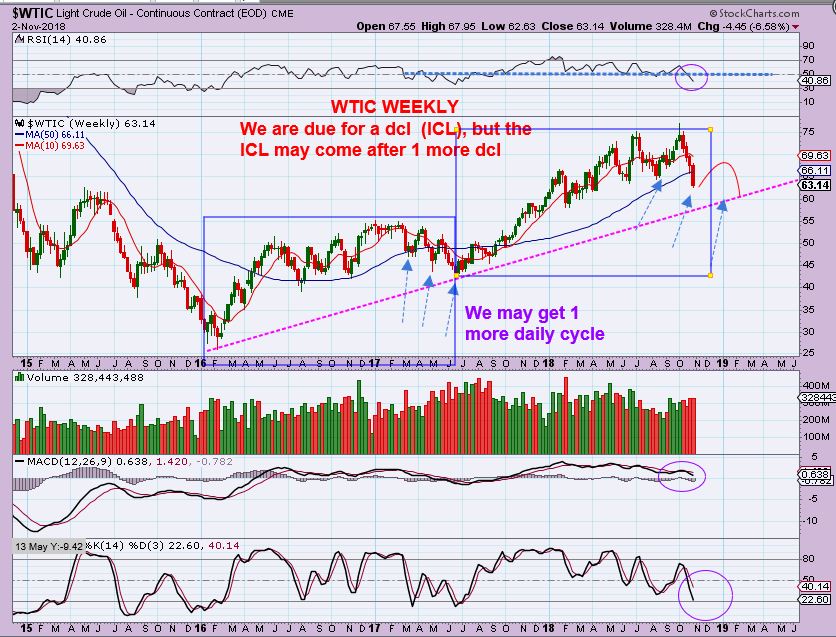
I DREW THIS LAST WEEK ( Oil was at $67.59) TO SHOW THE POTENTIAL OF THE DROP. It is now at $63. See the 2 blue boxes as an idea of daily cycles rallying & rolling over.
.
THE COT remains bullish, but doesn’t include Thursdays Pop. I have no reason to include it here, it is used at extremes to point toward a low or possible top. It is still bullish now.
.
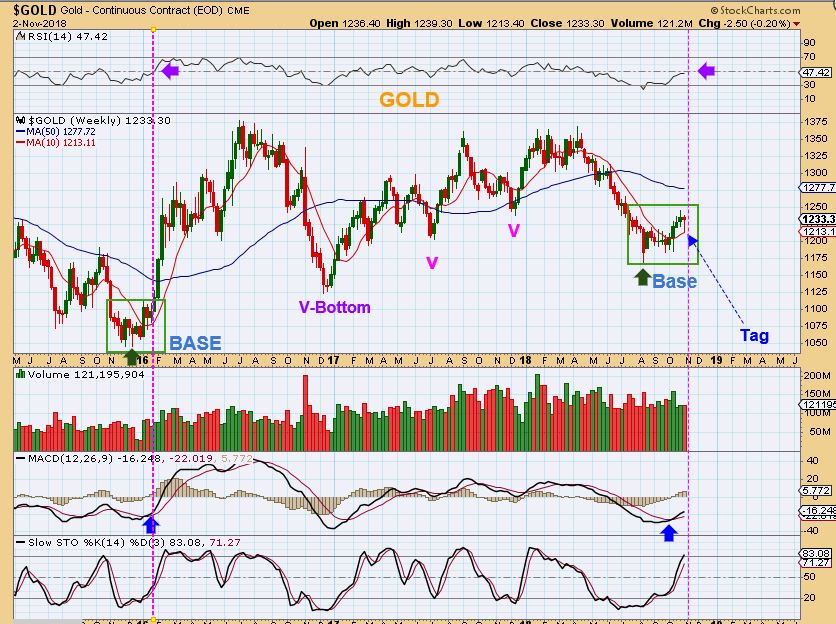
GOLD WEEKLY – This is a BASE and not a V-Bottom. People get frustrated in Bases and give up, because they want instant rallies & rewards. We have been monitoring it daily as a Bullish ICL, and now take a look at some of the similarities of the 2 bases.
1. RSI is about to cross 50% as price back tests the 10 weekly ma
2. Weekly MACD Cross in place
3. Look at Gold when it broke from the base in 2016. We saw 2 Huge Weeks higher. That may or may not happen, but we can watch for Gold to start showing more strength now ( or not).
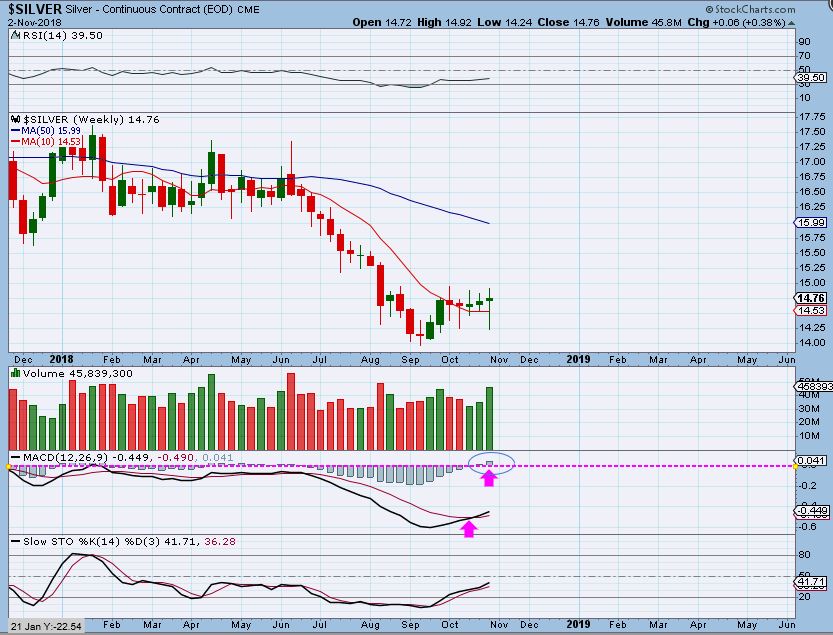
SILVER WEEKLY -Silver sold off & recovered the 10 weekly MA. This is 5 weeks of tight price close consolidation.
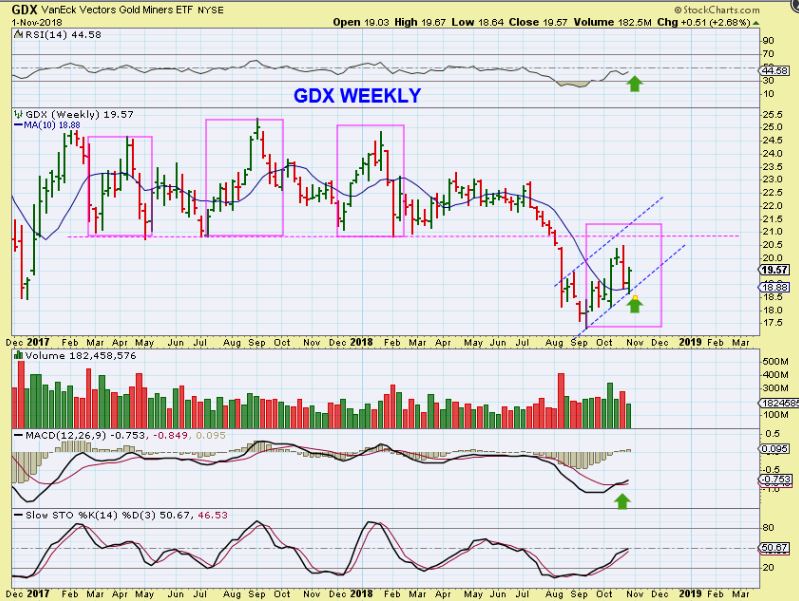
GDX WEEKLY – We should see an upside move from here,
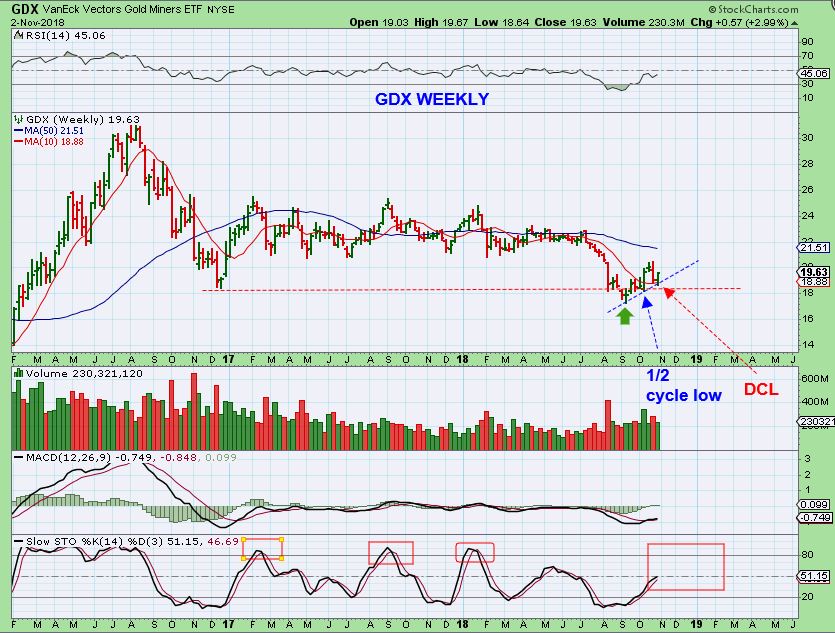
I pointed out possible resistance with this chart in the Friday report. I will keep an eye on that going forward too.
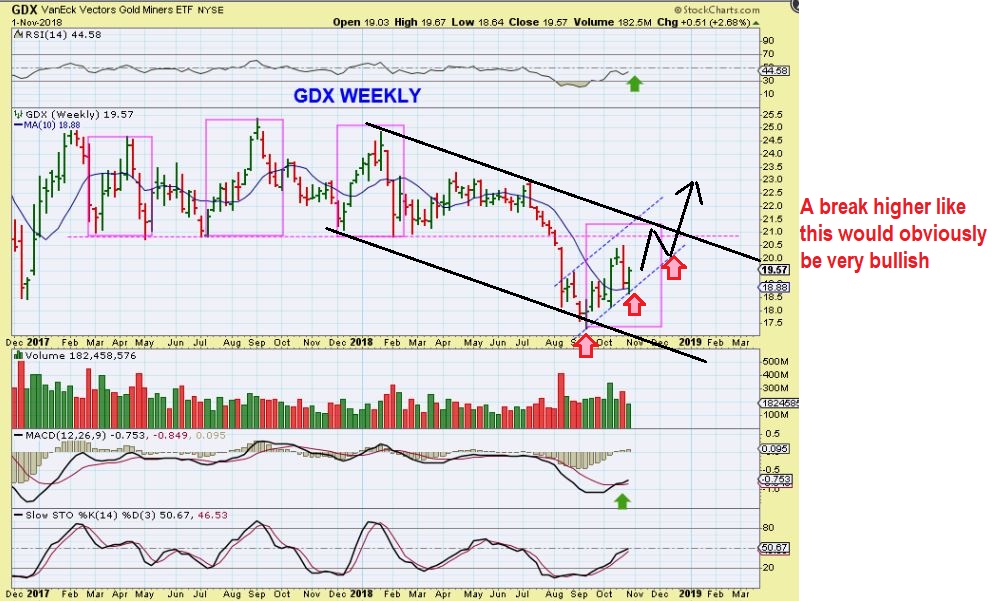
.
So a break out like this over time would be Bullish and is possible.
.
As you can see, many sectors are now playing out as expected, and we are seeing prices that are still on sale in many areas. Even though I called the lows ( ICL) for Miners back in September, this base action ( and earnings) has many Miners still at or near their lows, it has been choppy for many Miners. I will continue to discuss trade set ups in future reports as they develop.
.
Things look good at this point, and if you have time, you may want to review a few of the reports from last week. I have been trading Shippers and the gains have been phenomenal. Even just quickly looking at the oil charts in Thursday & Fridays reports will give you the ‘daily charts’ and their cycle counts. I think that it can be helpful to review how we got to this point and what I am expecting going forward.
.
Enjoy the rest of your weekend, and thanks for being a Chartfreak with me!
.
~ALEX
.
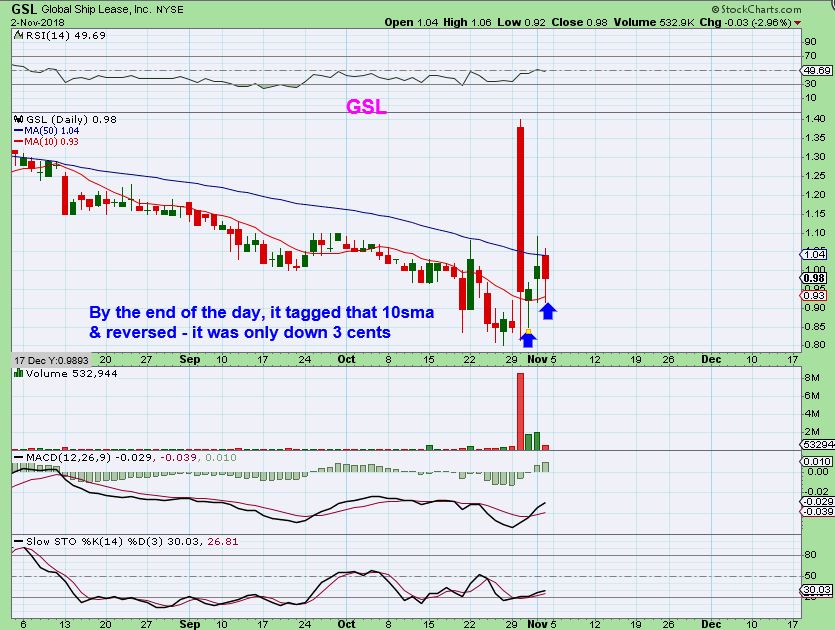
The shippers do move up & down quickly, as we have seen. Some that we discussed have doubled in a very short period of time. I recently mentioned GSL as a potential future runner, as it broke above the 10sma.
GSL DAILY – I was asked for my thoughts on GSL Friday- maybe this drop might be concerning? I drew this for the comments section showing that 10sma and trend line as support areas. I noted that volume on the selling was tiny.
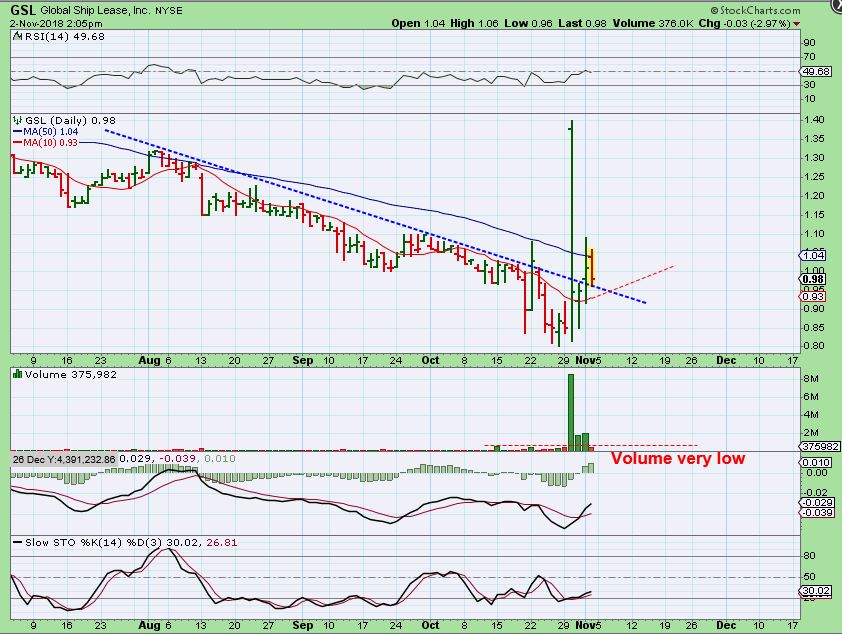
GSL DAILY – By the end of the day Friday, GSL had dropped down to that 10sma and then bounced. It is still oversold and the MACD crossed higher, I still own it. And …
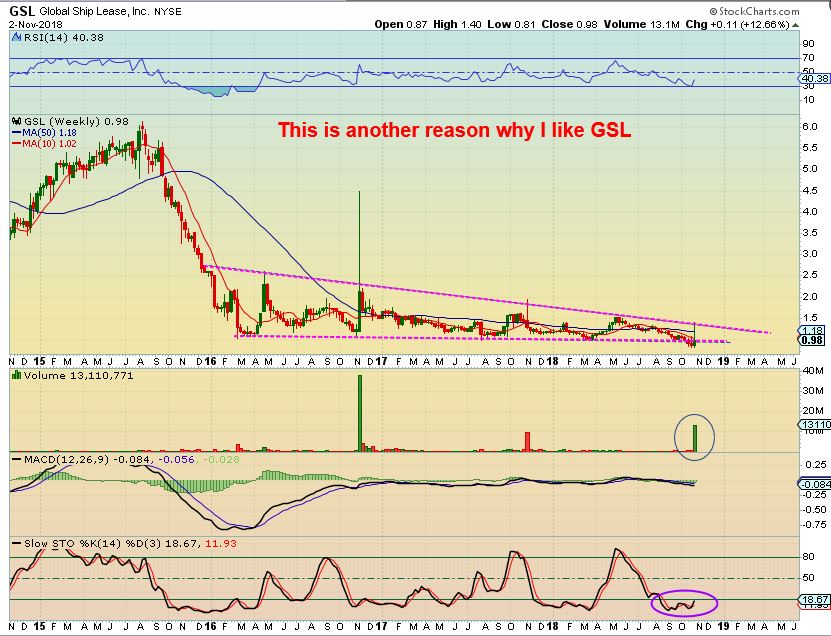
GSL WEEKLY – It is the weekly chart that shows the potential. 🙂
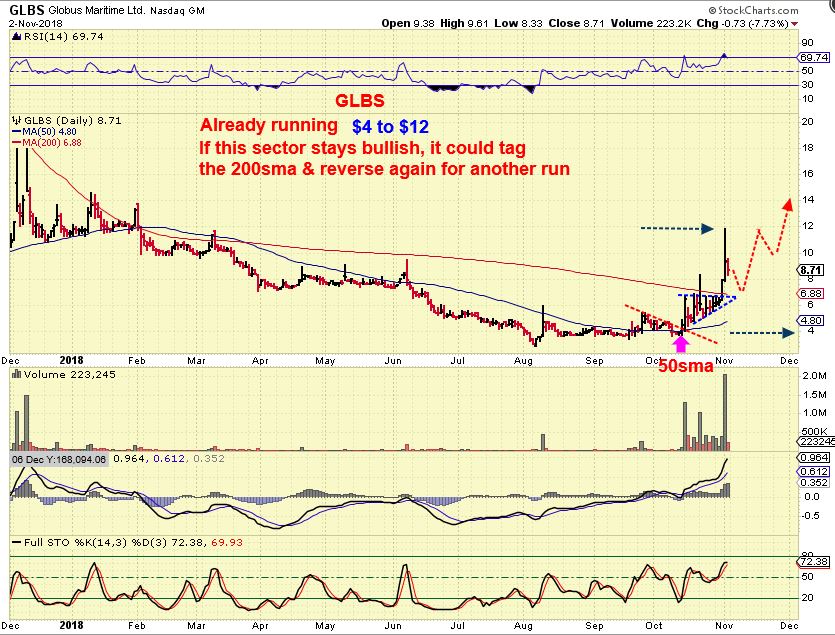
Some of our shippers GLBS, NAT, DRYS, etc have already been delivering %-Wise. GLBS ran from $4 to $12 in less than a month.
And now, after a severe sell off, some of the Medical Marijuana stocks have been setting up for at least a possible bounce too.
.
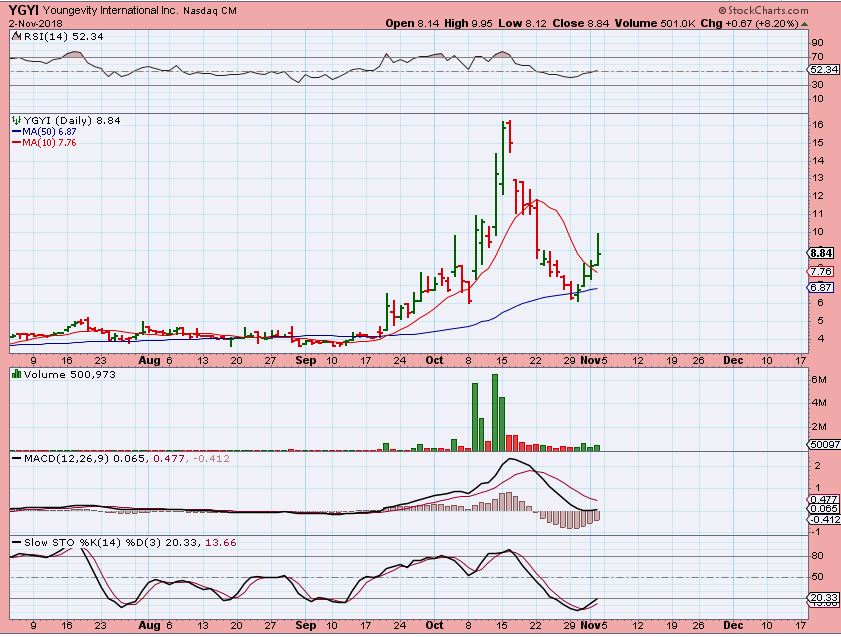
YGYI DAILY – I posted this as I bought it at the 50sma. It is really a normal pull back, but a drop from $16 to $6 is severe if you rode that down. So I grabbed this one…

YGYI DAILY – It bounced from $6 to $10 already, and it can go higher, but I sold it above $9 simply because I don’t like the volume- I wanted to lock in the gains. I will admit that I wish I only sold 1/2 like I usually do. I may have sold very early, this could quickly run to the gap, since YGYI is still very oversold. A drop to the 10sma & reversal gives me an opportunity to re-enter though.
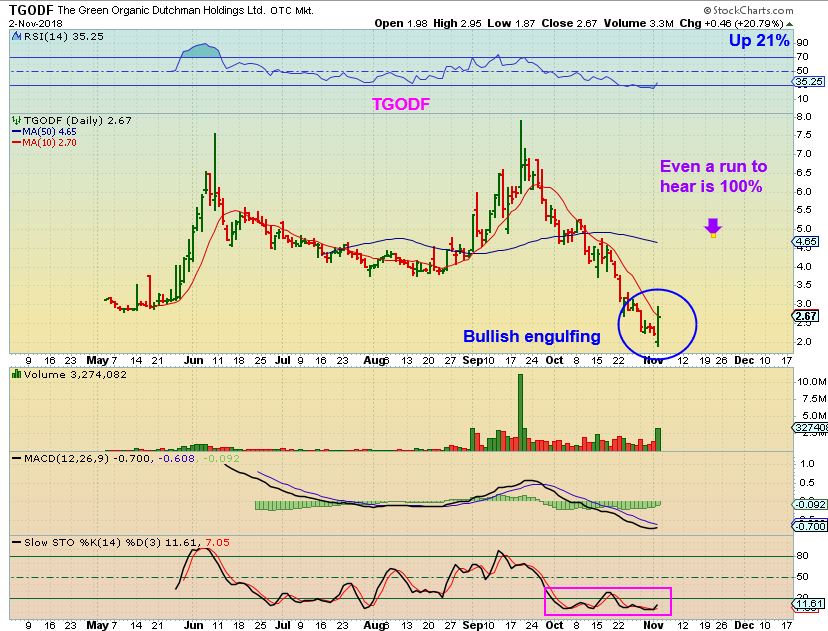
TGODF DAILY – You can see what I mean by a severe sell off, but I did buy this bullish reversal at $2.50 and mentioned it in the comments. I bought because it was a bullish engulfing. A run to the 50sma is a 100% move.
.
If you look at some of the MJ stocks that we traded (see CGC below) , almost all like CGC, ACB ( formerly acbff) and APHA ( formerly aphqf ), TLRY, YGYI, etc, you will see the deep severe sell off in October. Canada was going to legalize Recreational Pot and it became a case of ” BUY THE RUMOR, SELL THE NEWS”. They sold off immediately after Canada passed that law. Now they may need a little repair time, as drawn…
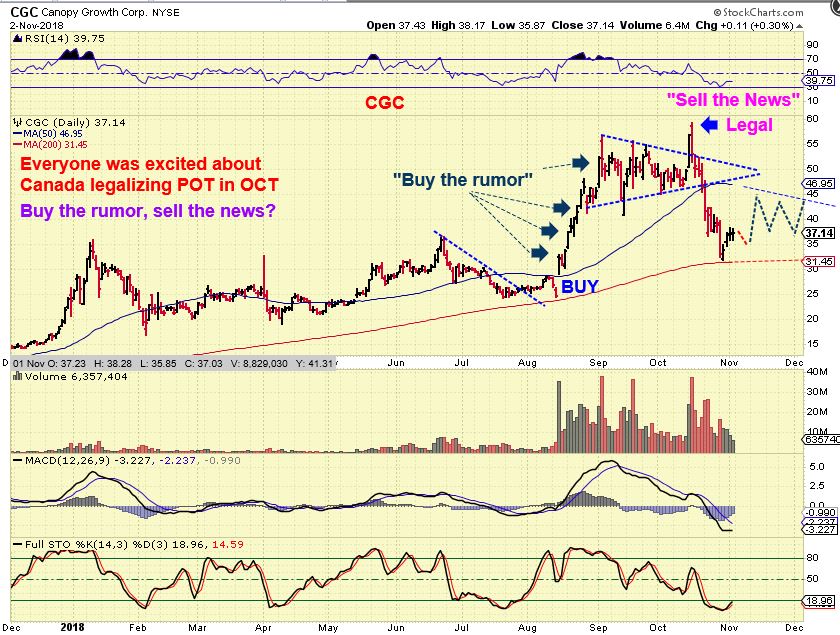
Usually after a sell off like that, price bounces around and needs a little time to repair the damage – HOWEVER-
.
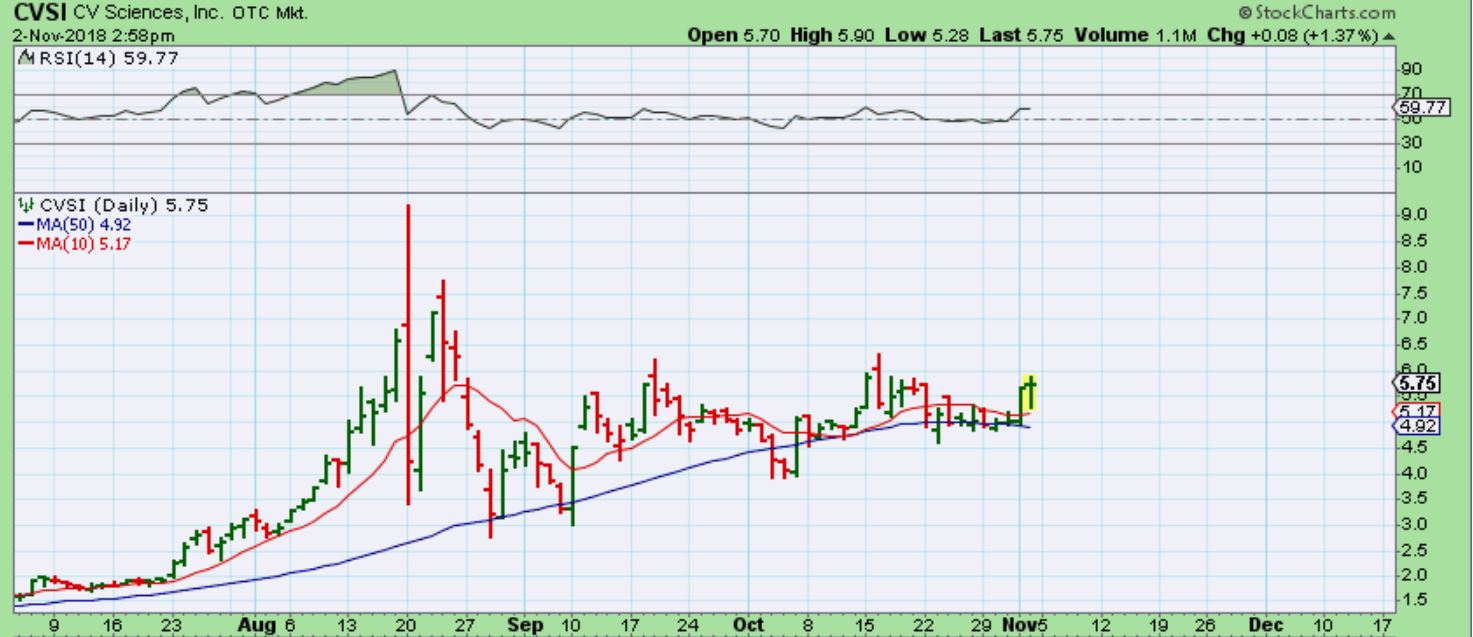
CVSI DAILY – CVSI was a very rare MJ stock that did Not break down below the 50sma. CVSI dipped slightly under the 50sma, but nothing like other MJ Stocks. If MJ stocks are ready to bounce, I decided to buy this for its recent strength and chart pattern, and we’ll see if it can rally from here.