Nov 24th – Weekend In Review
Let’s take a look at our Big Picture layout with the Markets…
.
SPX– The markets dropped toward their ICL, and I mentioned that similar to what we saw in Feb & March, this could now become a choppy market, instead of the ‘Buy he dips’ that everyone got used to. The ICL could still be ahead, and I will explain why, but if that was the ICL in October, this could just remain choppy putting in a higher low like last April. See the chart.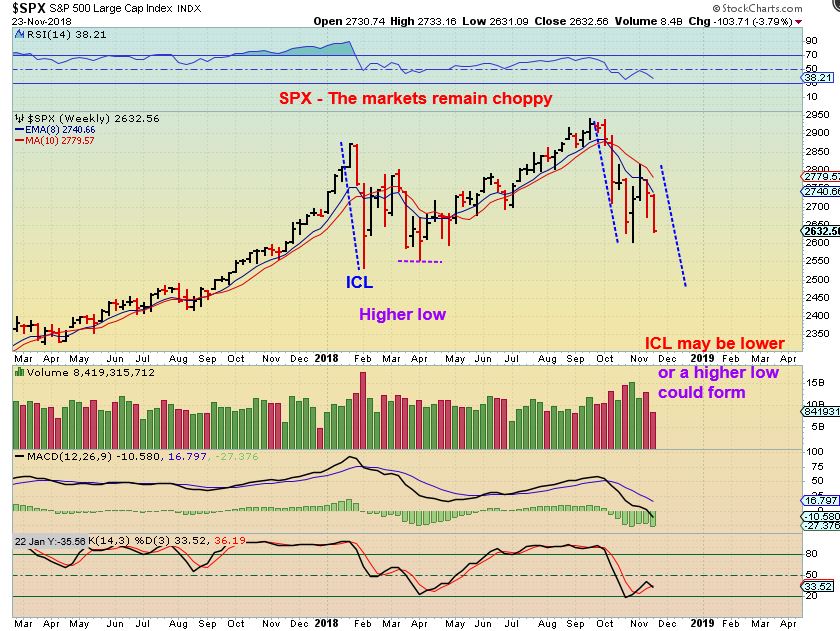
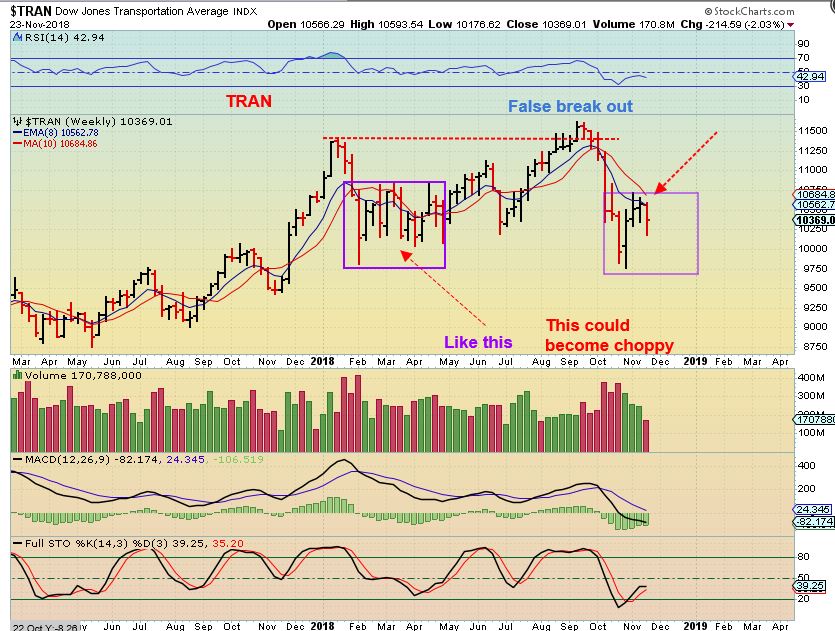
TRAN – The TRAN actually broke to a new low, below the Feb lows. As mentioned in prior reports, this could become a double top down the road.
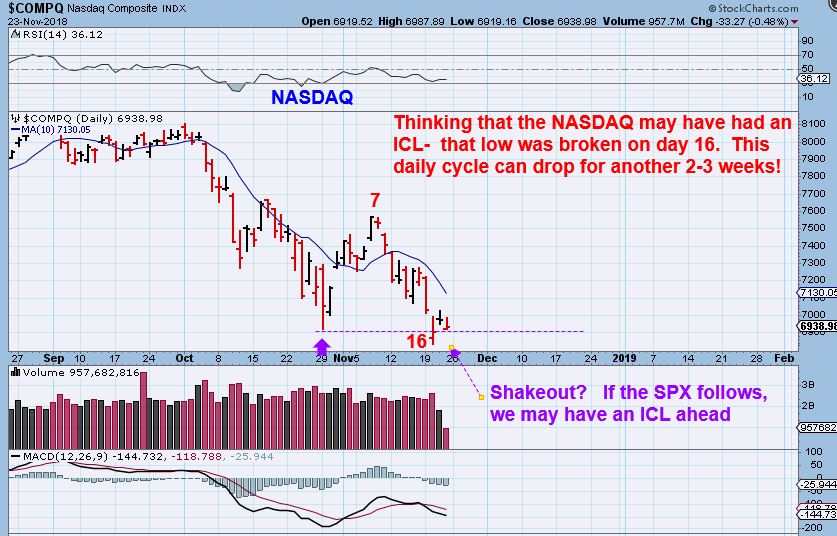
If that was an ICL, why did the NASDAQ break the lows? This is why the SPX could still have the ICL ahead. If that was just a dcl in October, this can drop for a couple more weeks.
And I warned about that here in a past report.
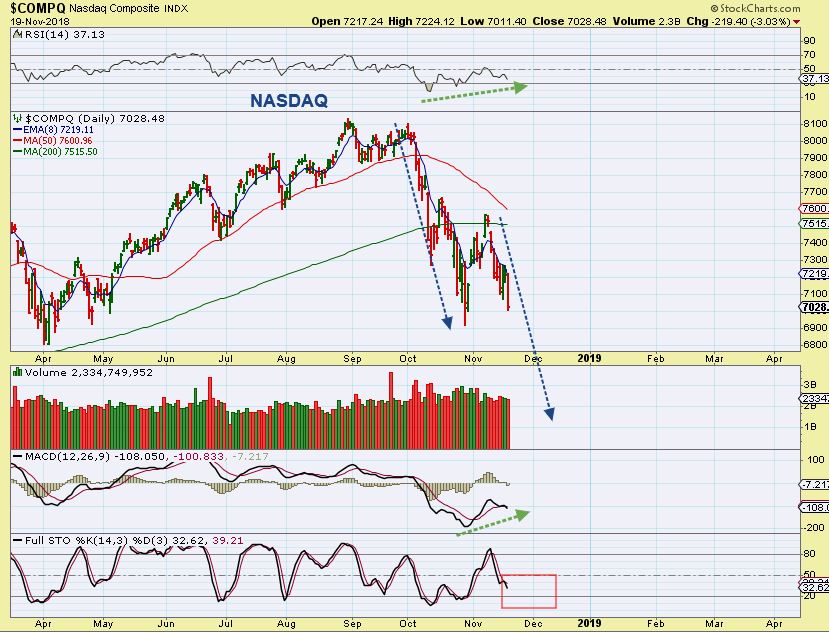
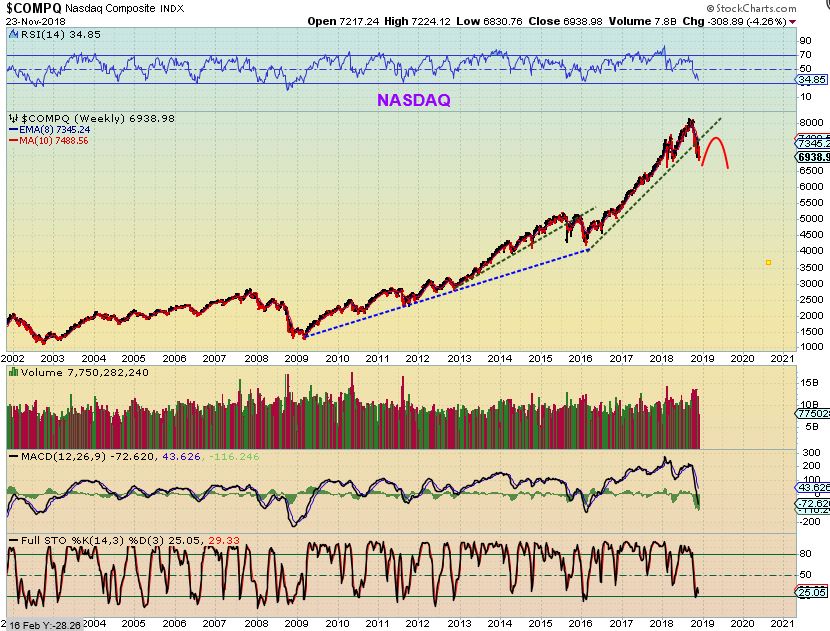
NASDAQ– And that could lead to this. The uptrend has been broken, future bounces may be disappointing in the long run. This is actually when I expected Precious metals to become stronger, with money flowing into that sector as a safe haven, we shall see. One more market bounce to form this shoulder could occur as Gold seeks out the next ICL.
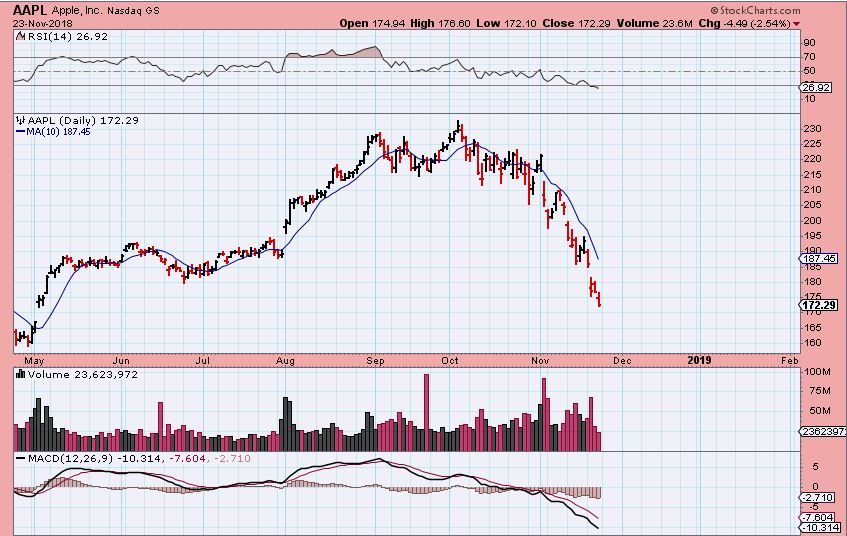
Even AAPL looks like a big round apple on this chart, and it closed at the lows.
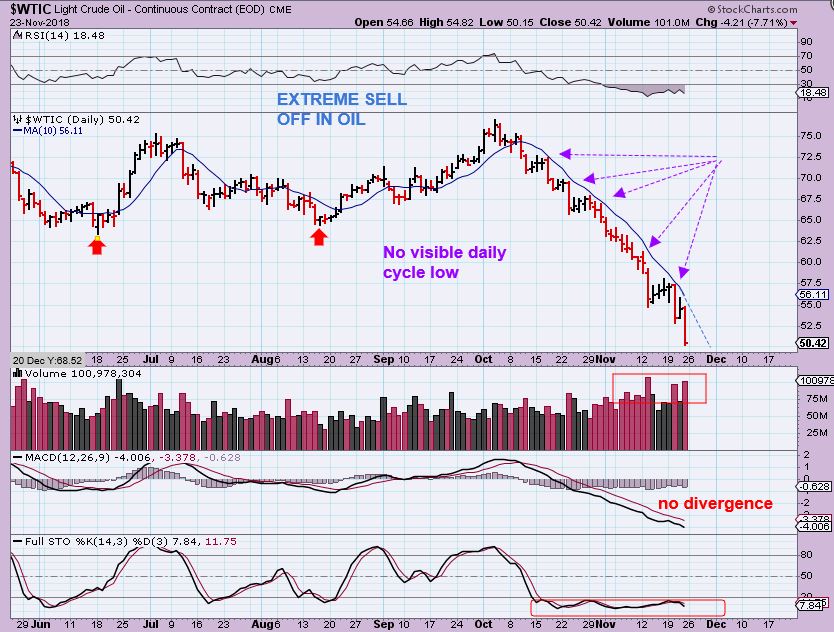
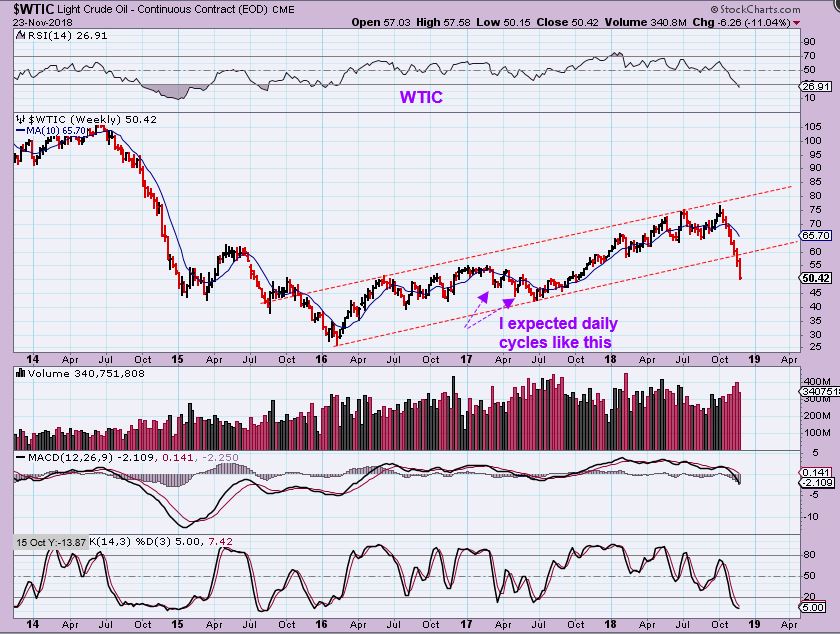
WTIC DAILY – Without a visible swing low or daily cycle low showing in the past 3 months, this is an extreme sell off in Oil, and it should put in a swing low very soon. Day 1 or 70 is Monday. I tried to go long the last swing low, but it gave way too and stopped me out.
WTIC WEEKLY – This is noteworthy. The trend line from 2016 has been broken. If an ICL and the next move higher cannot recover it, Oil is in trouble. No inflation? A V-Bottom snap back above that line would help oil. Time will tell.
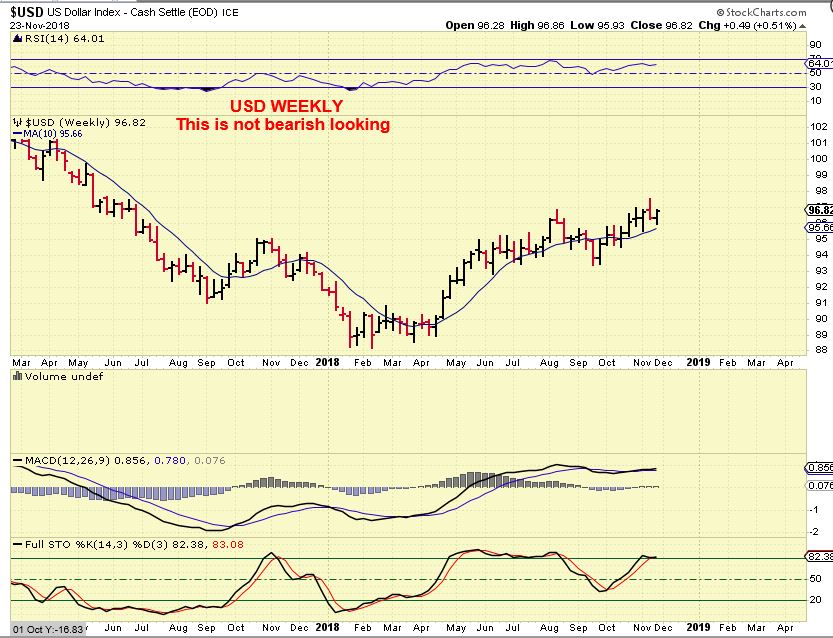
USD WEEKLY – The weekly chart for the USD does not look weak, it is above the 10 ma. This actually looks strong…The good news? This recent strength from September has not hurt Gold recently, but it has not helped either.
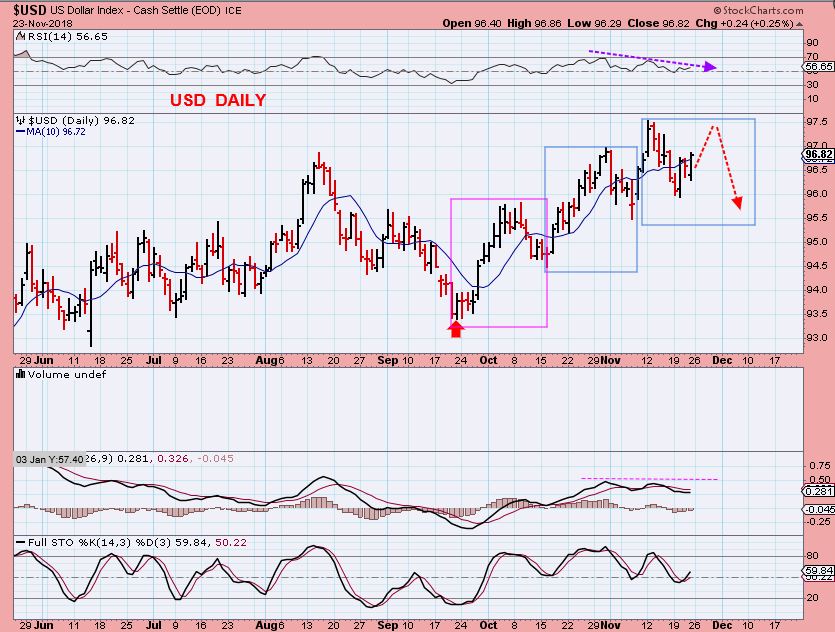
USD DAILY – If the 3rd daily cycle for the USD is going to be ‘the peak’, it could roll over shortly. The RSI looks to be weakening. I will discuss another interesting side note later in the report.
.
I want to discuss a few ‘ideas’ about Gold that I have touched on in recent reports. Short term bullish and short term bearish. Nothing is etched in stone, they are possibilities to be discussed now, and we watch for clues along the way.
.
Due to the holiday week, the COT will not be released until next week, but it remained quite Bullish last week.
.
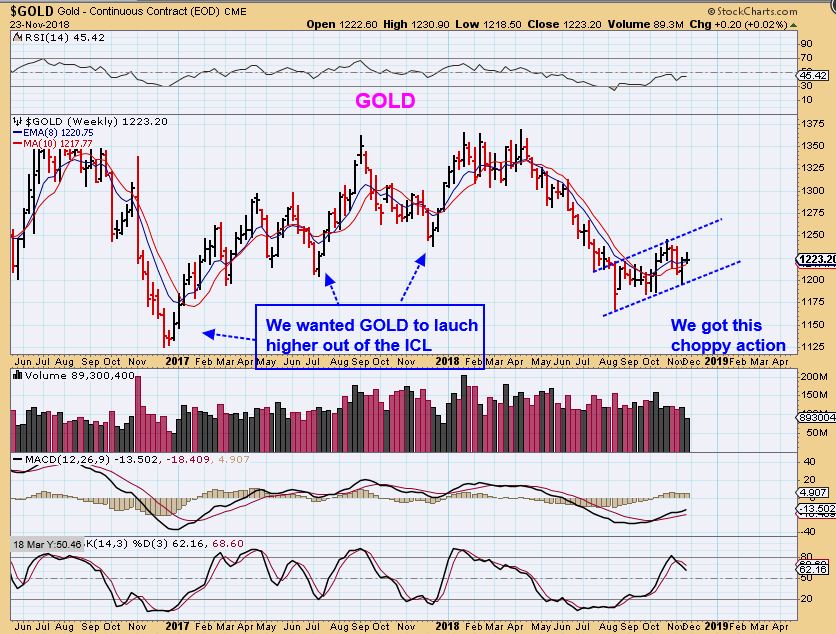
GOLD WEEKLY #1 – Looking for a v-rocket out of the ICL, we got a choppy sideways move so far. Read the charts
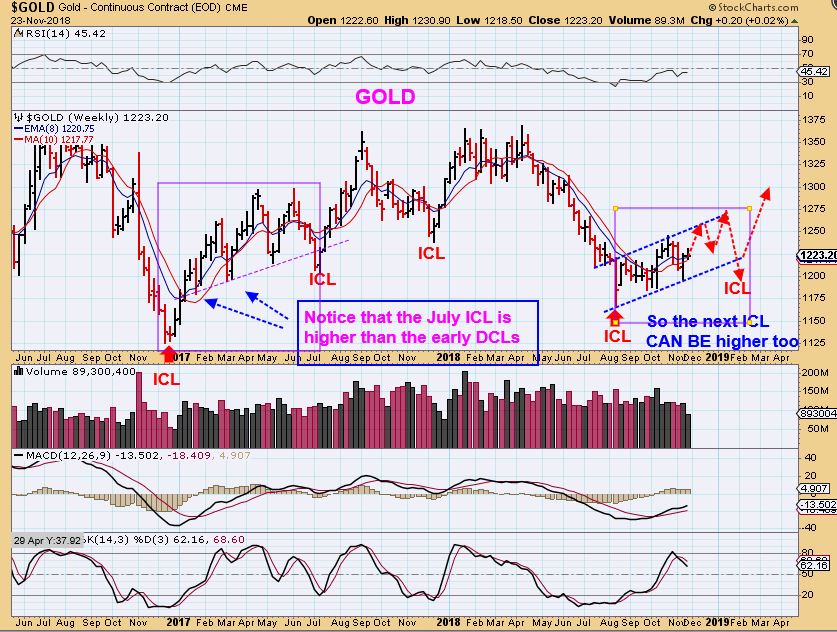
GOLD WEEKLY #2 – A MORE BULLISH SCENARIO. If the USD is going to roll over- The next ICL does not have to be lower than our current ICL, read the chart. At times in the past it didn’t even break the first dcl. Read the chart.
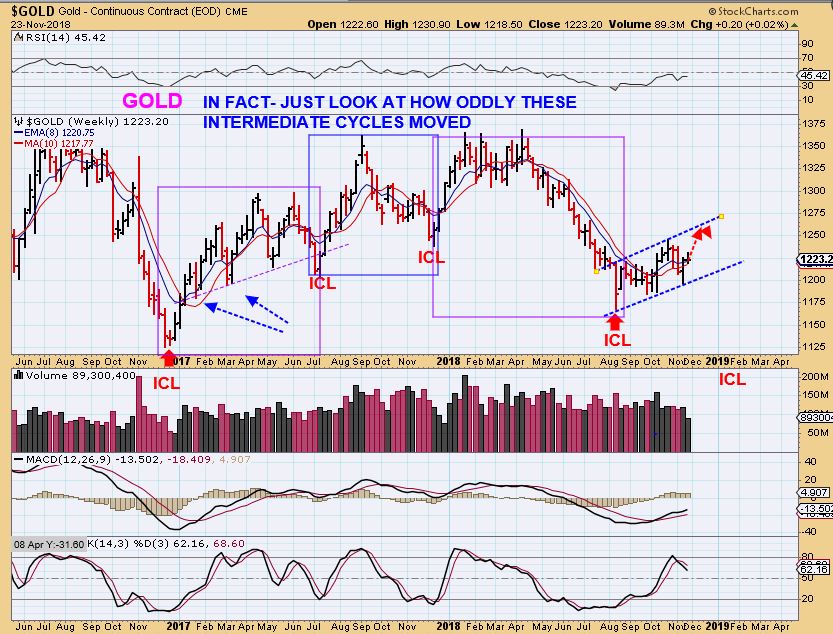
GOLD WEEKLY#3 – These intermediate cycles have actually been very choppy & even ‘odd shaped’. That has made them difficult to trade and shakes buyers out.
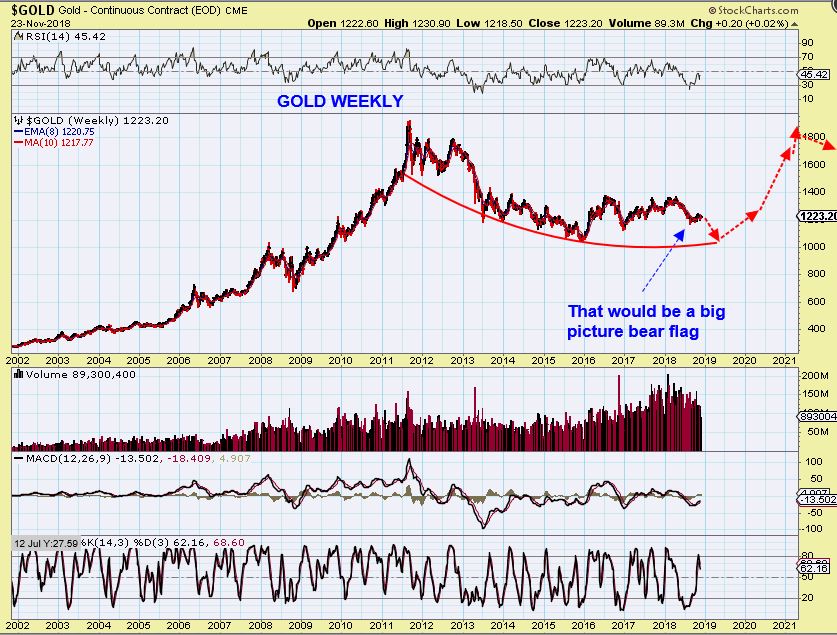
GOLD WEEKLY#4 – A bearish short term view could be this weekly dome. Read the chart. How would that drop look in the Real Big Picture?
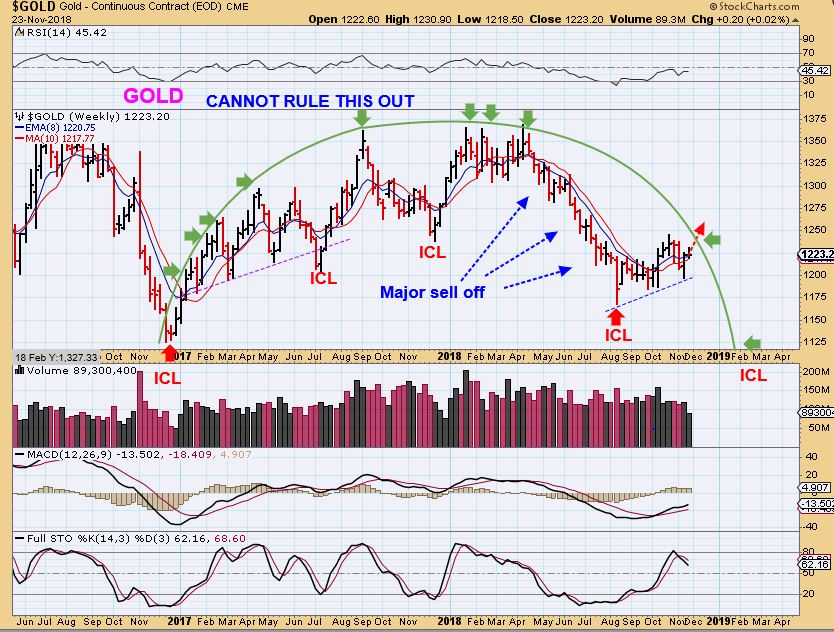
How would that drop look in the Real Big Picture?
GOLD BIG PICTURE – Normal unfortunately, so this is a possibility.
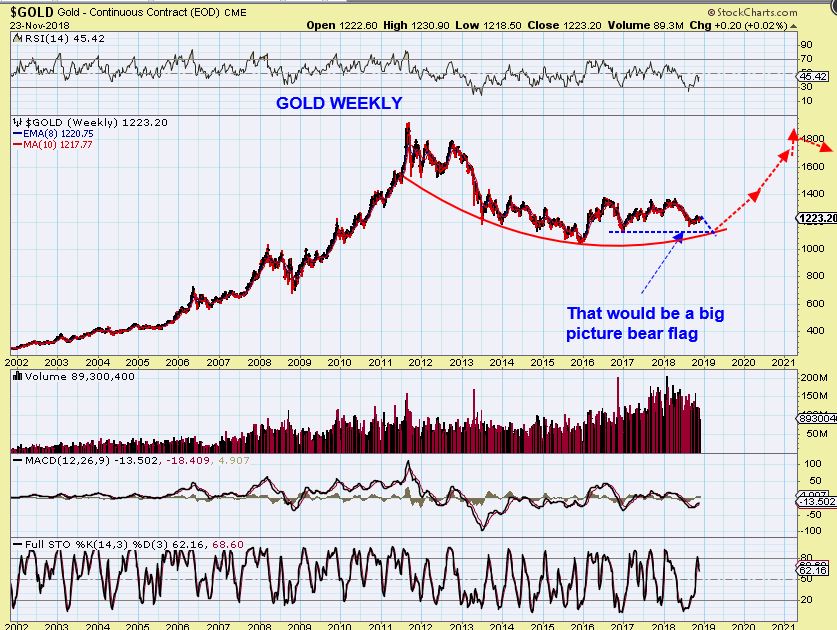
GOLD BIG PICTURE – Even a deeper drop to 2016 lows would be a double bottom base that could remain big picture bullish. The Current COT Levels seem to doubt this scenario.
GDX#1 – I captured this near the close Friday. A gap was filled and price is still above the 10sma.
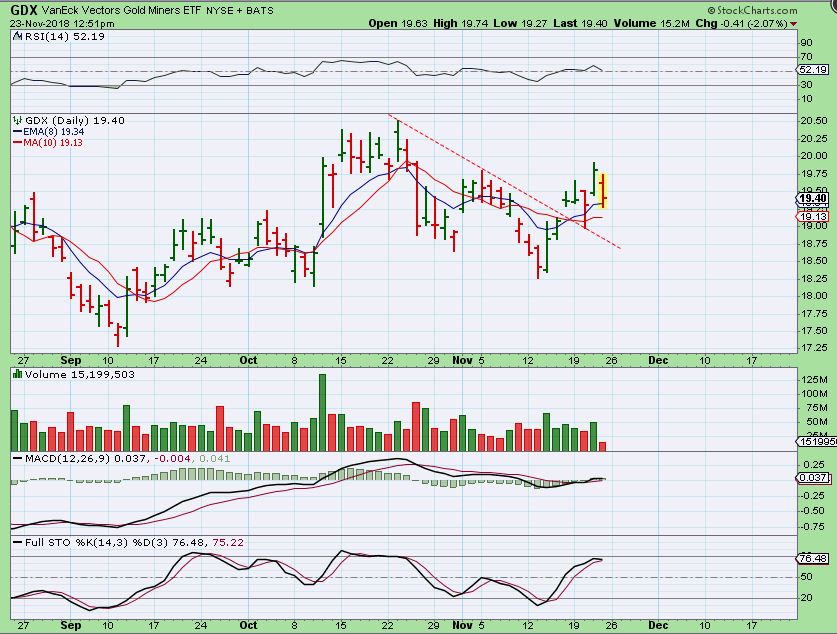
GDX #2 – This is GDX as of Friday. It dropped to the 8 ema/ 10 sma area and it is in a mid point resistance area. SO FAR this is a day 6 peak.
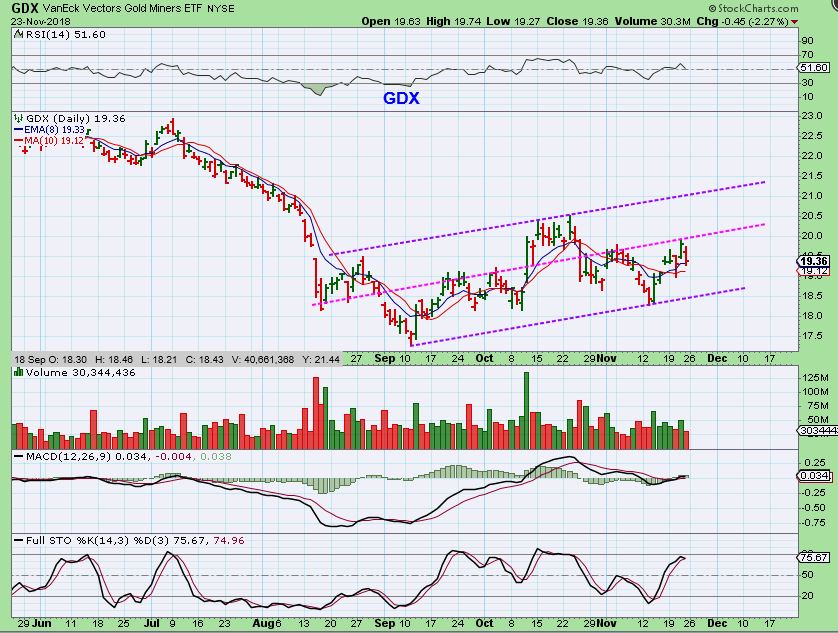
I said that I would discuss another interesting side note on the USD later in the report. Notice that the USD put in an ICL in SEPTEMBER and has bounced higher since then. Scroll up & see that the Miners actually have bounced higher since September too. THAT is interesting, especially if the USD is now due to roll over. Miners may benefit.
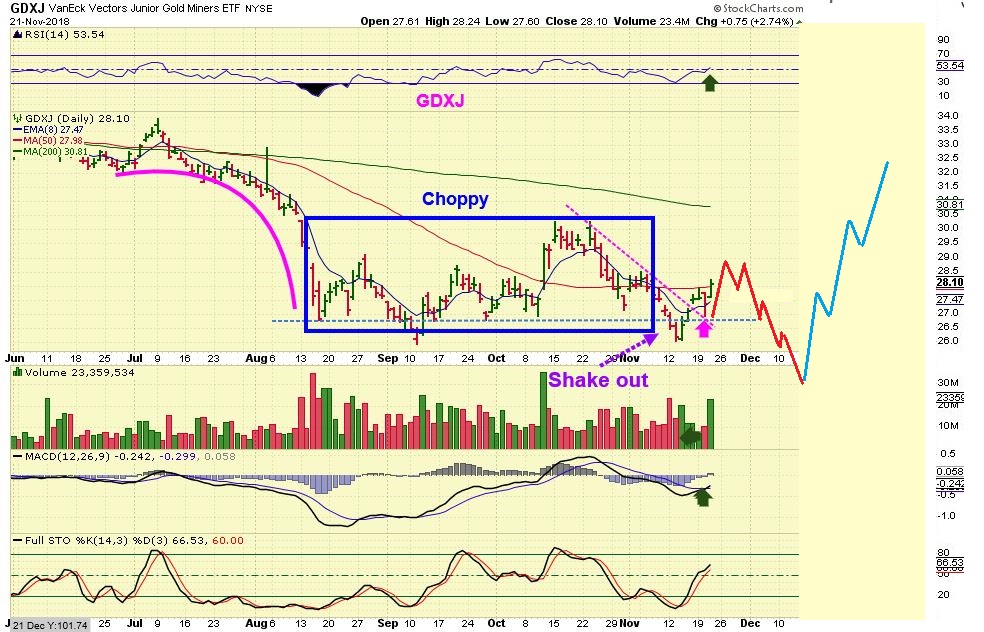
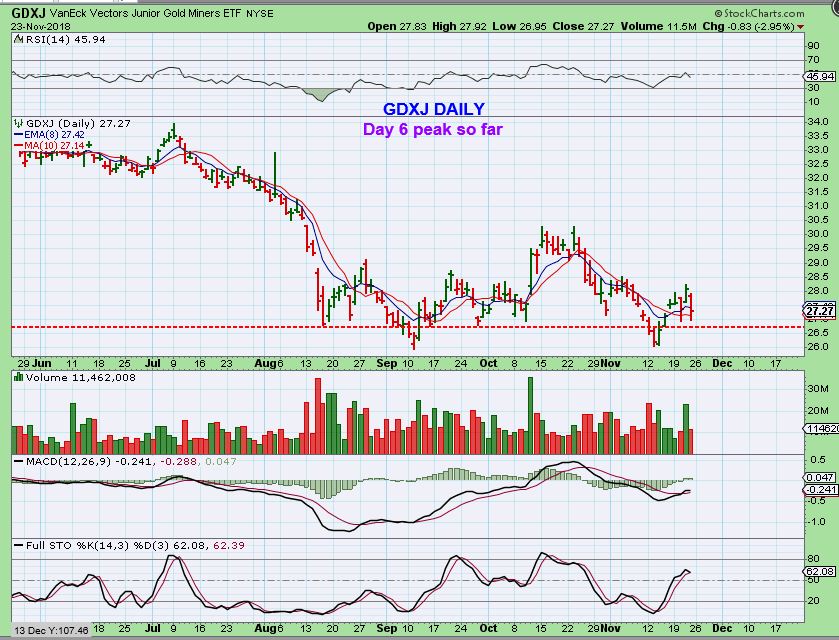
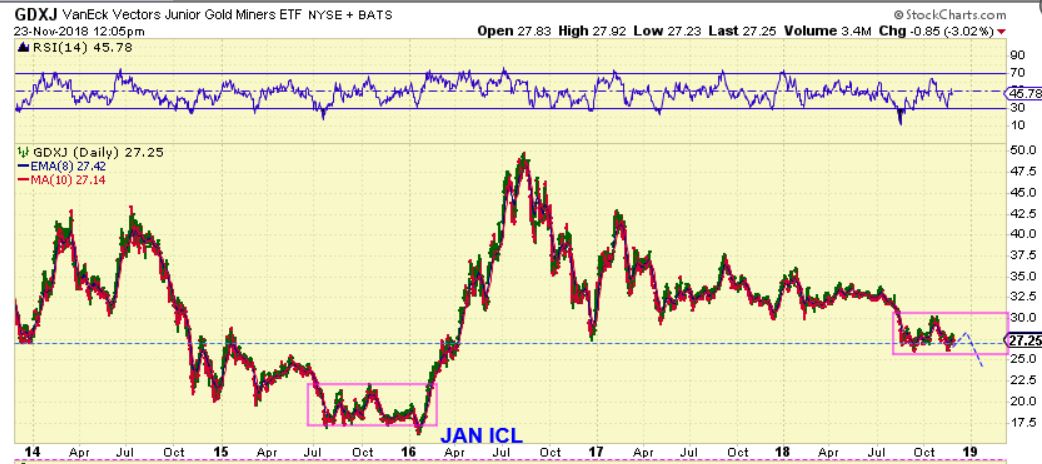
GDXJ – This is an update of a daily GDXJ chart posted in a recent report. Buying that reversal shake out was low risk, and we remain above the 10 sma, but I admit that this is uncomfortable.
GDXJ BIG PIC #1 – If I were to compare the 2015-2016 complex base with what I see now? We could still have a shake out ICL ahead.
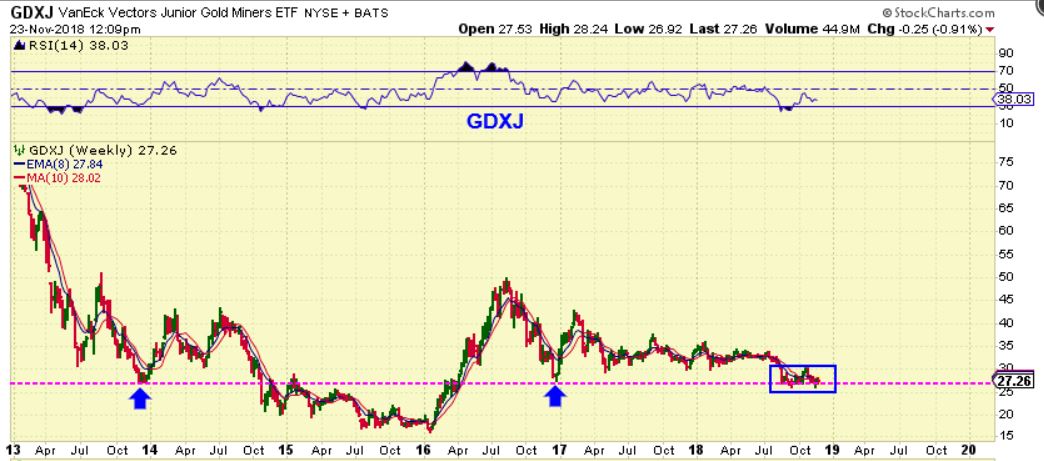
GDXJ BIG PIC #2 – If I look at GDXJ as having support levels, we are still above support after a mini-shake out.
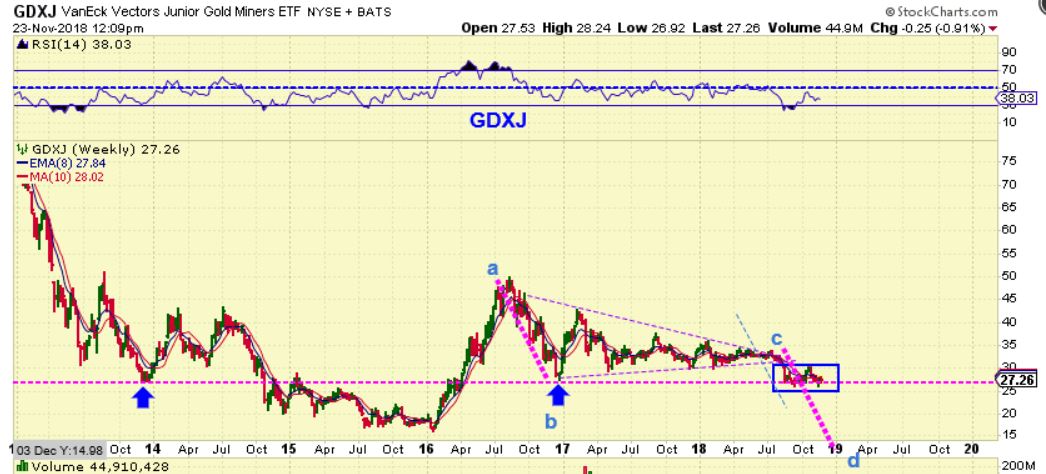
GDXJ – The dreaded a-b = c-d ( Again, the current COT does not seem to support this idea, but it has to be presented as a cautionary note). ‘c’ can also be taken from the highest bounce off of ‘b’, so the blue line has been added.
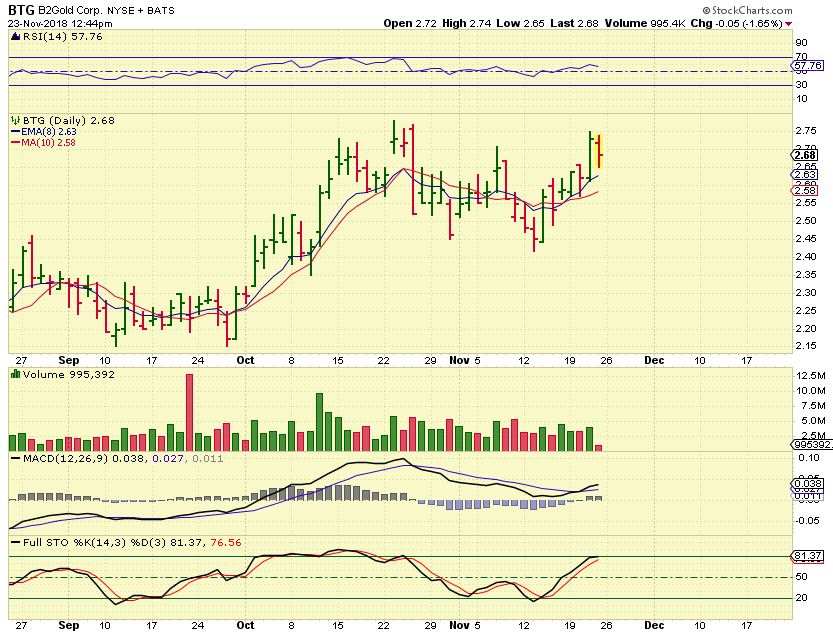
We discussed many Miners that continued to show healthy charts with all of the choppiness, and as of Fridays drop, they remain bullish. BTG is an example:
BTG –
So at this point we still have Choppy General Markets threatening to break down further. OIL has been relentless in its sell off, and broke a major trend line, which may not bode well for the longer term Big Picture, unless it can recover as a shake out. The USD Daily RSI looks to be weakening as it trades a 3rd daily cycle, it could ‘peak’ soon. GOLD & the MINERS are ok so far, but traders do need stops. They could push higher if the USD & Markets drop, but Gold is in its 3rd daily cycle. It can peak now through day 12 as left translated, or can push higher into day 20 if it wants. I gave short term Bullish scenarios ( a Higher ICL in Gold as Miners move higher) and a short term bearish scenario ( a drop to an ICL that breaks things down). We do have individual charts that remain Bullish for several Miners, and the COT seems to be Bullish, so I have to take it step by step and look for clues along the way.
.
Since almost all of the sectors in these markets have been choppy, smaller position size and cash on the side lines can save one from frustration or big losses, until the real moves set up & take place. It has been a difficult market to trade at this point, but with time & patience, this choppy indecision often leads to better set ups and bases.
.
I hope all enjoy the rest of the weekend, and we’ll just see how next week continues to add detail to our charts. Thanks for being here at Chartfreak!
.
~ALEX
.
IN THE BACK OF MY MIND:
.
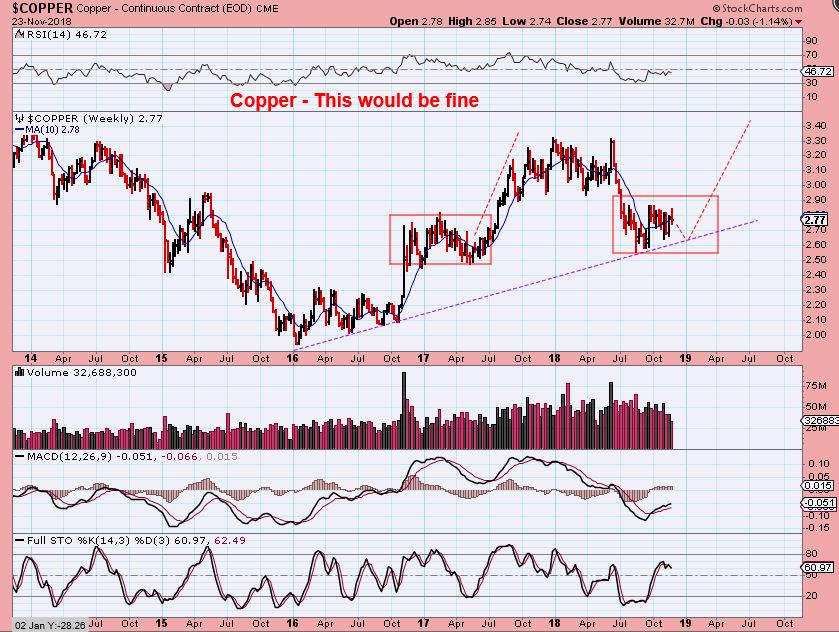
COPPER #1 – Copper is at a long term uptrend similar to what Oil just crashed through. I would have expected ‘inflation’ to continue pushing up the commodities, but when Oil crashed down (and Gold dropped rapidly this summer too), I wanted to look at this chart of Copper. THIS WOULD BE BULLISH. A consolidation similar to 2017, but…
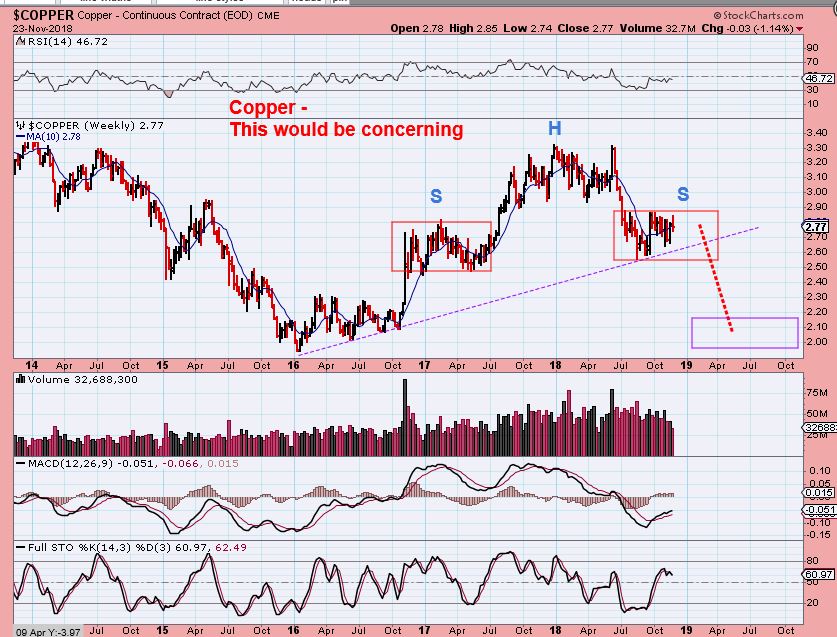
COPPER – That consolidation was a continuation higher. If this forms as a continuation lower? I’d see a broken trend line and a H&S. Not good. So I am watching Copper, Steel, Aluminum, etc. It could be due to tariffs and not affect Precious Metals, but I want to keep an eye on things.
.
FROM LAST WEEKS REPORT
.
I showed this a week ago too, this is a reminder. Do you remember this complex base that formed right before the 2016 launch? It was 1. a choppy complex base that broke down to a shake out. 2. Then it re-gained the 50 sma, then the 200 sma, and then launched higher, and left most behind.
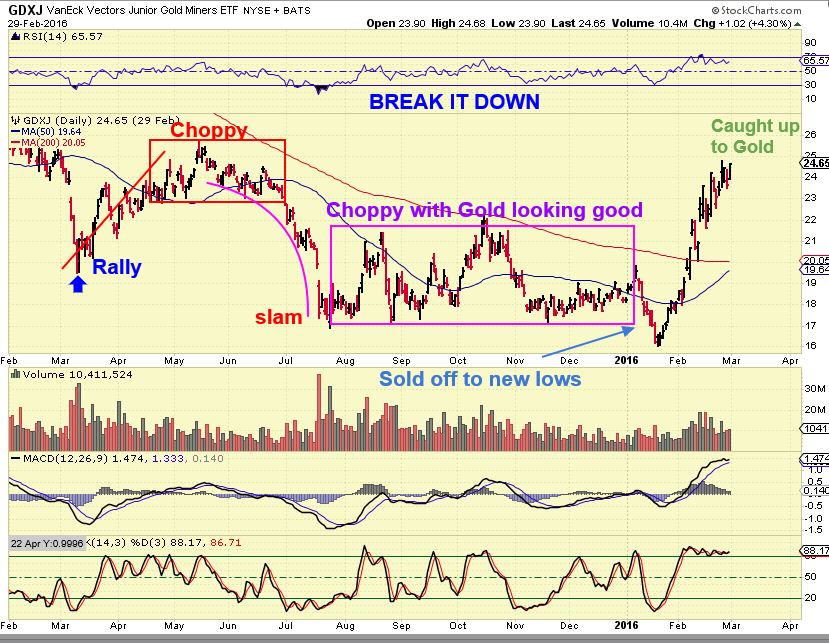
Currently we have: 1. A choppy complex base that broke down to a shake out. 2. Then it gained the 50 sma. 3. Will it run to the 200 sma? 4. Could this leave many behind? Scroll up to the 2015 chart above again & scroll back to this one & compare the two.
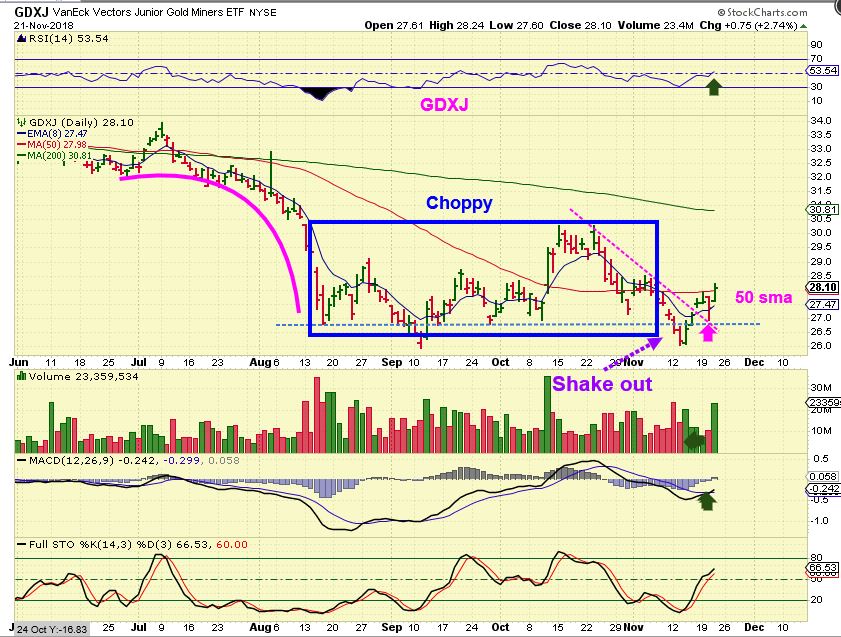
There was also this future shake out possibility. We use stops JUST IN CASE THE Current Complex base, shake out & Launch needs more time and does a bigger shake out into the next ICL. Scroll up & down.