Nov 10 – Weekend Review
It was a bit of an exhausting week with the constant volatility and choppiness in various sectors of the markets. let’s review this weeks market activity….
.
IWM DAILY – I drew this on Nov 8 saying that short term, I would expect the markets to pull back due to this light volume rising bear wedge, however…
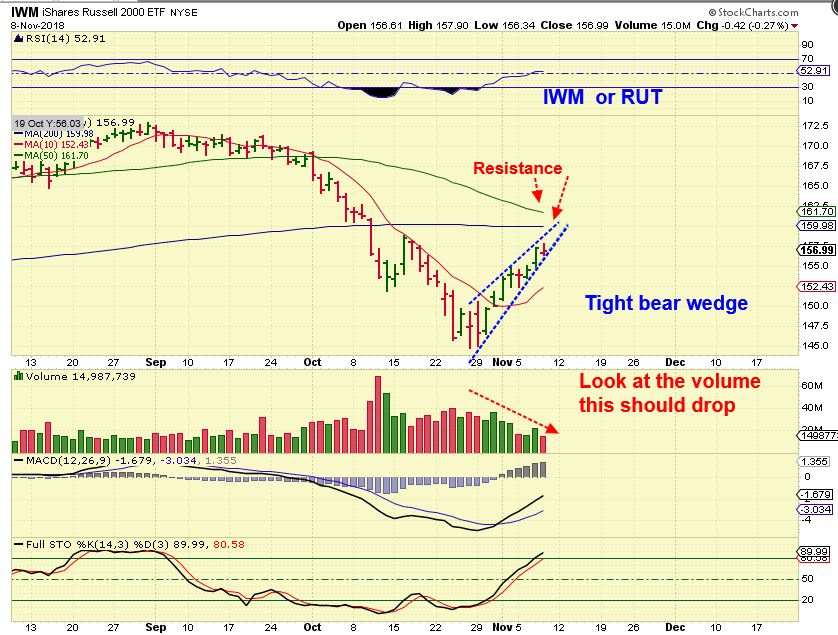
IWM DAILY – That doesn’t mean a big pull back, it may simply be this tag of the 10sma…
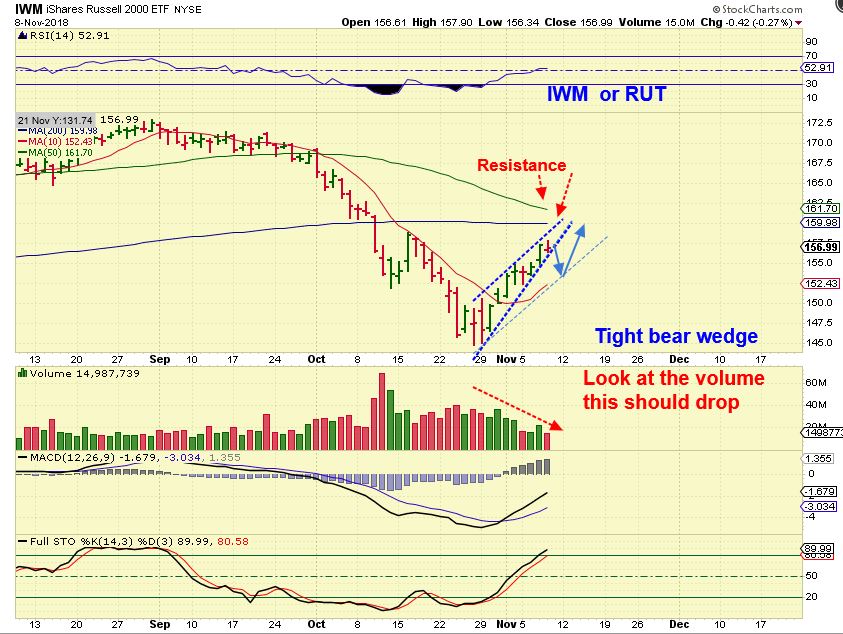
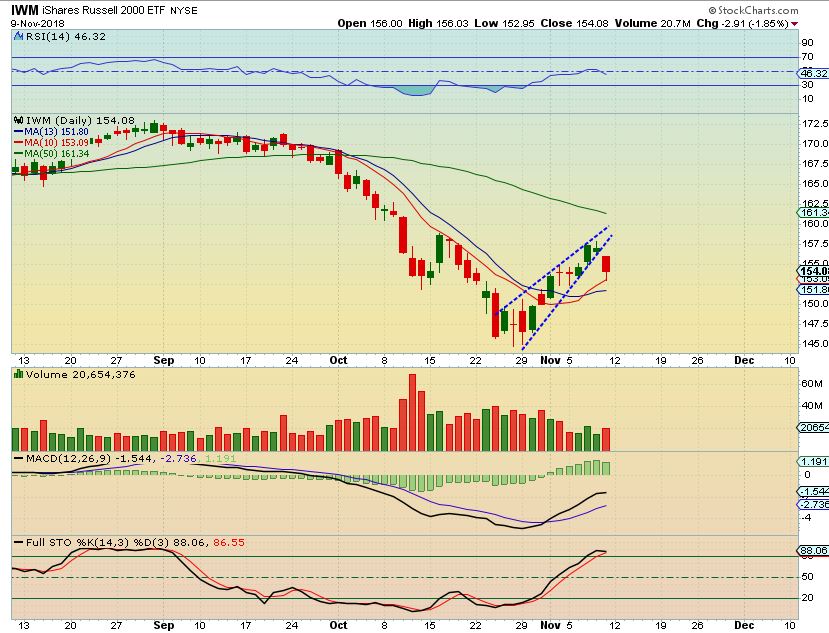
IWM DAILY – And so far that is what we have. IWM dropped and bounced off of the 10sma.
Now let’s look at the Bigger picture...
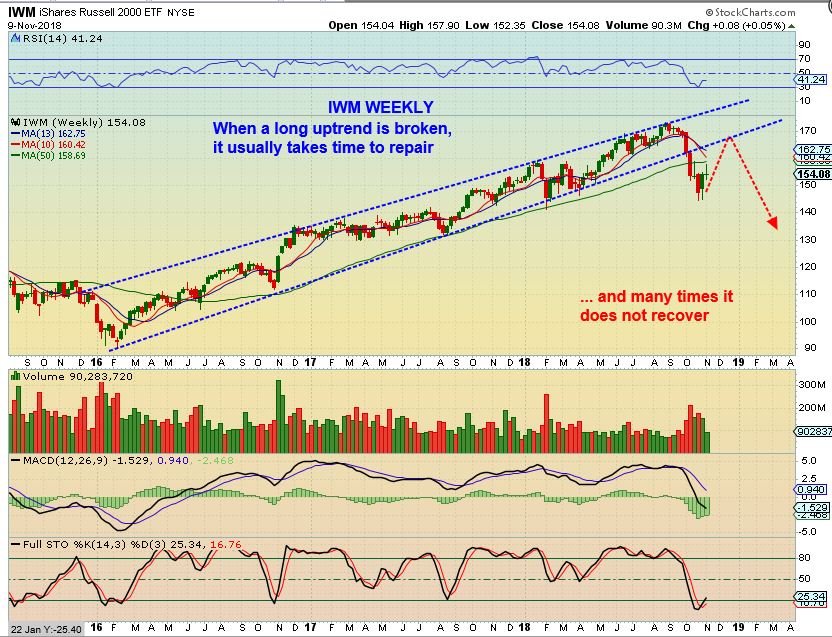
IWM WEEKLY – There is a broken up-trending channel in the General Markets and IF that is going to recover, it often takes time. That being said…
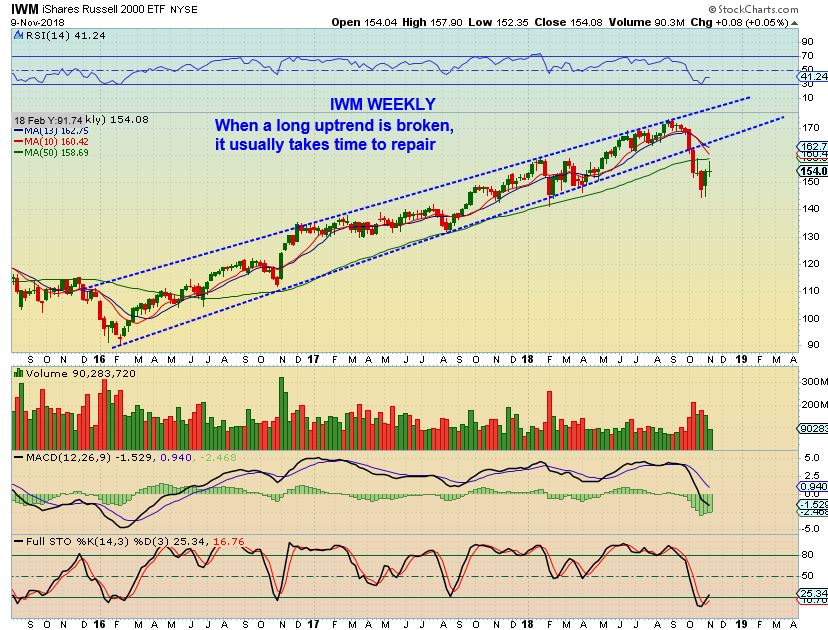
IWM WEEKLY – The markets very well could have topped. We will know more as this plays out, but the next stop is trying to get from the ICL to back test or recover that trend line. Price was rejected at the 50 week MA (green line) last week.
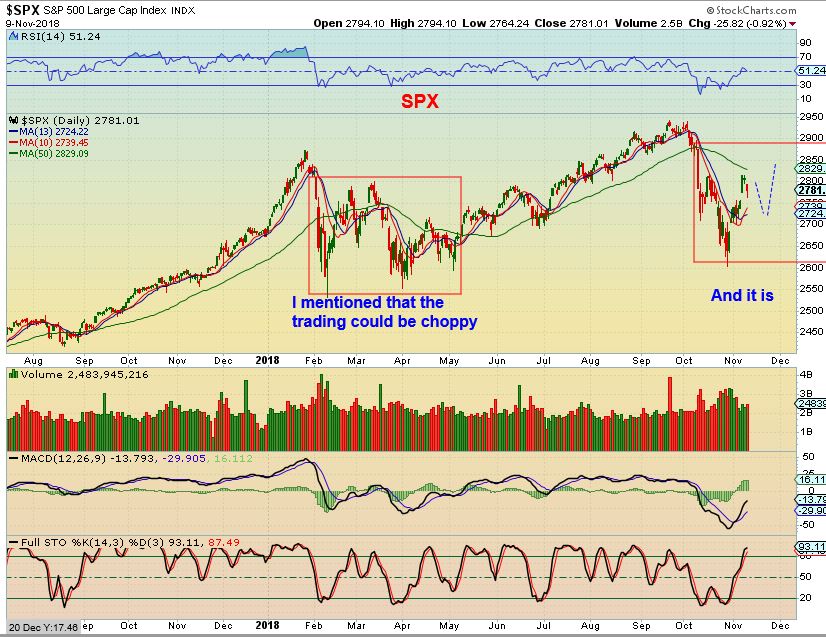
SPX DAILY – I mentioned a possible drop and inverse H&S. If we have an ICL in place, the lows should at least hold for over a month, and we should see a good bounce.
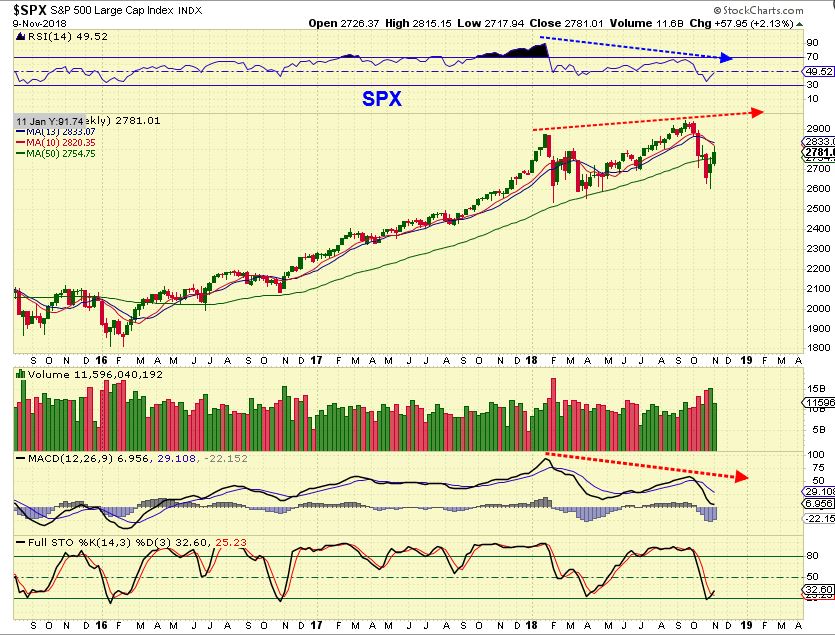
SPX WEEKLY – price was rejected at the 10 weekly ma. That was strong divergence at the double top, and this honestly could be a double top where 2019 is just choppy or drops and cannot rally to new highs. There are cracks appearing in the bull market.
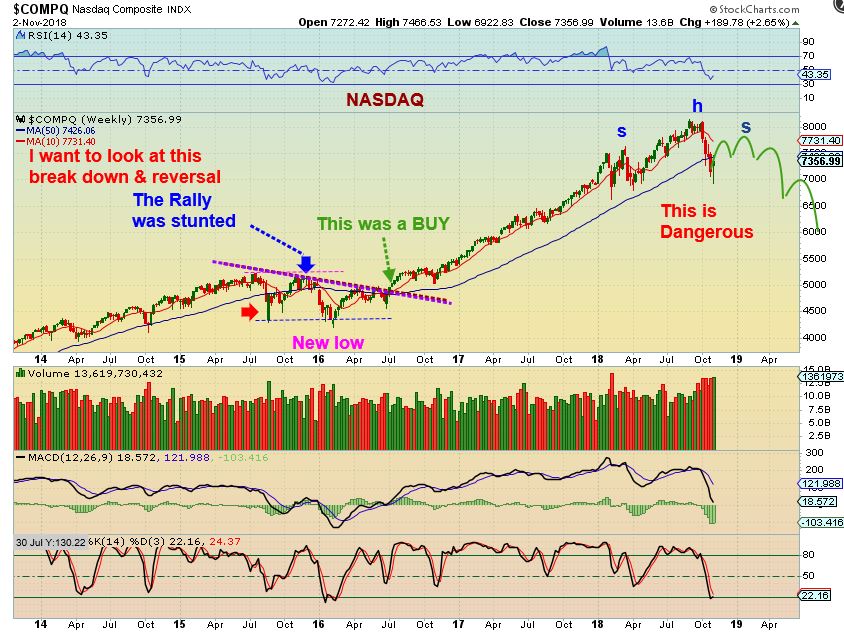
NASDAQ REMINDER- I drew this as a possibility last week. I mentioned watching the next 2 daily cycles & the former leaders like SQ, SAIL, CY, MU, etc for clues.
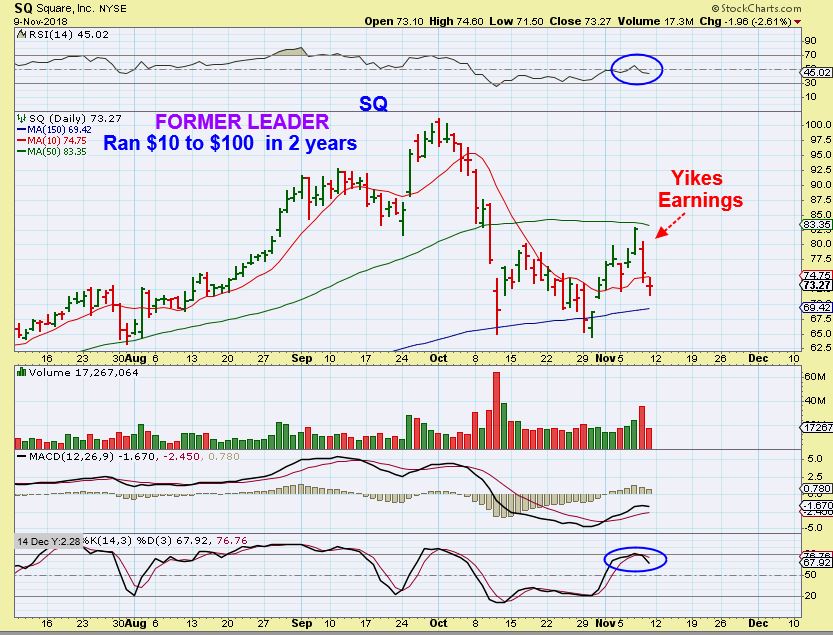
SQ – This former leader ran to the 50sma, and just when it was due for earnings, I thought that that may push it above. Price was rejected at the 50sma so far. These are the things that I am going to be watching for. Remember that NFLX, FB, GOOG, and so on already crashed on this past summer earnings. They’ve now dropped for Months. Can they recover? Those might be good indicators o market health too.
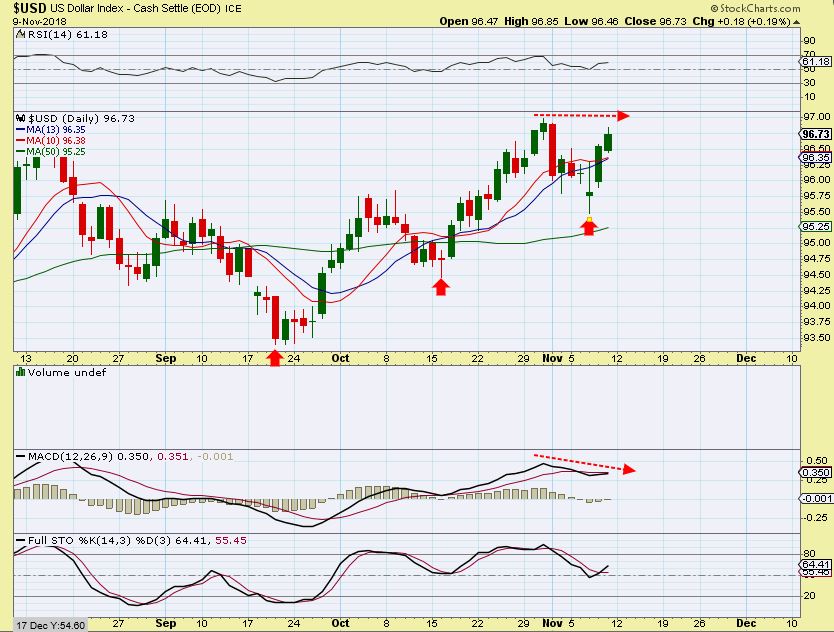
USD DAILY – The USD has been bullish since bottoming in September, and has what looks to be a new daily cycle starting.
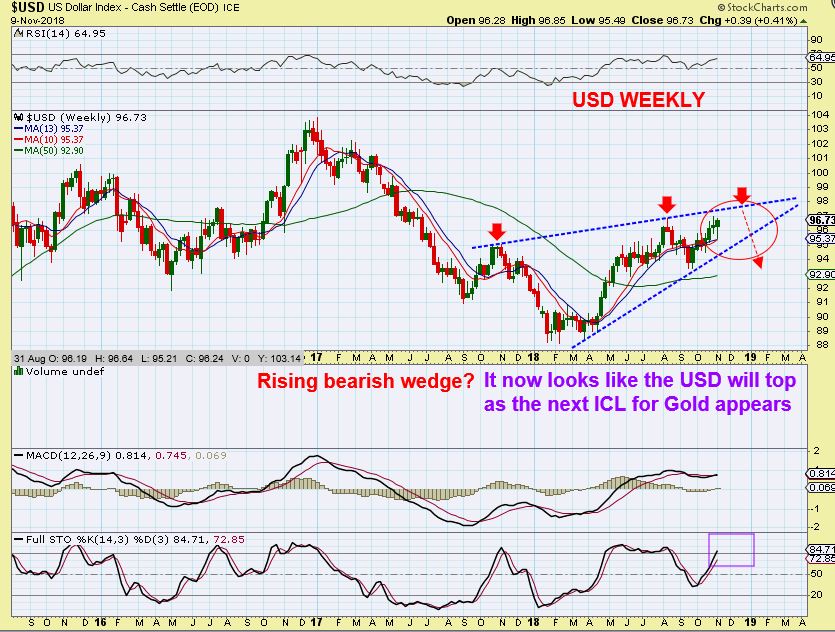
USD – I am watching this big picture pattern form as a bearish rising wedge. This has a little more time to play out, but would be bigger picture bearish. Could this top near Golds next ICL?
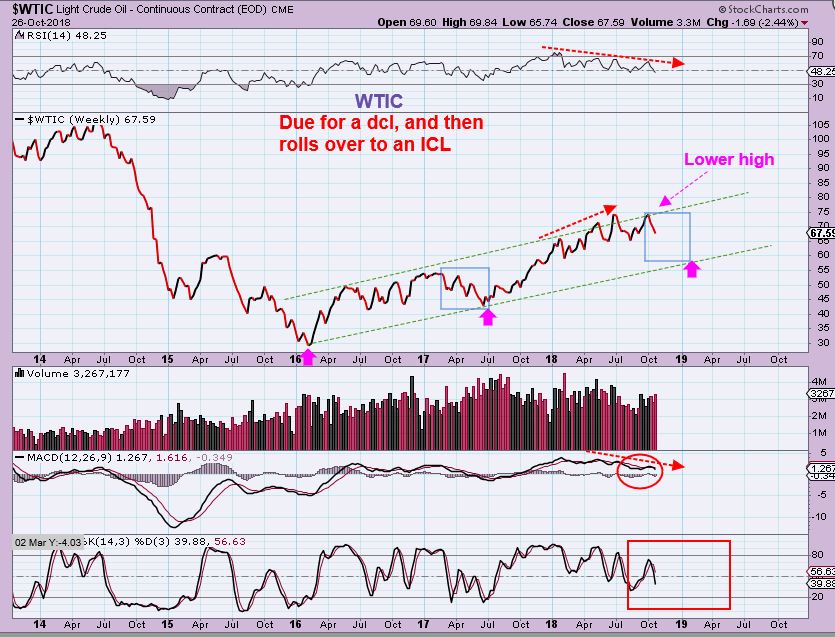
WTIC OCT 26 – Due for an ICL, This chart showed Oils was expected to drop near $60 in the Big Picture.
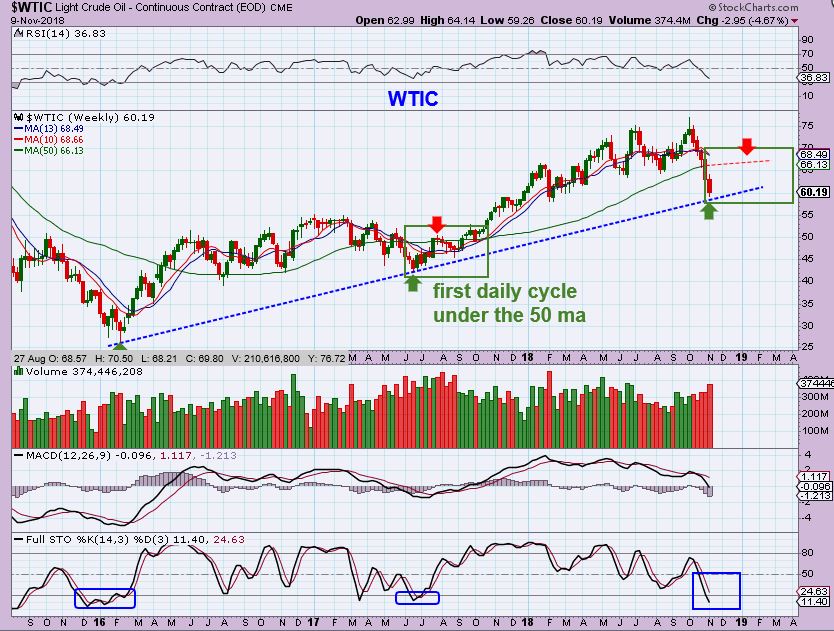
WTIC WEEKLY – it dropped straight down to $59.25 & bounced. This may be all it needs to do…
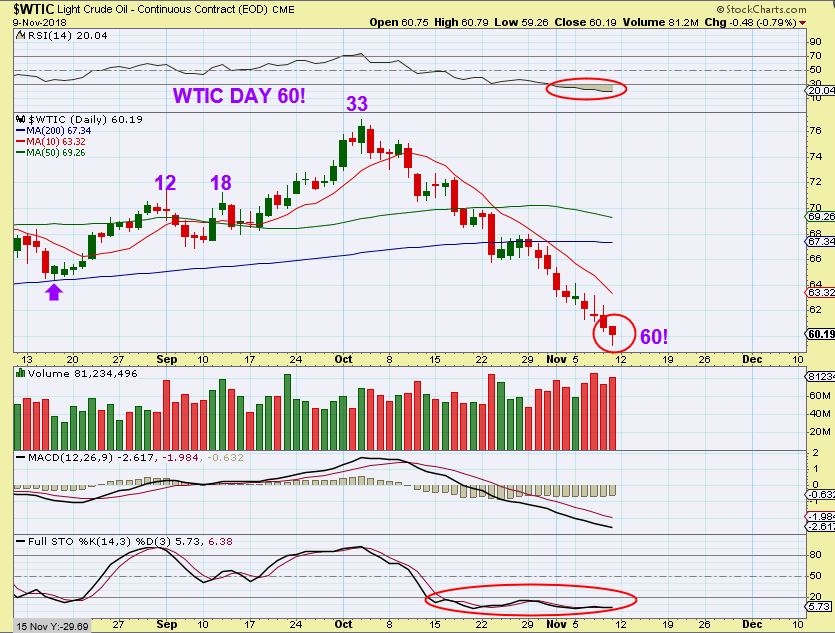
WTIC DAILY – And this reversal is on day 60, so I think Oils selling has run its course, watch for a swing low. UWT, USO, UCO are ‘long Oil’ plays.
.
I WANT TO HAVE AN EXTENDED DISCUSSION ON THE PRECIOUS METALS TODAY, MAINLY BECAUSE OF THE CHANGES TAKING PLACE THIS WEEK AND OBSERVATIONS AS TIME GOES ON. THE UPSIDE IS BEING CAPPED SO FAR AND SINCE TIME IS PUSHING LATER & LATER IN THIS INTERMEDIATE CYCLE, MY ANALYSIS HAS TO ADJUST ALONG THE WAY TO REMAIN HELPFUL.
.
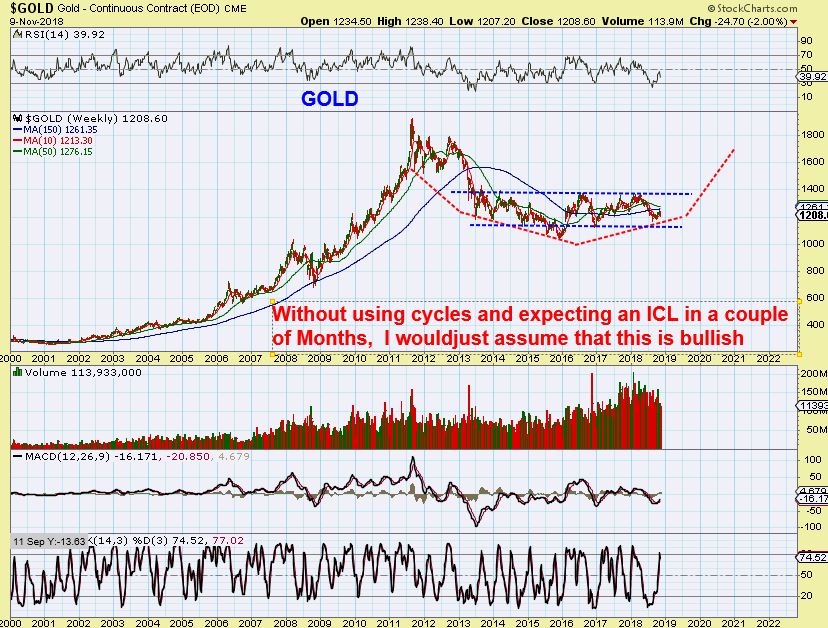
I AM THINKING THAT AN ICL SHOULD BE DUE 4-6 MONTHS FROM GOLDS AUGUST ICL. THE LAST INTERMEDIATE CYCLE WAS EXTENDED (8 Months), SO THE FOLLOWING ONE MAY BE SHORTER TO BALANCE THAT OUT. IF SO, THAT MEANS THAT TIME IS RUNNING OUT FOR UPSIDE GAINS. I HAVE A FEW IDEAS TO SHARE AND I CAN ALWAYS EXPOUND ON THIS AS TIME GOES ON. SO THIS IS THE LATEST ANALYSIS, INCLUDING ADJUSTMENTS.
.
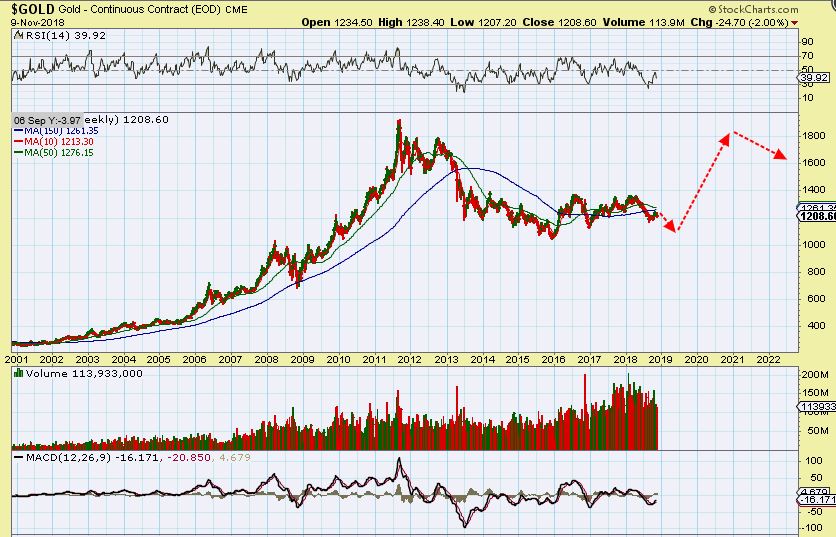
GOLD – This could be 2 daily cycles and the break below the 50 sma is a drop into a dcl at day 30. That was a big drop Friday, but…
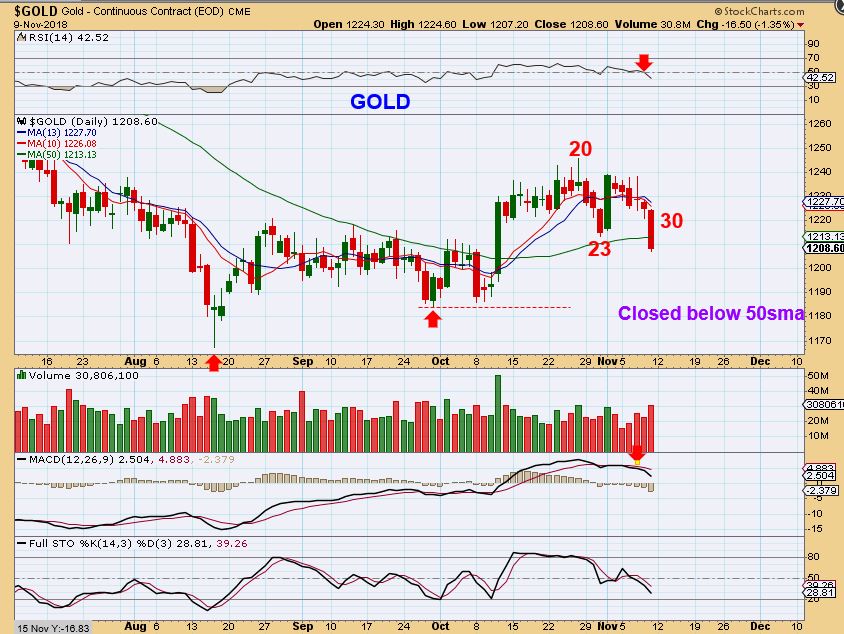
GOLD – We saw a big drop on Oct 8 reverse higher, so there is hope that we get a dcl soon. That said…
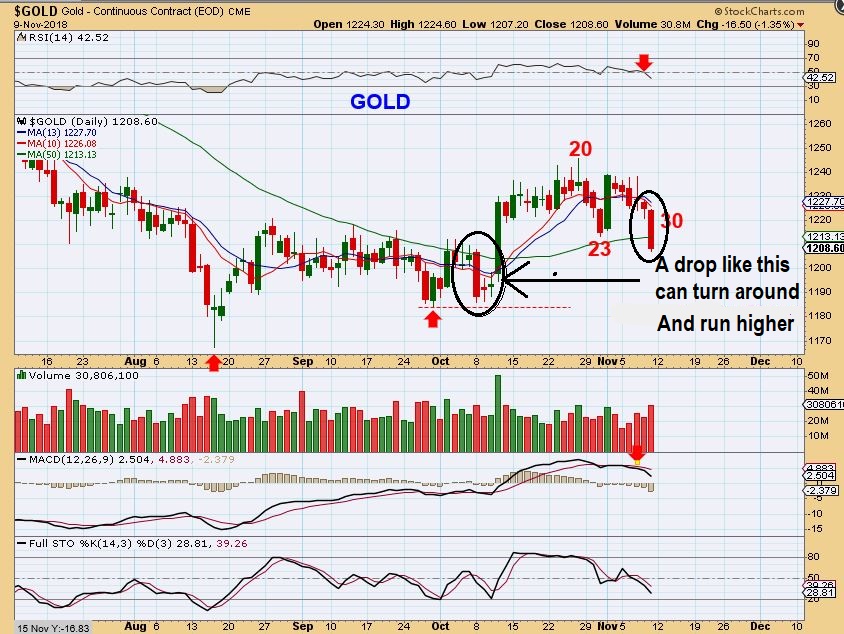
I DON’T LIKE THE MACD & RSI SUDDENLY in GOLDS above chart, SO I AM CAUTIOUS. As time goes on, this makes me believe that we may be heading into a more prolonged consolidation like 2015 summer, and eventually an ICL. From the Aug ICL, 4 months is Dec, 5 months is January, 6 is February.
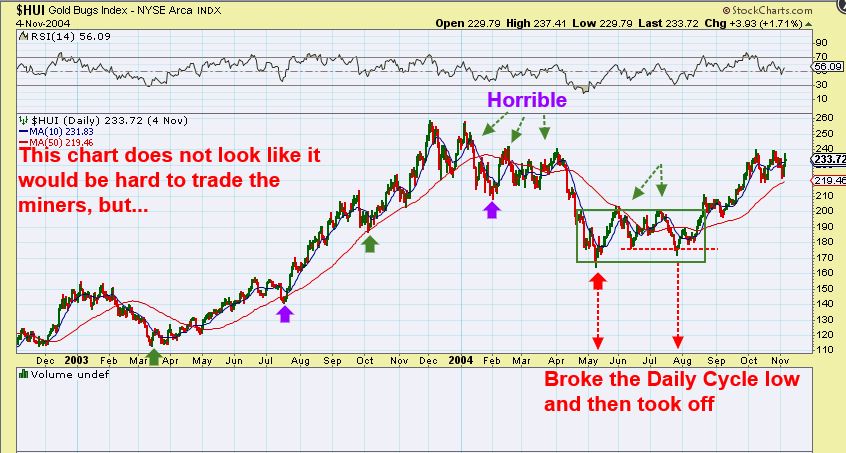
GREEN BOX – I pointed out the 2004 chop in Miners, where in July price plunged below the 50 sma & even the first DCL, and then recovered. Can Gold do that now? it can, but that isn’t normal cycle action, so I wont look for that – but this just shows that this drop in Gold at day 30 can stop & turn higher too.
GDX – GDX filled the gap, held on to the 50 sma, the uptrend is in tact. So this can be viewed as Bullish, HOWEVER, I DO NOT LIKE THE CURRENT WARNING SIGNS OF WEAKNESS at the Red Arrows. My stop was the 50 sma, but I SOLD MY LEVERAGE THURSDAY & WROTE IT IN THE COMMENTS. This can turn higher too, but I want to watch this without leverage now that I no longer have signs of strength, and I have small warning signs popping up.
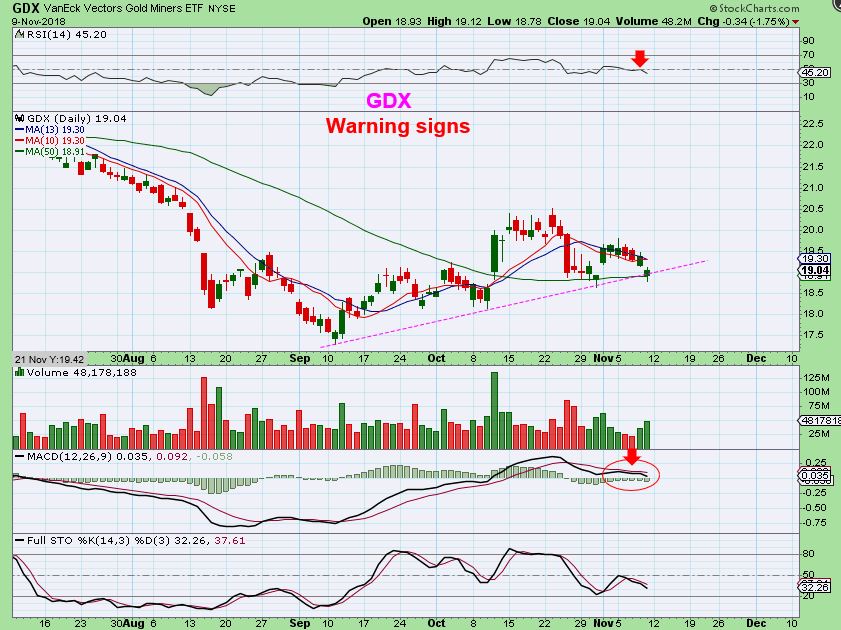
WE DISCUSSED THIS POSSIBLE SIMILARITY PLAYING OUT, BUT I WOULD NOT RIDE THIS WITH LEVERAGE, JUST IN CASE WE GET A DEEPER SELL OFF. I will discuss a deeper sell off later.
Since we are now about 3 Months in front of the Aug ICL for Gold, we should also talk about future possibilities as becoming more of a consolidation & possibly without a Major Rally yet. I started doing that recently and want to continue here.
.
NOW I WANT TO SHARE SOME OTHER IDEAS THAT I AM THINKING ABOUT CONCERNING THE LONG TERM OUTLOOK – SOME OF THIS WILL LOOK QUITE BEARISH SHORT TERM, BUT I HAVE TO SHOW THAT IF IT IS A POSSIBILITY.
.
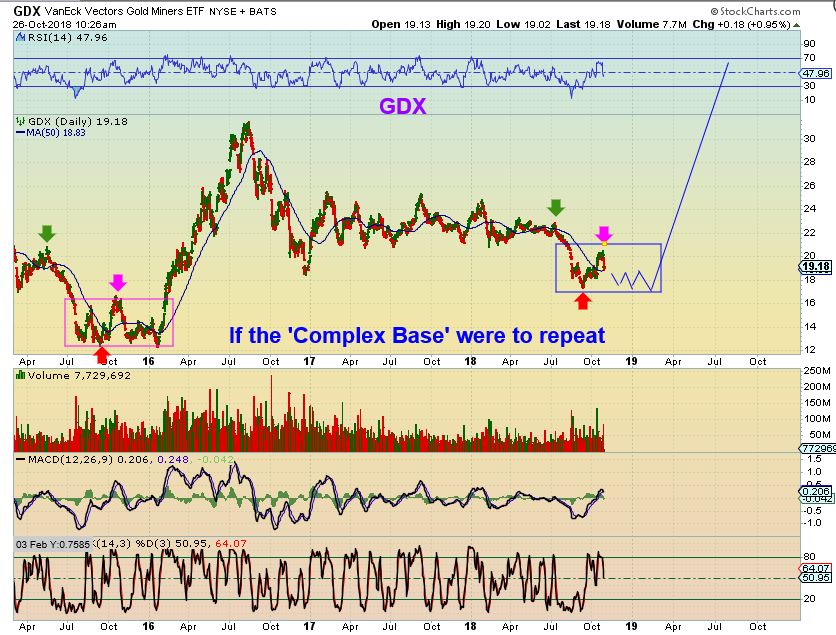
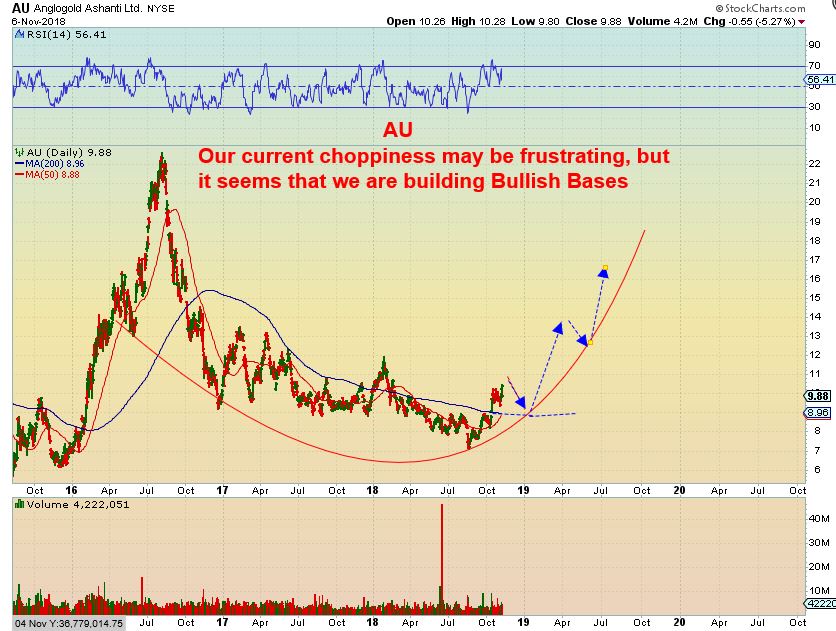
1. THIS WAS MY SHORT TERM CHOPPY, BASE BUILDING CONSOLIDATION INTO THE NEXT ICL IDEA, MATCHING 2015. This CAN still happen.
AU : A MINER – RIGHT NOW THE BIGGER PICTURE STILL LOOKS CONSTRUCTIVE FOR MANY MINERS. THESE ARE MASSIVE BASES THAT SHOULD PROVIDE MASSIVE GAINS ON THE UPSIDE WHEN THE TIME COMES, but remember, this is Big Picture, because short term some are still breaking recent lows.
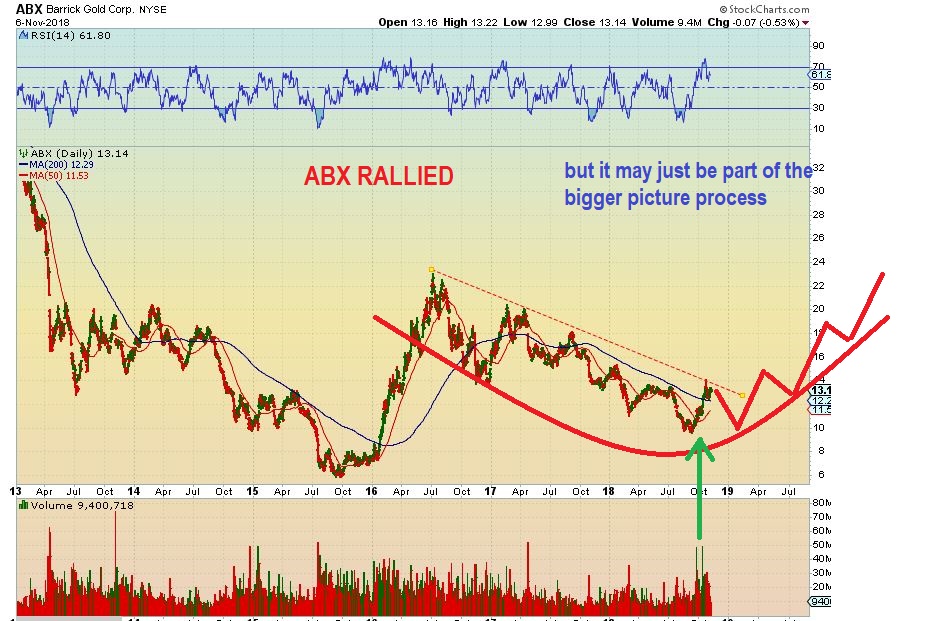
ABX has rallied nicely, but if we don’t get our big rally soon, we have to step back and look at the other possible ways that these are playing out. Notice that ABX had …
1. A series of lower lows, and lower highs since 2016 (down trend)
2. Now we finally do see a higher high, so the next low could be a higher low
3. And that starts the uptrend ( higher low at the next ICL?)
.
NOW FOR THE MORE SHORT TERM BEARISH IDEA
.
NOW I HAVE TO GET TO THE ” THIS IS STILL BULLISH LONG TERM, BUT WE MAY SEE A DEEPER DROP THAN EXPECTED SHORT TERM” (into the next ICL). Please note: This is just an idea that I want to throw out there. The sideways choppy base seems likely with the Smart Money COT levels still bullish and sentiment so low, but I have to present this idea.
Follow my thinking step by step here, and you will see how I got to this. I feel that we will be better prepared for anything, if we discuss everything!
.
-
GOLDS BIG PICTURE IS STILL BULLISH TO ME. A sideways consolidation would slowly begin building the cups right side.
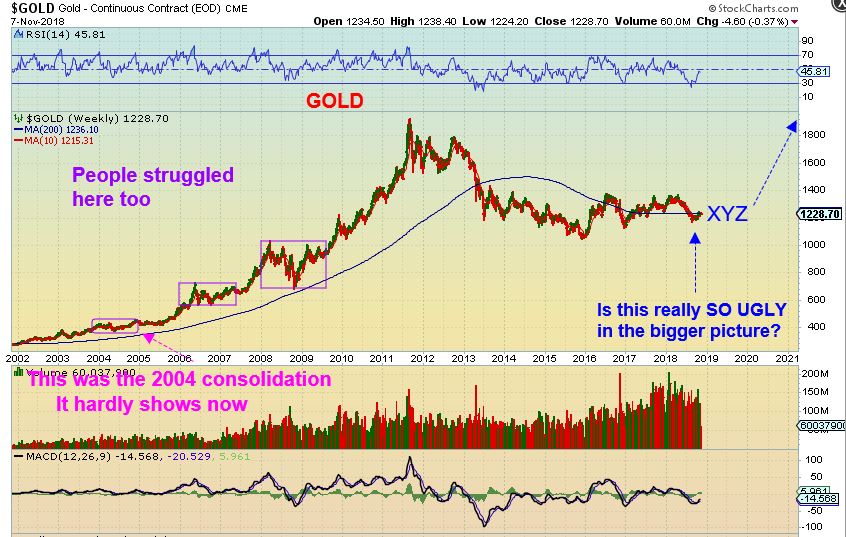
2. But I also looked back at many bases with Cup-like charts that I have traded in the past. I noticed that ‘double bottoms’ formed in a good number of them. They can form as a ‘higher low’ or a ‘shake out low’. Again, IF THIS HAPPENED, a higher low seems likely due to the smart Money positioning in the COT currently.
3. Same chart as #1, but I just wanted us to take a look at the box for the long 2006 consolidation. It had a double bottom too, before the cup formed with a run back to the highs.
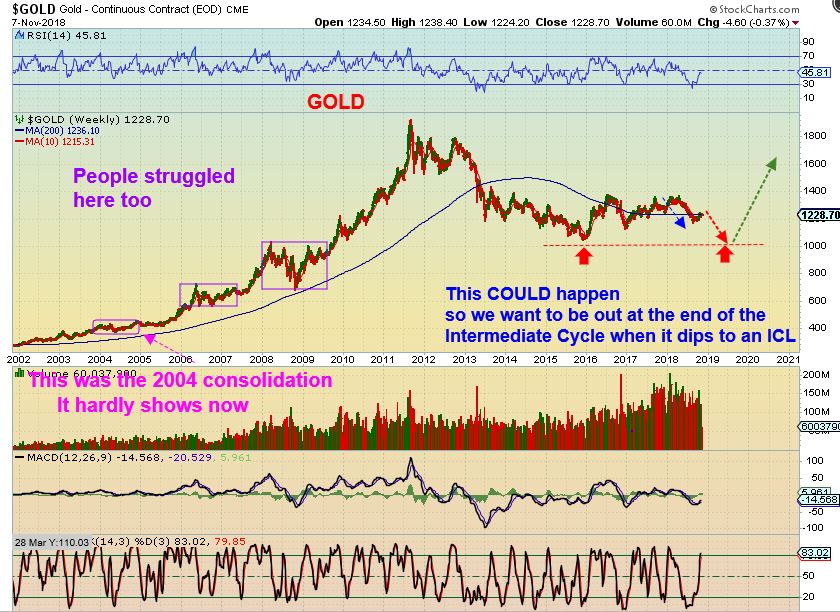
I drew this next chart midweek, when in my report I said that I would discuss a downside possibility in this weekend report. Here I am trying to show a possible steep drop to a double bottom by the next ICL.
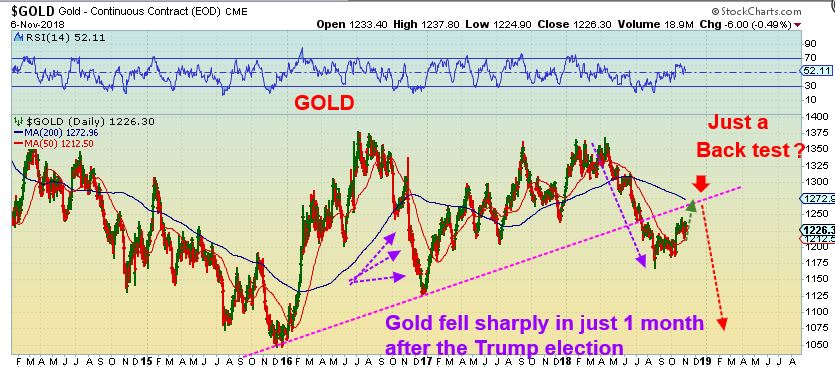
4. GOLD broke a trend line, and this bounce in our ICL could just be a back test and not the ‘shake out & recovery ‘ that I was predicting. If it is a back test, then Gold could drop sharply 1 more time into the next ICL. In Magenta, I am showing an equidistant drop. Yes, that is the 2016 bottom. Several Miners look too good for this, but I want to look at this anyway…
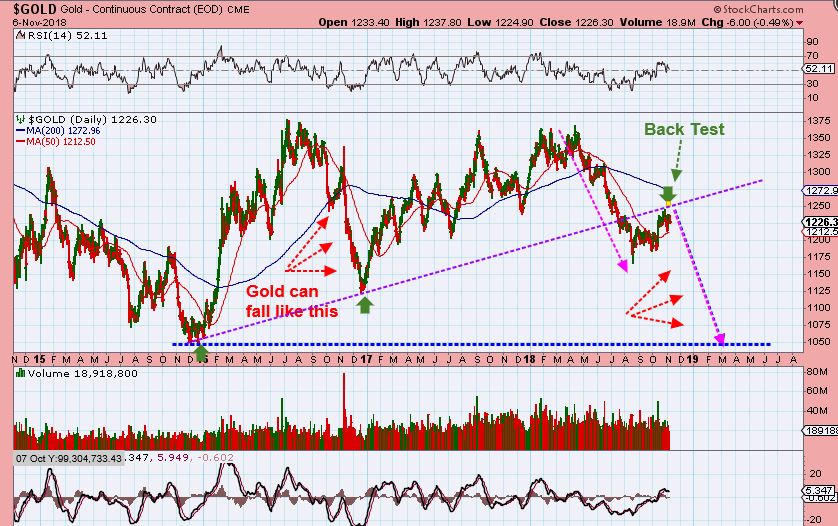
5. Also the drop after trump got elected in 2016 was so sharp, that it started after the Nov Election and ended at the Dec ICL or in 1 month. That was a sharp 1 month drop. If a drop like that can occur in 1 month or so, that could be the next ICL timing for December or January.
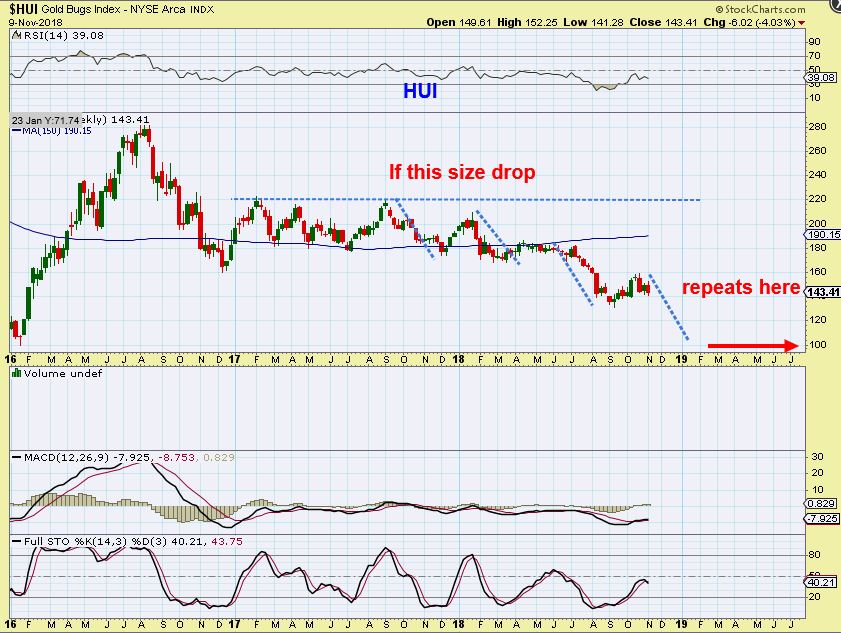
AS FOR MINERS? IT IS POSSIBLE THAT THEY MAY RESIST SOME OF THE SELLING AND RUN SIDEWAYS / CONSOLIDATE AS SHOWN IN THE OTHER CHARTS SIMILAR TO 2015, AND BUILD BASES. SMARTER MONEY MAY BEGIN OR KEEP ACCUMULATING AS GOLD SELLS DOWN. IF NOT, LET’s REVIEW A MINERS DROP LIKE THAT…
HUI – Miners may hold up better and resist the Gold selling ( if that sell off even happens), but here I have drawn an example of HUI following Golds selling. They would repeat the last sell off into Sept lows, since most of them were also equidistant (Blue Lines are similar in length). HUI $100.
I WILL LEAVE IT ON THIS NOTE
.
This current COT for GOLD is still at prior ICL levels, it just doesn’t seem to call for a deep sell off into another ICL. The sideways consolidation & Chop would seem more likely. THIS COT IS BULLISH ACTUALLY, READ THE CHART.
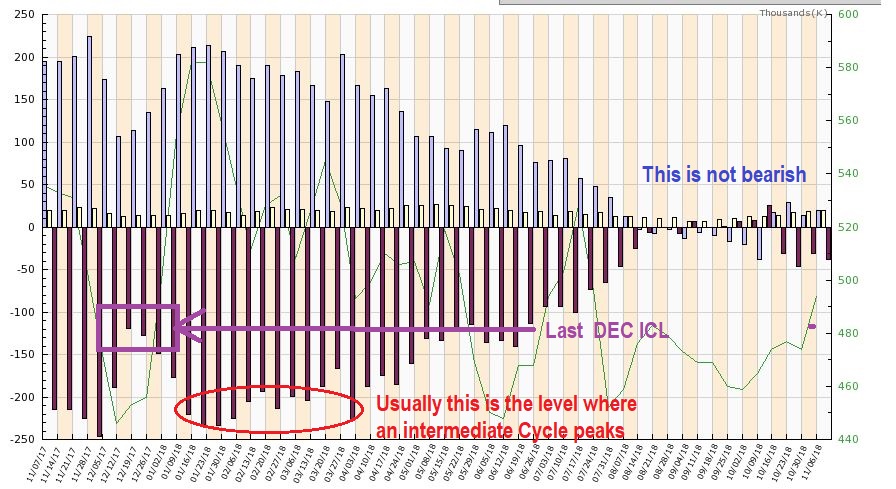
Without Cycle timing, I would definitely have expected a run higher before a pull back here. I would look at this as a giant Cup forming with a massive base. You can see that a break & RUN to former highs from that base would even be better than the 2016 run inside of that base.
.
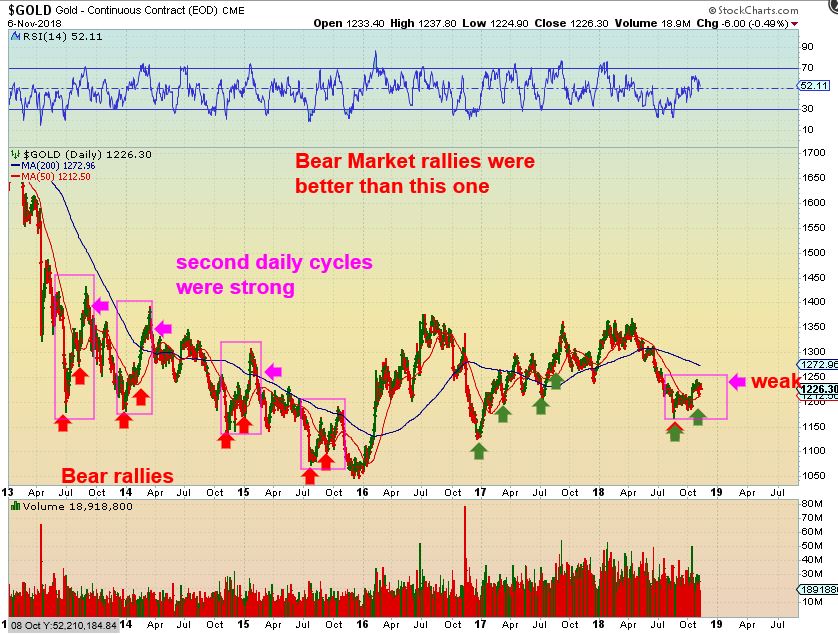
CONCLUSION: So we got a small rally out of the Gold August ICL and Miners September ICL, but it only moved briefly higher and then went sideways so far. Disappointing when you consider the way things were set up, and it really doesn’t make a lot of sense! Is that all we are going to get before a dcl, a bounce, and then another drop into the next ICL starts? It seems very odd, since I have seen Bear Market rallies that put this one to shame, but time is running out for a great rally.
These were great bear market rallies in the squares, usually 2 daily cycles long. This one has been Tight and puny so far.
I do want to say that I still believe that what we are seeing here is really ‘expectations postponed’ and not ‘cancelled for good’. This does not look or act like a bear market in the big picture. The stronger relentless rally out of an ICL may be Delayed if this next daily cycle cant get it going. It is frustrating, trust me, I remain calm and calculating through the cycles, but this has been a bit frustrating. I was holding JNUG from basically $7 ish, rode it to $9.75 twice, and sold it for $7.35. I held most for a month and a 1/2, but I did also trade some!
The current set up right now, when you include the COT, Bearish Sentiment, Cycle timing, yet now Gold back below the 50 sma , etc. etc. etc. , is really a mixed message right now. I don’t get emotional because I want to keep an open mind & clear head to the various possibilities here, but since we are near the middle of the intermediate Cycle, I also dont want to hold my leverage right now. If things shoot higher in this sector, I’ll make adjustments going forward. I will obviously continue to monitor the changes as they develop in this sector. Oil may be putting in an ICL, and XLE bottomed a while ago, so that area may offer some trades too, while we are watching and waiting for things to develop in Precious metals.
.
Enjoy the rest of the weekend, and once again thanks for being here at Chartfreak!
.
~ALEX
.
Just An Illustration: When we get to an ICL in a sector ( like Gold in August or like the General markets and likely Oil now), it is a lot like an artist beginning a new painting on a blank canvas. They may tell you that it will be – A Covered bride on a mountain side– for example, and you’ll know vaguely what to expect. The may show you the colors that they’ll use as they ‘set up’, and you get a better idea of what the picture my include, what things may look like, but only as time goes by do you get to see a really clear picture. In the move out of an ICL for GOLD, we get a good idea of what should come about when we look at the COT, Sentiment, Patterns that formed as the sell off finished up , etc. too, but as time goes by, the real picture presents itself.
.
As that artist paints, and gets about 1/2 way through that painting, you begin to see more clearly how things are developing. Is it looking good? Is it not so great? The color that he or she used for the foliage on the trees appears. Now you see the covered bridge, but maybe they added a steam train with smoke billowing from the stack as it is climbing that mountain. The picture is no longer just a vague idea of what to expect, you begin to get a clearer visual presentation to observe. Finally, when that painting is completely finished, it becomes 100% clear. You now see the hazy mountains in the back ground, a bight covered bridge, a black steaming locomotive, even people, birds, and a river.
.
Well, we appear to be 1/2 way through this intermediate cycle and from the start EVERYTHING was in place for this to be a Beauty! We had Extreme sentiment levels , the COT was extreme, some Miners started leading the way higher, etc, and that paints the picture for a strong rally higher out of the lows. Now many weeks later, it would seem that this dull old painting would never sell. With all of the right things in place for a beautiful run higher, so far this sideways chop has been rather boring at best. It is not over yet, and there is time for it to get better, but hope is fading. What this intermediate Cycle has done, however, is added another portion to the base forming in Gold. Another chunk of time to build a bigger base. The bigger the base, the higher the space, when it breaks out and runs.
.
Again, This is the big picture so far, painted by many smaller Intermediate Cycles. 2016 was the best run recently, but I can picture better ones down the road if this plays out as a large cup. If this painting doesn’t improve by the end of this intermediate cycle, at least the canvas still has plenty of room for improvement and the big picture set up does still look quite bullish so far. As time drags on, even if we dip down from here, we can still hope for that Big Picture Cup & Handle Painting please…