Expect Light Holiday Tradin’ ?
One would expect a light volume holiday trading week, but so far many of the charts that I looked at have normal or average volume. Maybe it will lighten up each day, but let’s take a look at what trading took place after the weekend report.
.
SPX – The markets have been choppy and instead of that inverse H&S pattern breaking back above the 200 sma again, Monday the Markets dropped.
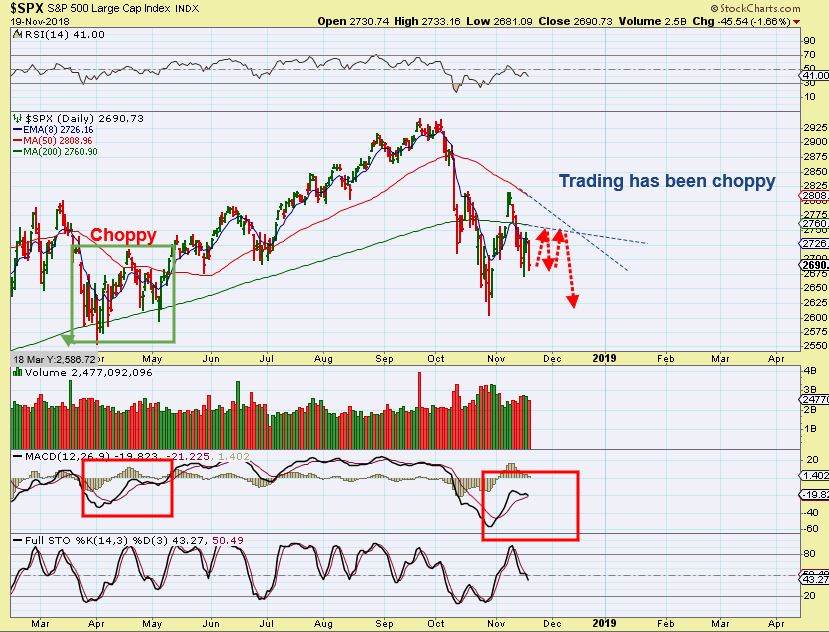
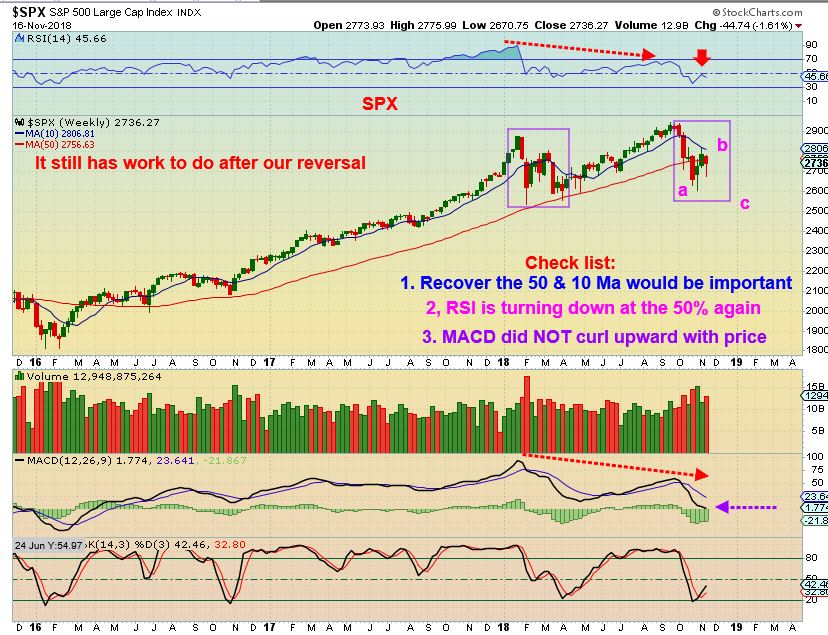
I used this chart in the weekend report along with the increasingly ugly charts of FB, GOOG, NVDA, and even the IWMs lack of strength, to show the current weakness. I warned again that if we don’t see strength soon, we may see an a-b-c drop that looks like this on the General Markets Weekly Charts.
The first chart in the report, the Daily chart of the SPX, is not bad. The 2nd higher low is still well above recent lows, but the IWM & NASDAQ Are weaker. Let’s take a look…
.
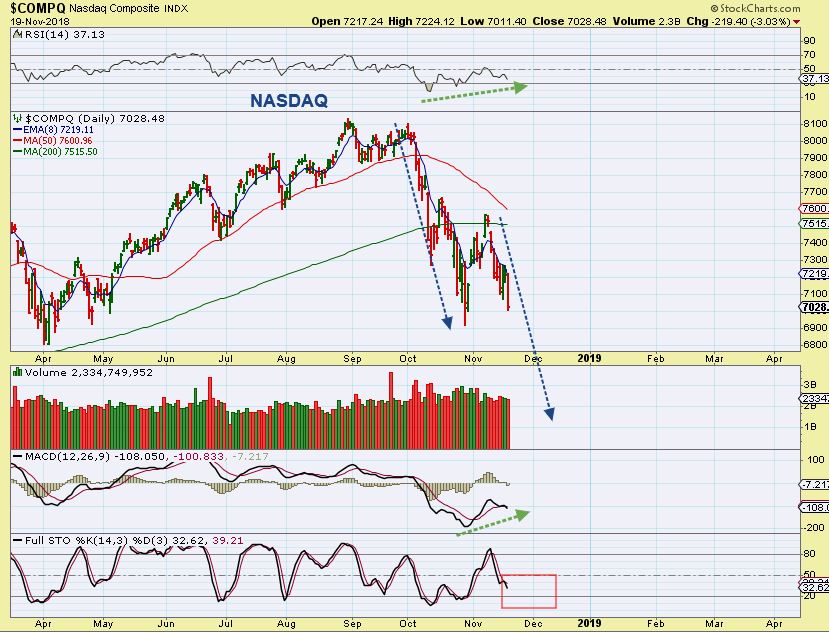
NASDAQ – That higher low is getting close to the recent low. A break of that low is bearish. Notice on this chart that I have pointed out the difference between drop last February & March, with our current drop. This is an uglier set up and could remain choppy or even weak for a bit, but I do expect an ICL, and timing-wise, we may have one in place.
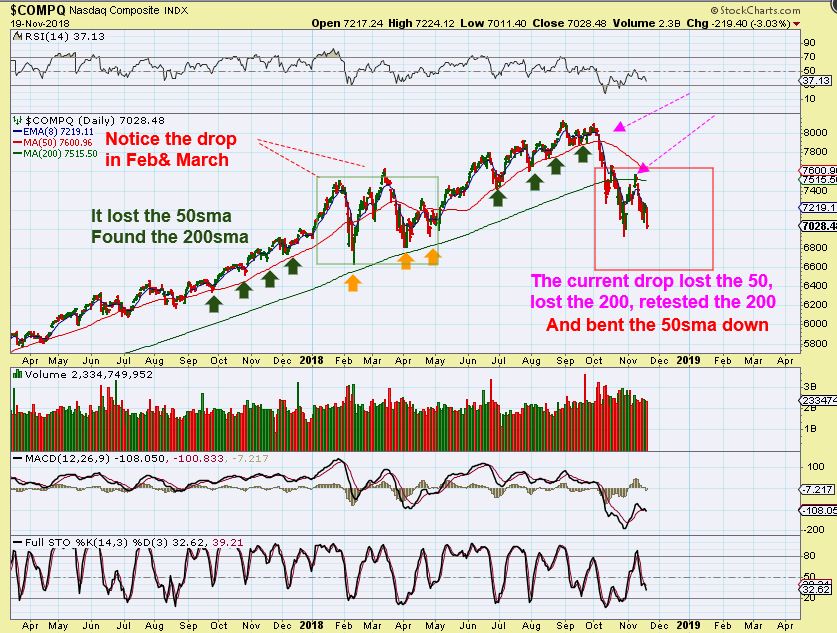
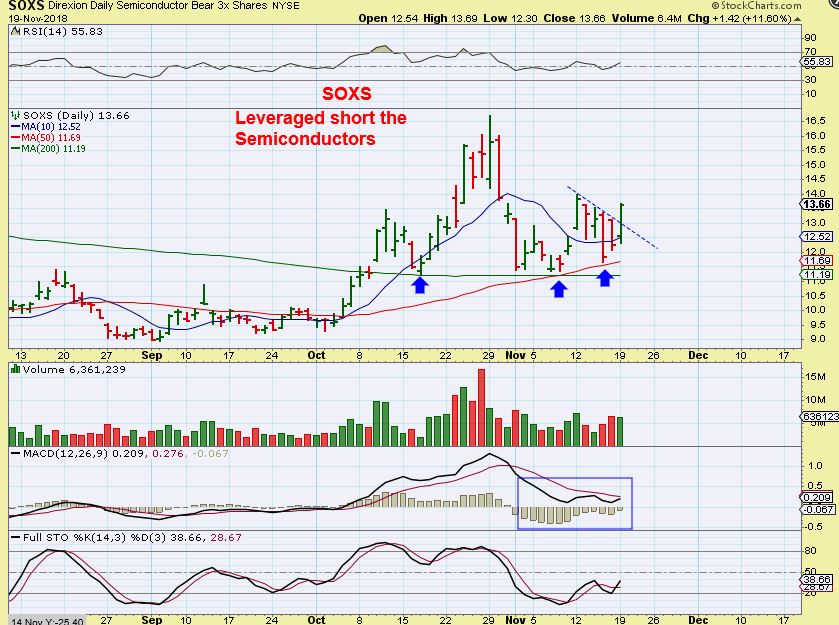
NASDAQ – A break of recent lows means that that was not the ICL expected yet, because this would be the first daily cycle and it shouldn’t just roll over this soon. There is rather large divergence, so these lows could hold up. That said, I did take a ‘trade’ short using the SOXS. THIS IS JUST FOR A SHORT TERM TRADE, I’ll watch it daily.
SOXS – This is the SOXS chart. It may just double top, but $13 to $16 would be great for a quick trade. The chart of SOXS & SQQQ look bullish for right now.
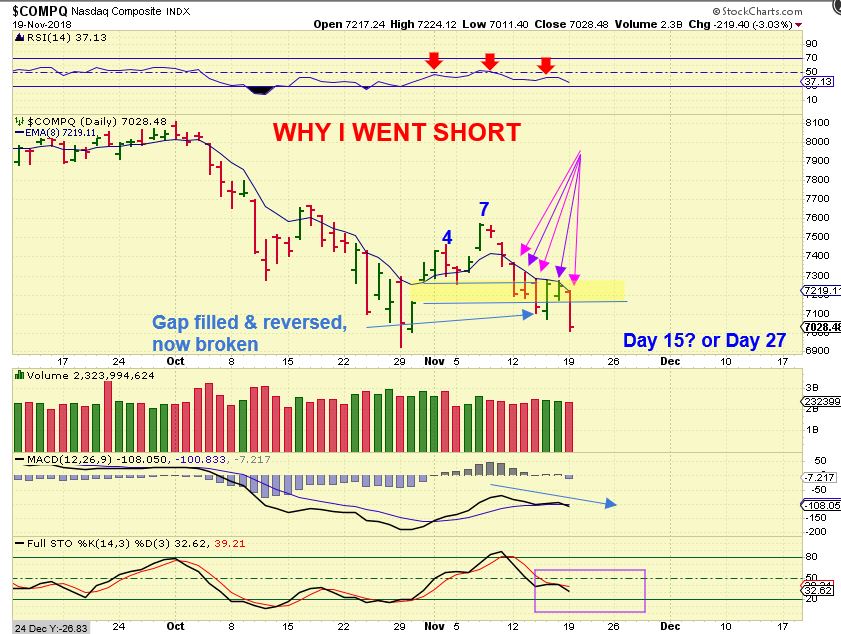
NASDAQ SHORT – It is possible that the recent low on the 29th was a not the ICL, but a 1/2 cycle low and the OCT 11 low was a dcl, so this would be rolling over into an ICL. It is also possible that the Oct 29 Low was a dcl. Either way, the MACD & RSI are currently drooping & it looked weak, and SQQQ & SOXS looked bullish.
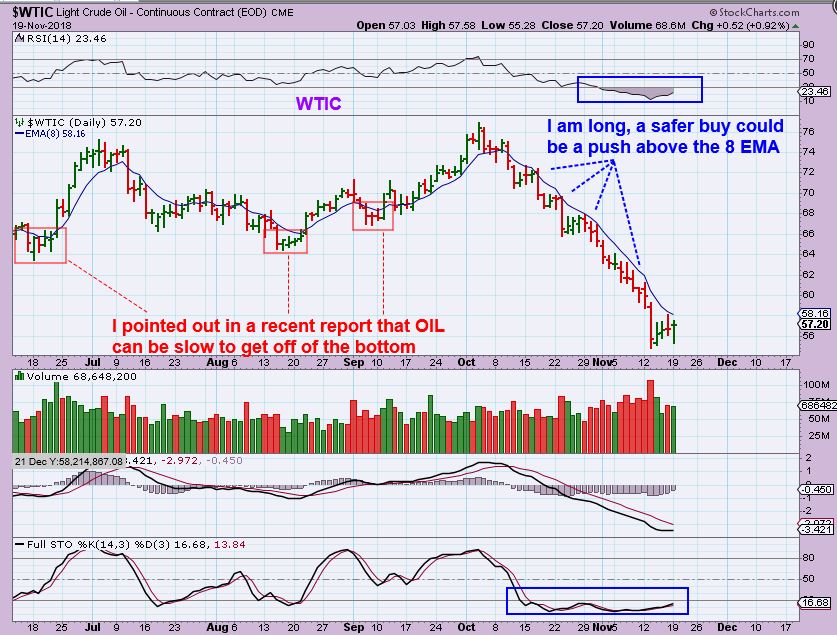
WTIC – So far, so good. OIL dropped to the lows Monday and recovered again. See the chart. A break above the 8 ema would be great.
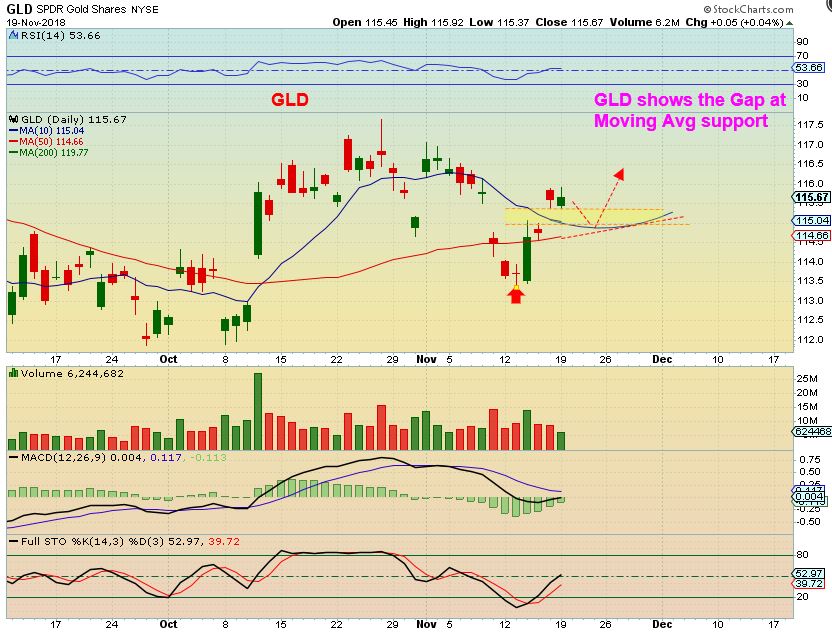
GLD – I’m just using the GLD to show the gaps, and to point out that it is possible that GOLD & MINERS pull back and fill those gaps, without damaging the bullishness. GDX & GDXJ have gaps too.
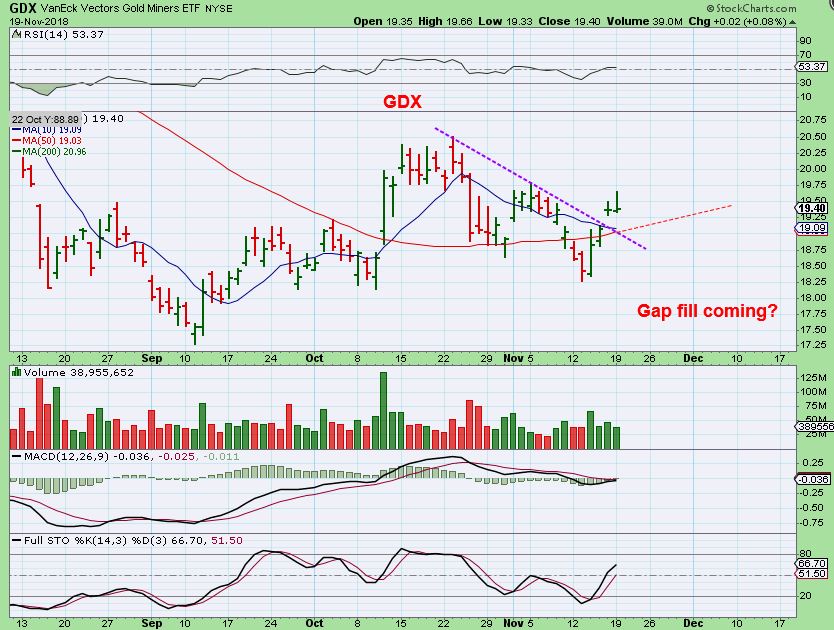
GDX – Similar gaps and a gap fill would tag the 50sma on day 5 if it happens Tuesday.
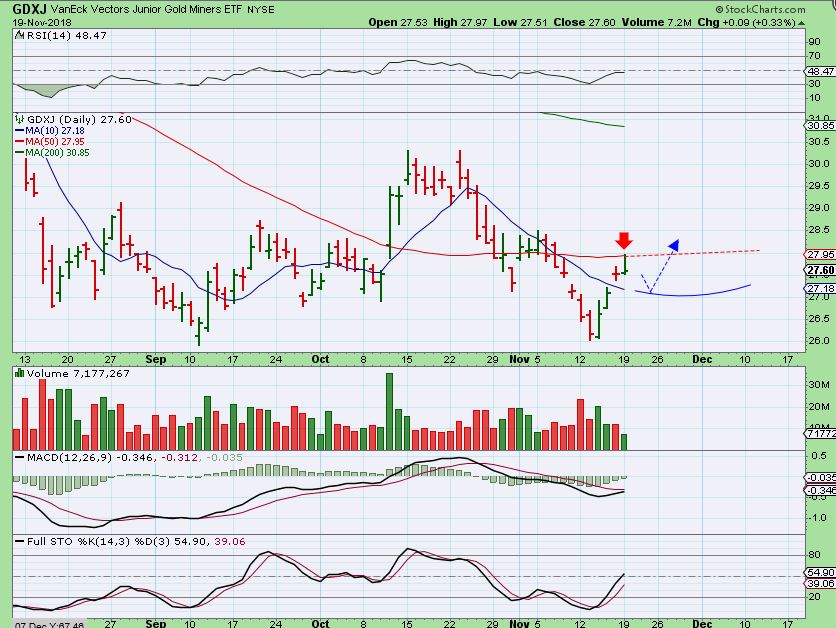
GDXJ – GDXJ was rejected at the 50 sma and it could fill a gap and tag the 10 sma, so in this sector, a drop would be acceptable, as long as it didn’t get too serious.
So nothing has really changed from our expectations, and day by day we’ll just have to watch and see how things play out this week. Again, trading could take place on lighter volume as the week goes forward, and the moves may not have conviction if that is the case. It is usually easy to push light volume markets around. Interesting to note- the Thanksgiving holiday week is usually Bullishly biased in the General Markets, but so far day 1 has seen a bearish drop. Lets see what Tuesday brings! Enjoy your Tuesday trading!
.
~ALEX
.
I just quickly wanted to cover a couple of ENERGY & MINERS Stocks, to show a few of the things that I am looking at in these sectors. I have already pointed out several Miners in past reports. If the Energy Sector is to become increasingly bullish, this is what I am watching now. I do think that we have a low in Oil, but if the Energy Stocks do not perk up more, it may be a sign that we have a dcl instead of an ICL in Oil. Let’s take a look…
.
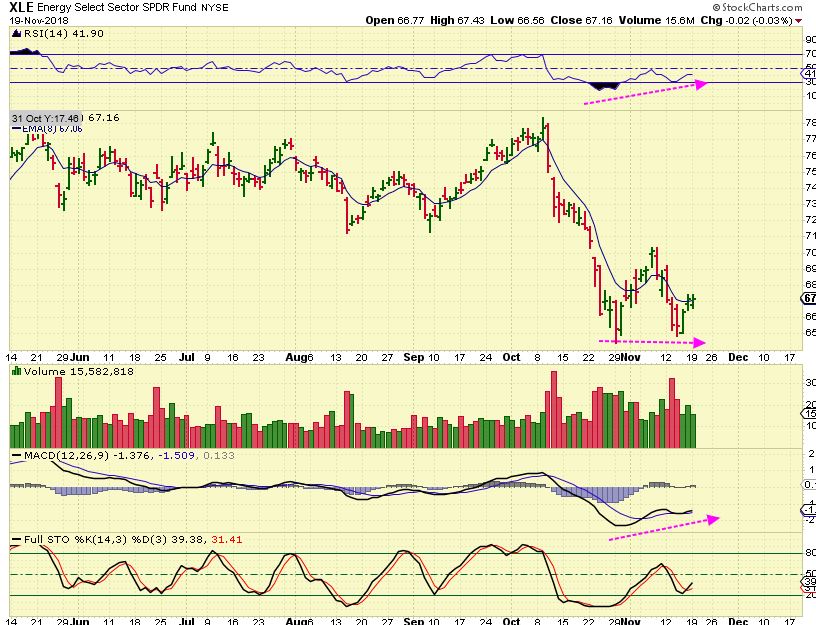
So far the XLE is a nice double bottom here and therefore the ERX could be a buy here. The OIH is not as pretty, but it MIGHT be bottoming with a new lower low. So I am looking at stocks in this sector…
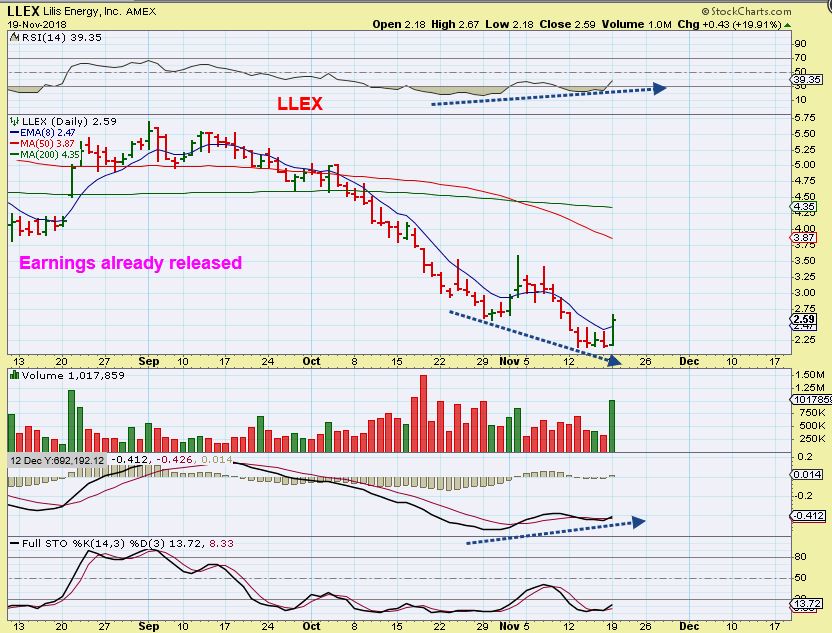
LLEX is similar looking to the OIH
.
LLEX – So this is a new lower low too, but look at the bullish divergence and higher volume POP Monday. This CAN be bought right here with a stop under Mondays lows, since earnings have already been released. It popped like this in October & rolled over, but that may be due to Oils sell off.
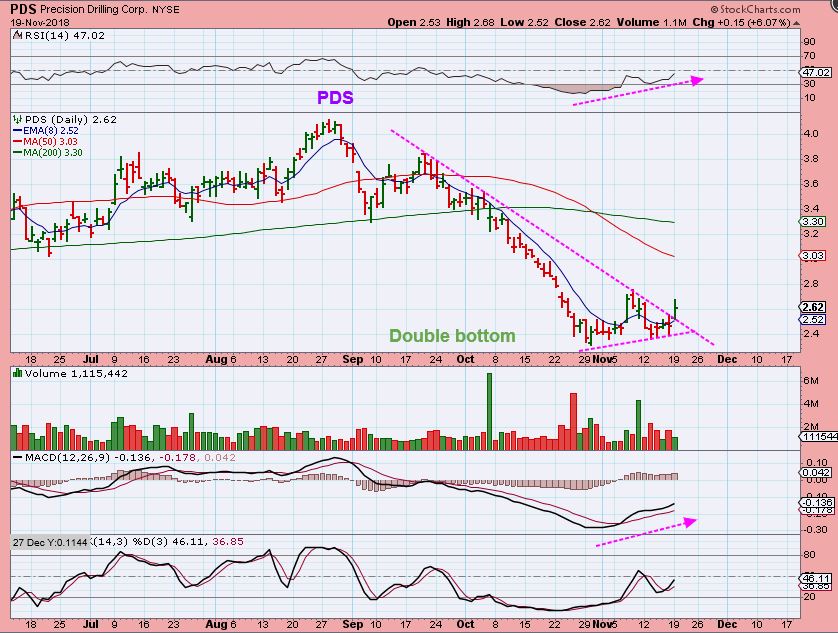
PDS – This double bottom broke out and the MACD is strong, and the RSI is at 50% already. I hate the moving averages, but after such a sell off in Oil to a possible ICL, that could be expected. Let’s just view these as good set ups for short term trades, with the hope that they keep pushing higher. This chart of PDS looks good, but…
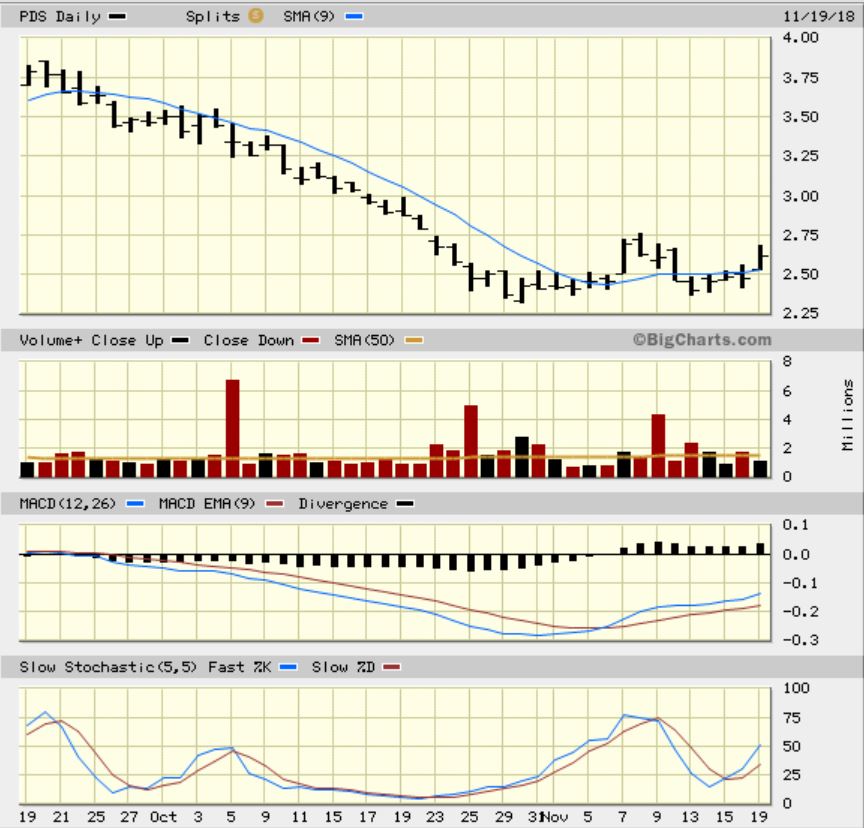
PDS – This close up looks even better. It is more of an 18 day base with a pop in the middle. That rising MACD makes this look ready to go right now. Even $2.60 here to $3 or $3.25 is a good trade, but this could run even higher.
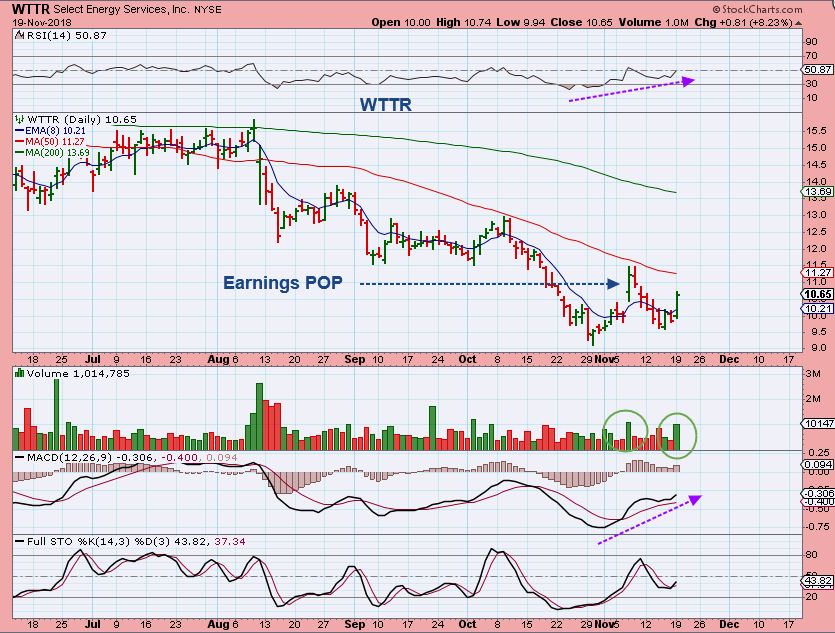
WTTR – THIS ONE I LIKE A LOT TOO. Why? Earnings POPPED price, and then it sold off to a higher low until Oil found a bottom. The POP to the 50 sma is encouraging with that MACD rising very strongly.
MINER REVIEW:
.
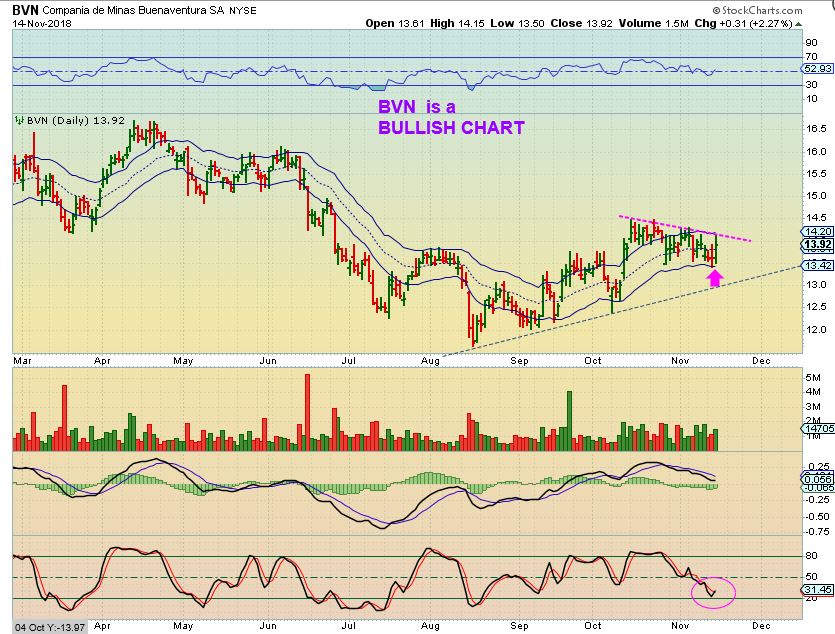
BVN – Nov 14th, this Miner was bullishly set to break out. It was a buy…
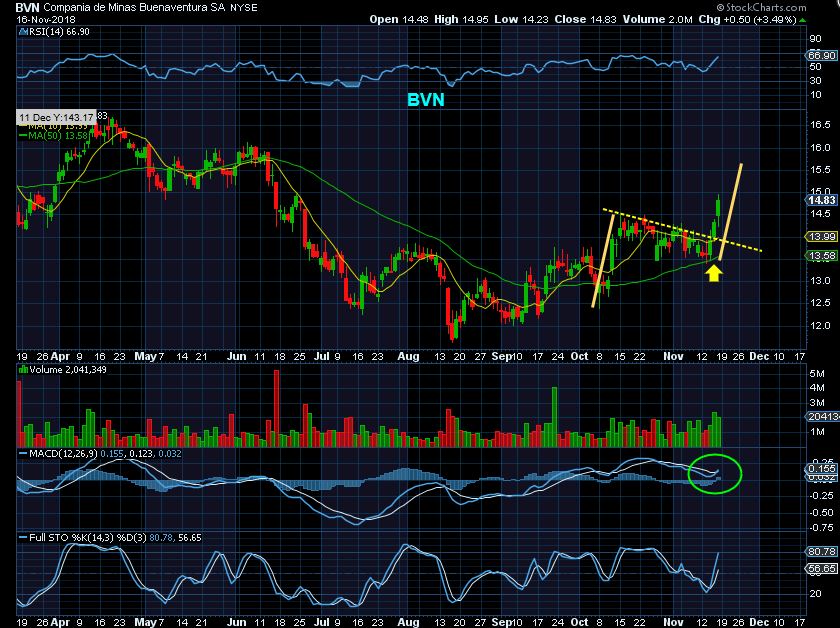
BVN – It’s good to see some of those set ups breaking out & following through. This was Fridays chart, Monday it ‘paused’ .
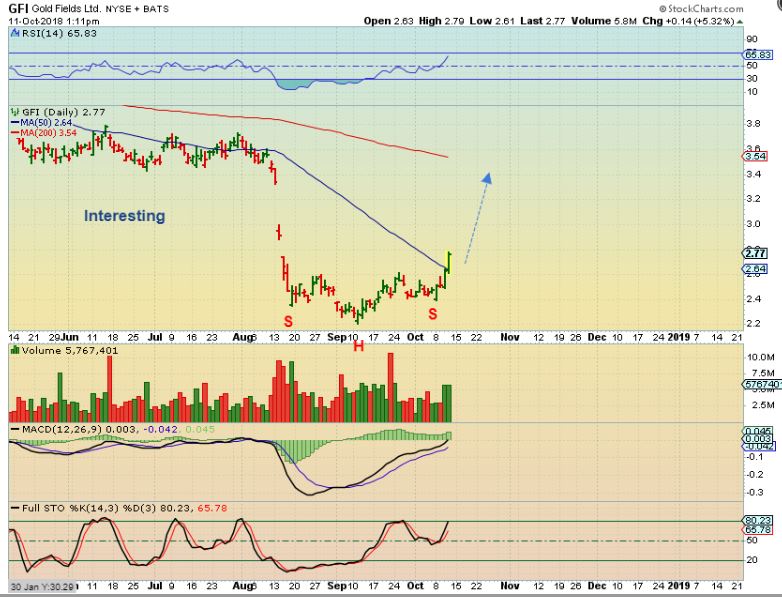
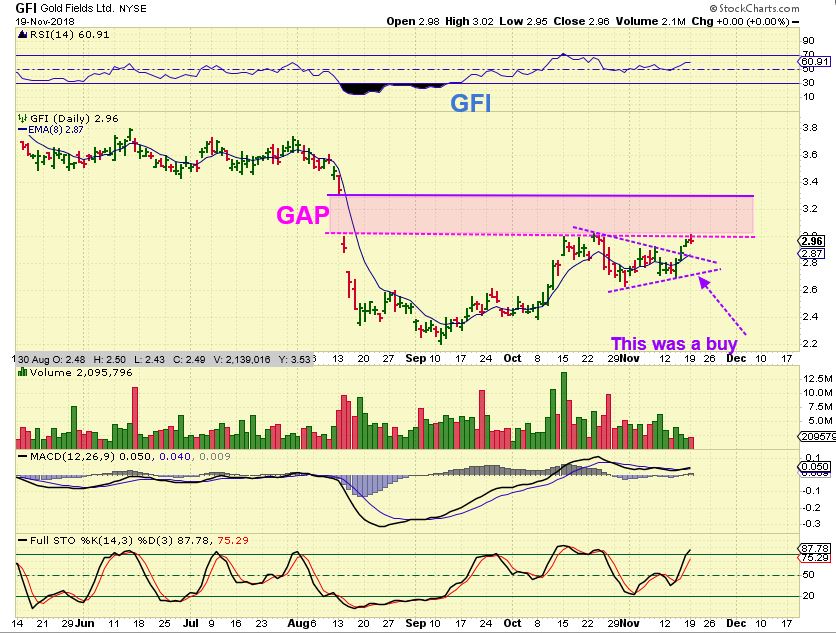
GFI OCT 11 – Confession: I did think that this would shoot straight up to the 200 sma. A Nice gain, now it is evident that it will get there over time.
GFI – It consolidated that ‘Pop & Run’ by going sideways . Now THIS was pointed out as a buy last week too in the triangle…
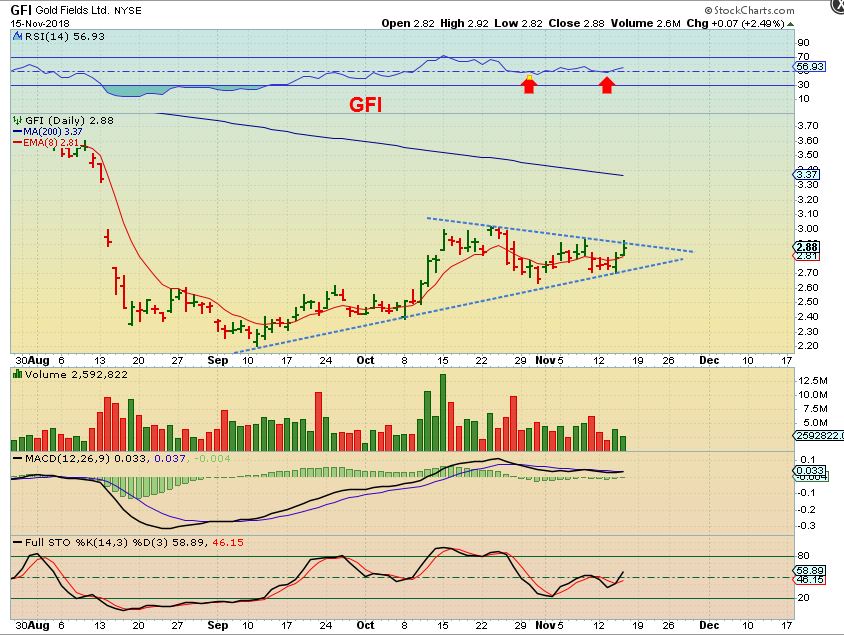
GFI – I still like it. It hasn’t ripped higher, but maybe if it can get into that overhead gap, it can run to the 200 sma. Since I am thinking that MAYBE we get a gap fill on GDX or GDXJ, I thought that I would point this out, since a gap fill on GDXJ could be a back test of this triangle too. A nice Buy with a stop.
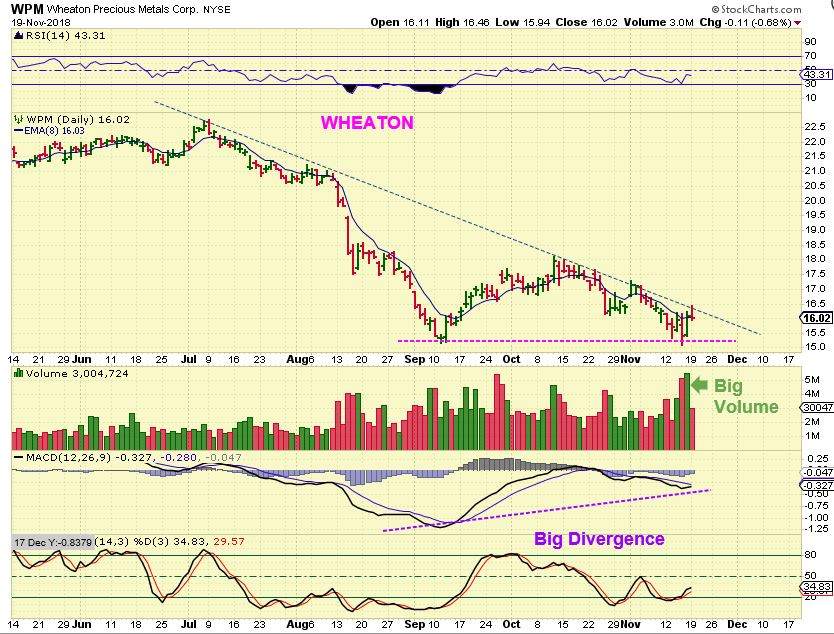
WPM – I love this double bottom set up, because the stop can be placed very close to your entry (Under recent lows). This looks ready to break out above a trend line, similar to BVN.
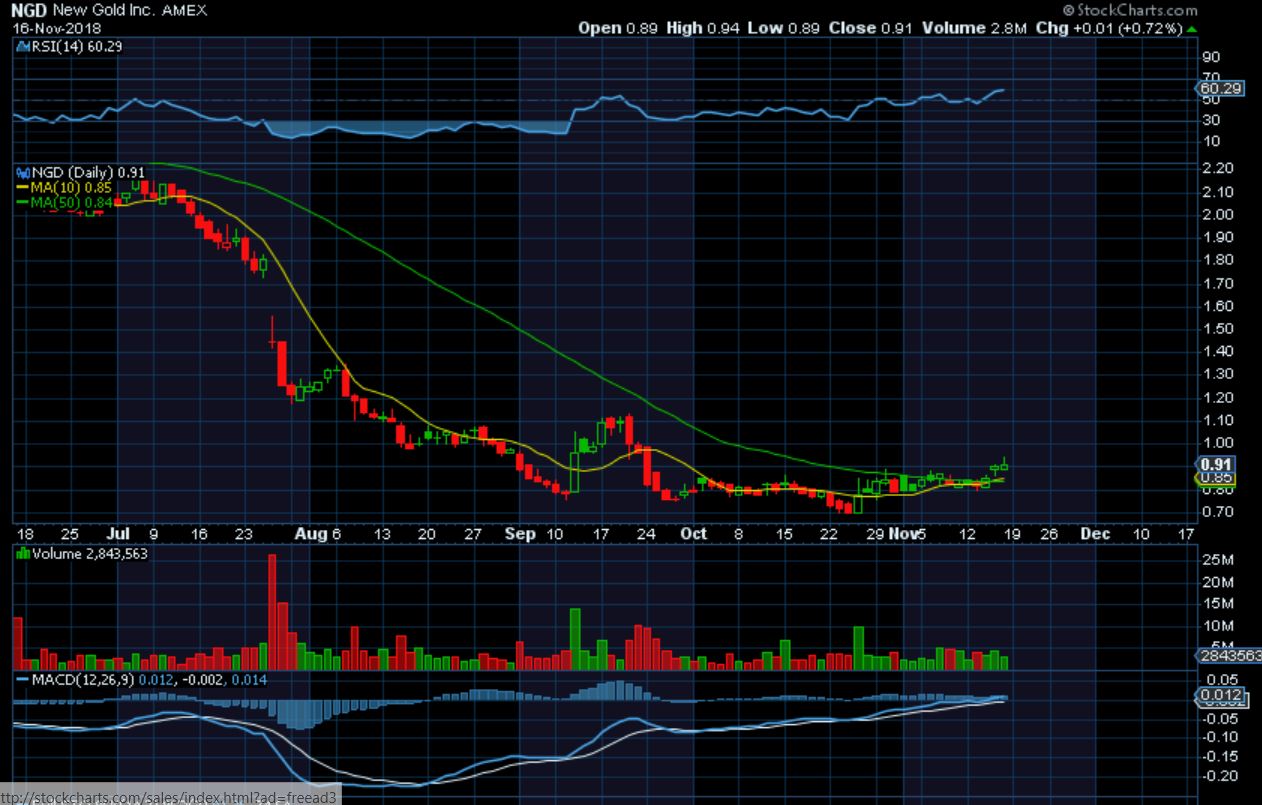
NGD – Honestly, I don’t personally usually trade NGD, but here NGD is breaking out above a 50 sma and trying to get above this base. If it fills the current gap ( GDX & GDXJ GAP FILL) and reverses on the 50sma, I may buy with a stop right under that 50 sma for a trade. It is on my watch list.