Half Day Friday
In the U.S. , the stock market is only open for a 1/2 day, so I wanted to discuss the Precious Metals…
.
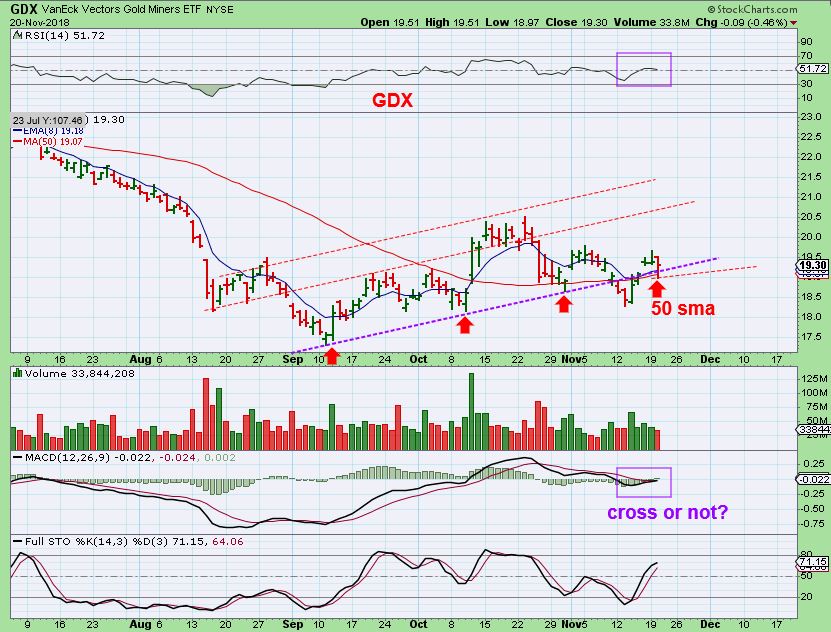
Some charts are a quick review from my last report, and we will also look at Wednesdays trading.
.
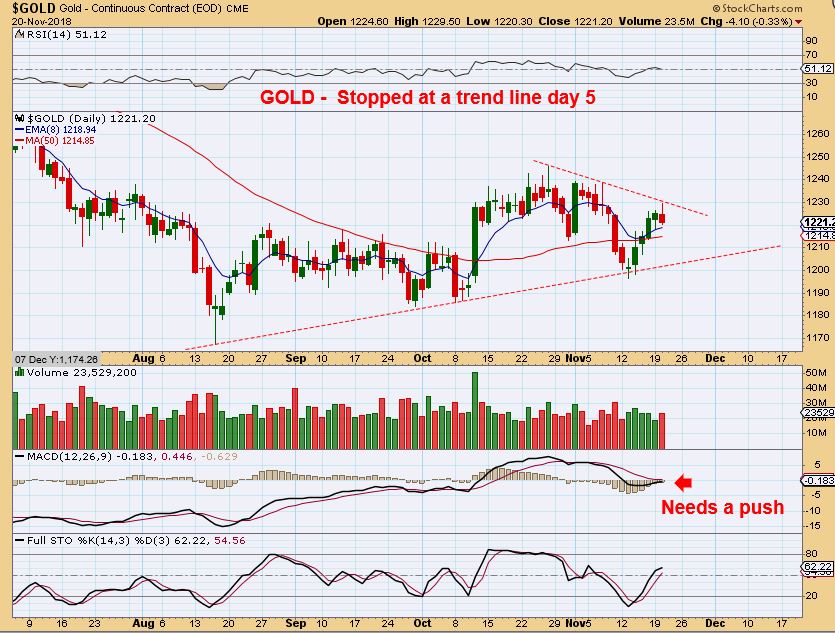
GOLD TUESDAY NOV 20 – Gold tagged an overhead trend line and was held back at this point on day 5. As a 3rd daily cycle, we need to see this break higher sooner than later, and there is a DANGER that it can top as Left Translated. Note: IT MAY NOT top as L.T., it could break out from this long base and peak on day 20+, but we do need to keep the thought in the back of our mind, & raise stops if necessary.
GOLD AS OF THE CLOSE WEDNESDAY – Gold was still at the trend line, but it is above the 50 sma. This is day 6. It is a Bullish set up if you can ignore the cycle count. I think that Gold could drop back to the 50sma, so I drew the Number $1215 to watch.
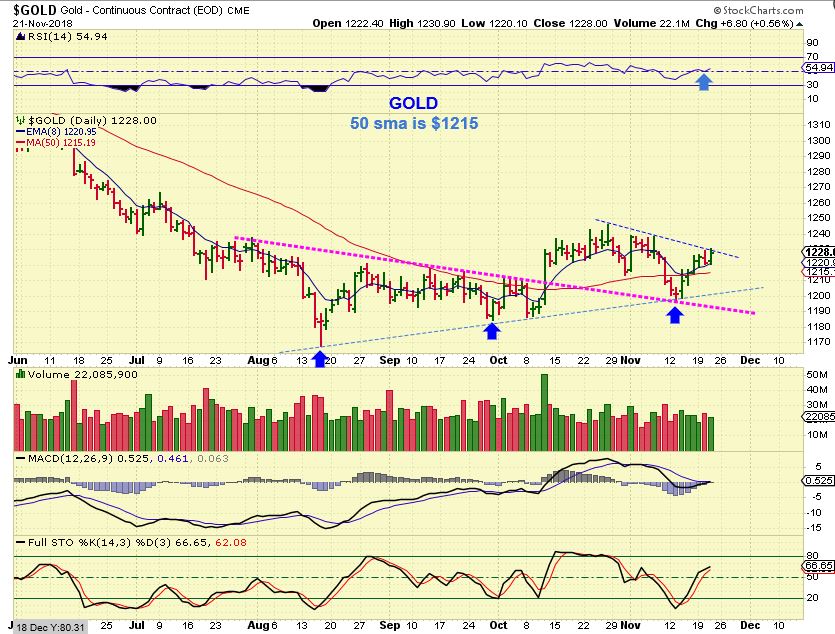
So GOLD can drop & remain bullish if it acts like this – but we also know that Gold could peak soon as a L.T. Daily Cycle in this 3rd daily cycle. You could place a stop for Gold under the 50 sma or below the dcl ( 3rd blue arrow).
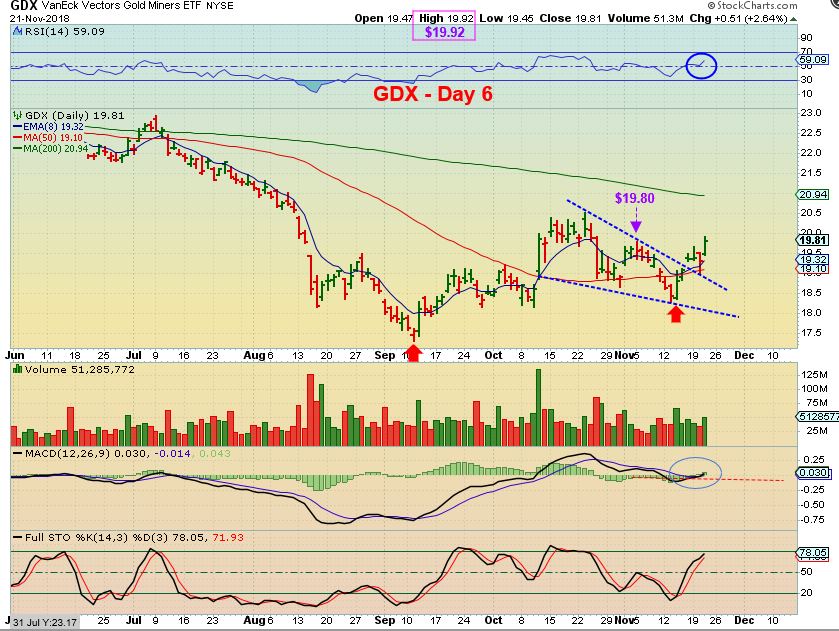
GDX NOV20 #1 – I showed that GDX dropped right to the 50 sma and a trend line & thankfully bounced nicely.
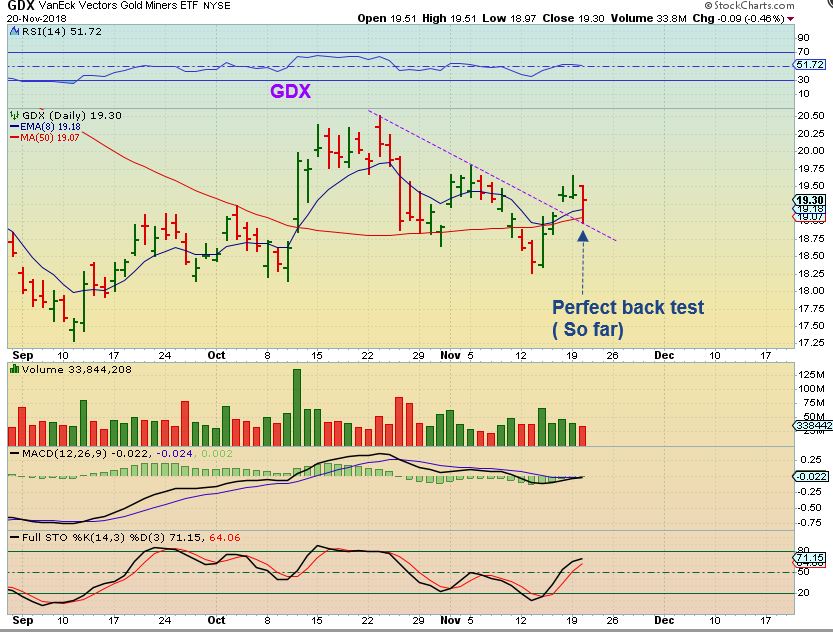
GDX NOV 20 #2 – Stepping back, it looks like the dcl 5 days ago was a ‘shake out’ and the tag of the 50 sma was bullish so far. This looks like it want to run to the upper line NEAR $21, and can be bought with a stop.
GDX #3 –AND WEDNESDAY The sector continued higher. For what should have been a light volume holiday trade, this volume was big. Wednesdays peak beat the Nov 6th peak, and this looks like it wants to run to the 200 sma ALSO NEAR $21. THIS IS DAY 6.
.
So next I want to look at some charts of Miners, Just using Technical Analysis, and see if they look healthy (Hint: Yes many do). 🙂
.
BTG – I pointed this out as breaking out 1 hr into Wednesdays trading, and BTG has now broken out above a long term blue down trend & back tested it…
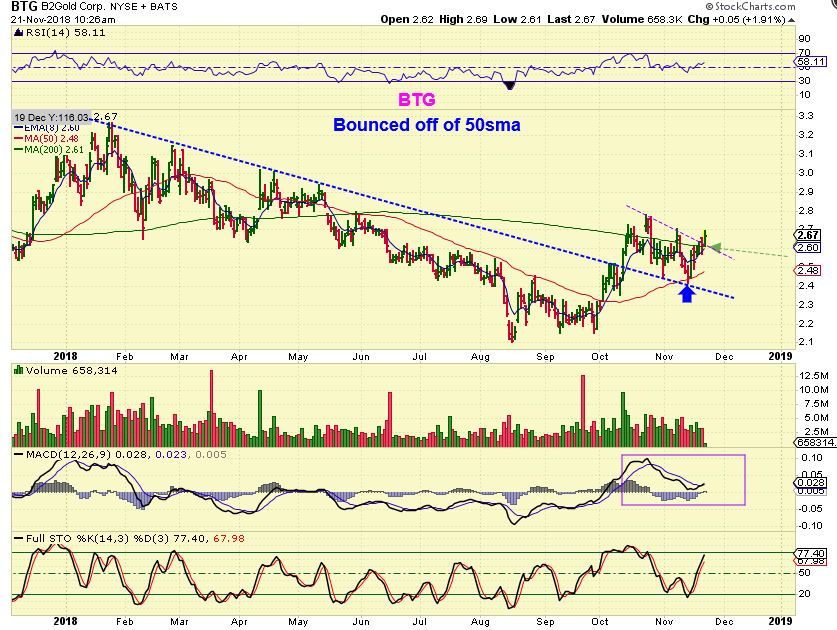
BTG AT THE CLOSE – It looks rather bullish, and a stop could be raised to the 200 sma. The 50sma is curling up toward the 200 sma. Notice how price is acting around the moving averages.
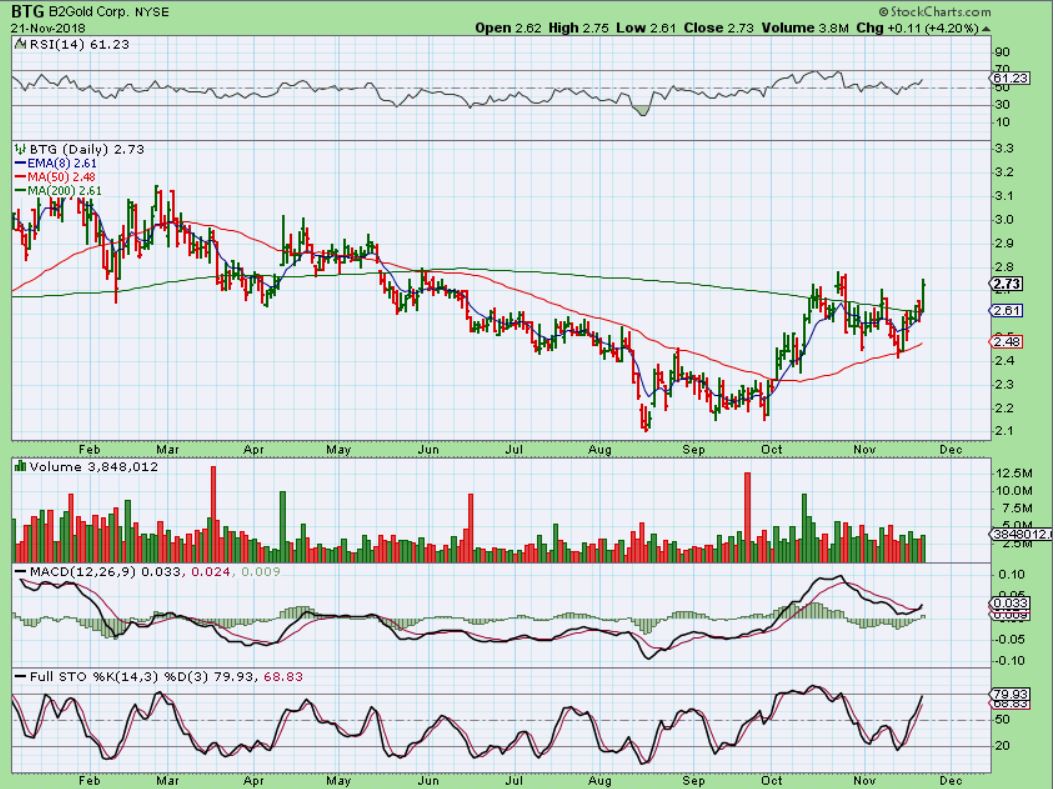
BTG IS ACTING BULLISHLY …
1. It was held below the 50sma
2. Then it Broke the 50sma, and ran to the 200sma
3. Now it back tested the 50sma
4. Breaks out above the 200 sma & the 50 sma is now curled up
5. This is what you want to see
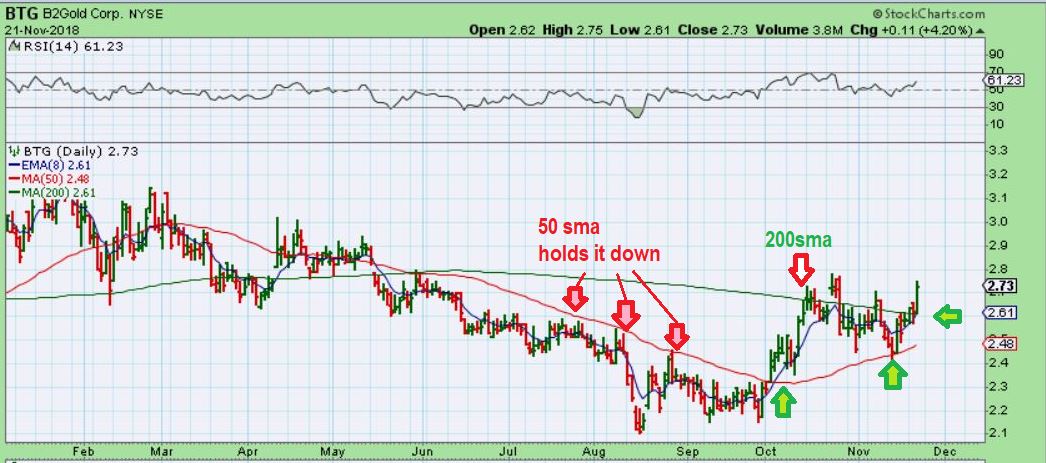
FNV – the 50sma is curled upward and Price broke through the 200sma Wednesday. Volume is good .
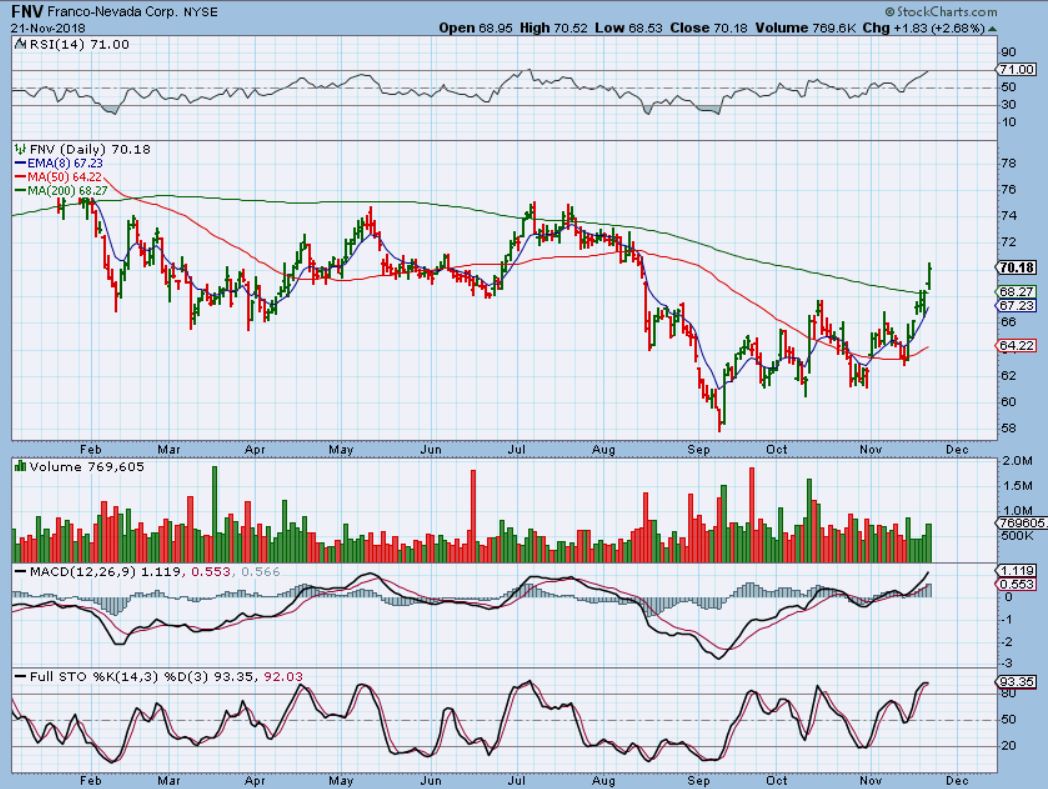
KGC – I like the volume on KGC and it looks like a shake out. Can it get above the 50sma?
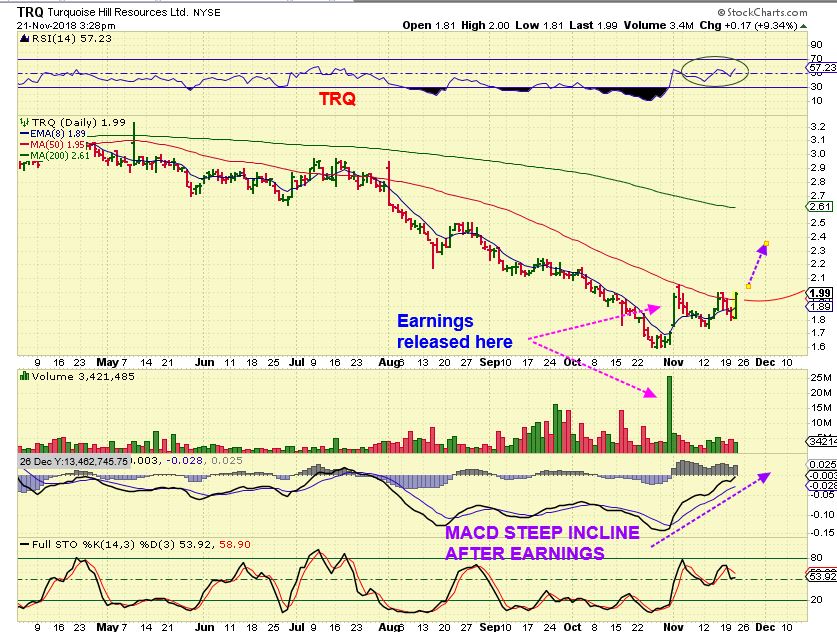
TRQ – I bought TRQ Wednesday as it pushed on the 50 sma, after pushing on it twice in November. That November POP was from a positive earnings report.
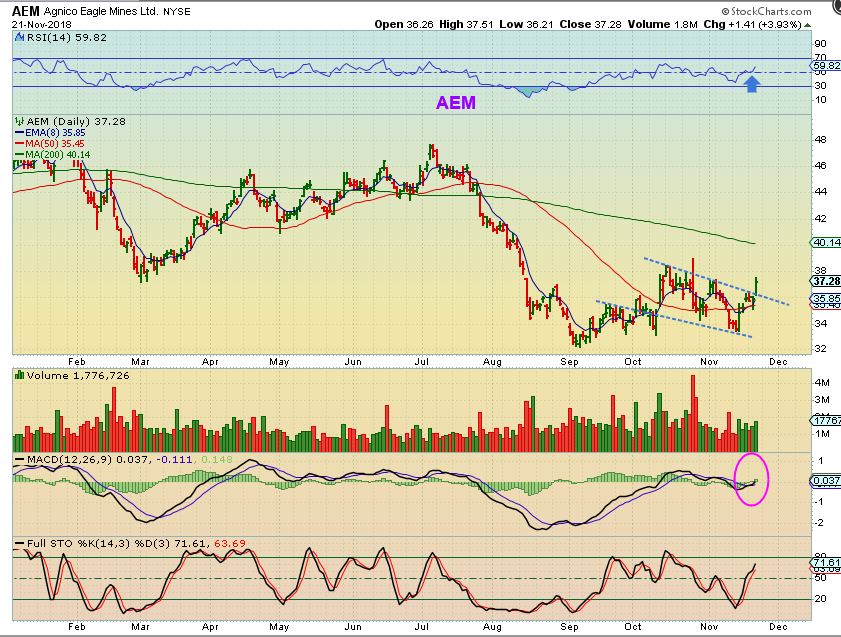
AEM – Another Break out on what should have been a weak pre-holiday trading day. This will probably run to the 200 sma & then may pause.
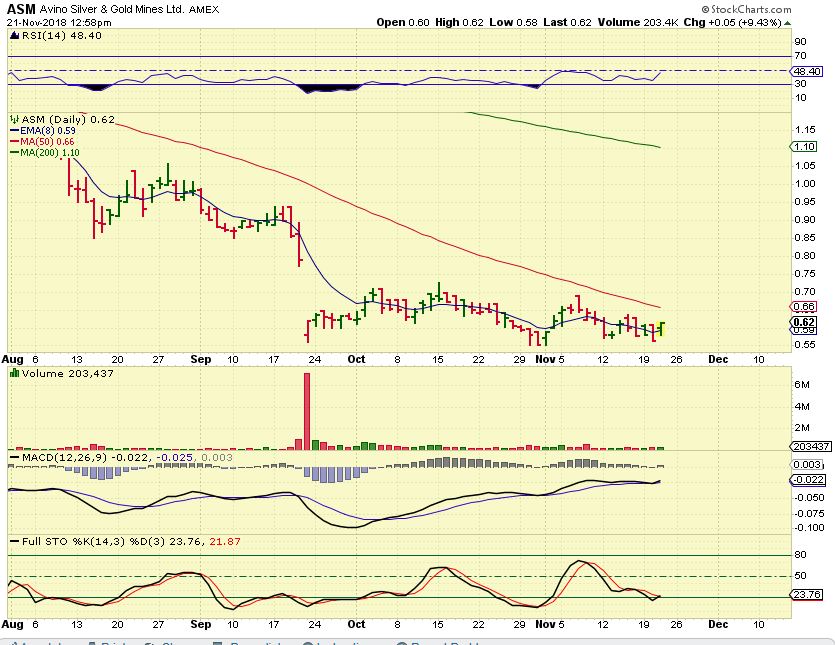
ASM – This is a base with a rising MACD. That gap down drop was a public offering, so that is out of the way, and earnings were released Nov 7th. I’d put this on a watch list for a break above the 50 sma.
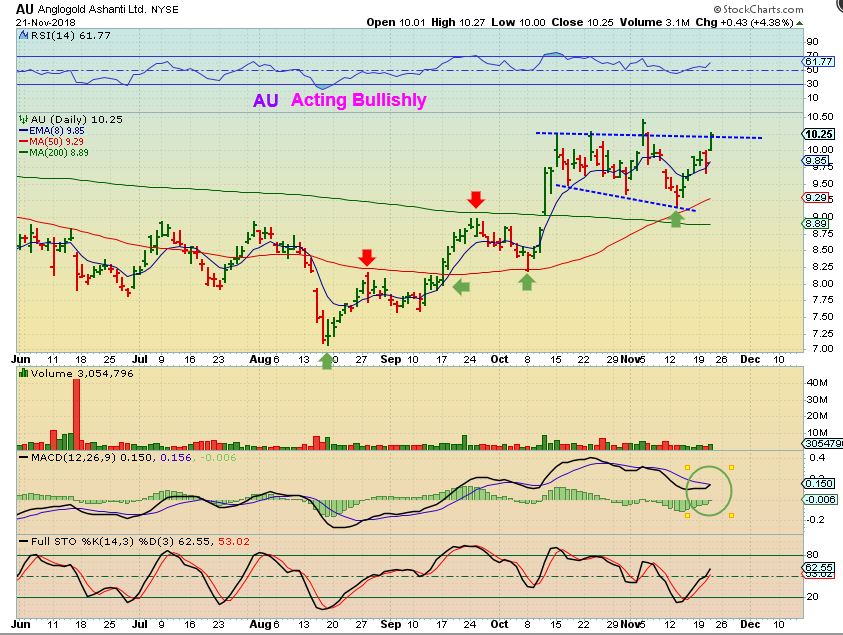
AU – Look at the AU Price around the moving averages. These are acting correctly and AU is up over 40% off of the lows.
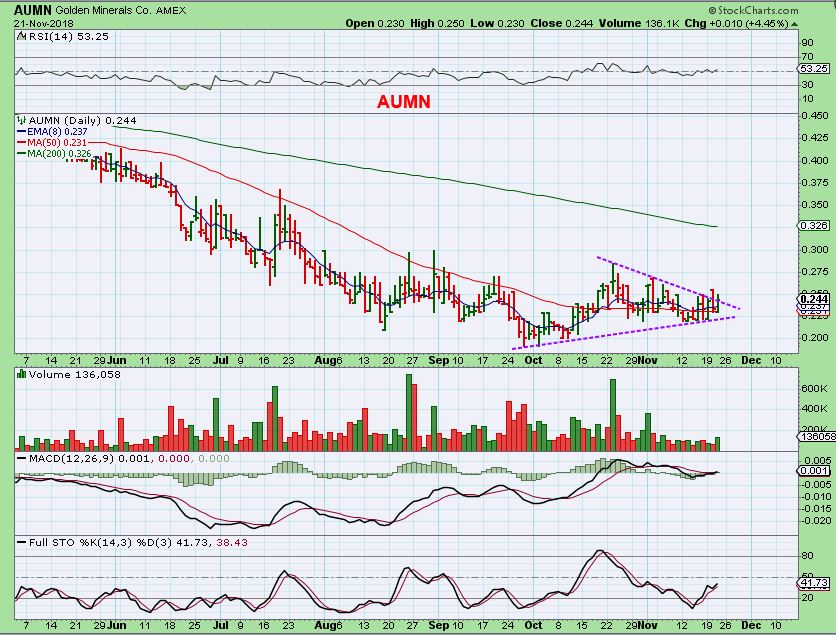
AUMN – Another junior in a Base and still oversold, it is dancing above the 50 sma
I could show more charts , but basically I am just pointing out that many Miners are acting correctly. Let’s discuss the Pros and Cons. 1. These markets have been choppy in every sector, and those making gains and holding on with tight stops have given most of the gains back. It is frustrating. 2. The markets have been choppy and difficult, but over time, 3. some of these miners are shaping up rather than breaking down further. 4. Even very Good looking set ups in others sectors have broken down 5. In the back of my mind, I am of course aware of the Cycle timing and that Gold can top Left Translated in a 3rd daily cycle, but when I am just looking at many of the charts of Miners, I am seeing normal stair-step higher action. 6. These charts do look like normal bases forming, and normal price action bouncing off of and above moving averages. 7. That means that these look to be under accumulation. Normally with this many Pros & Cons, it means that you have a choppy market with Mixed signals. We do have that here. In that situation, you either SELL THE POPS to lock in gains and possibly miss a stronger move, or you just take your position and set a stop, but you risk giving the gains back unless you raise that stop. You can also sell ‘some’ of your position to lock in gains, and let the rest ride. Let’s continue…
.
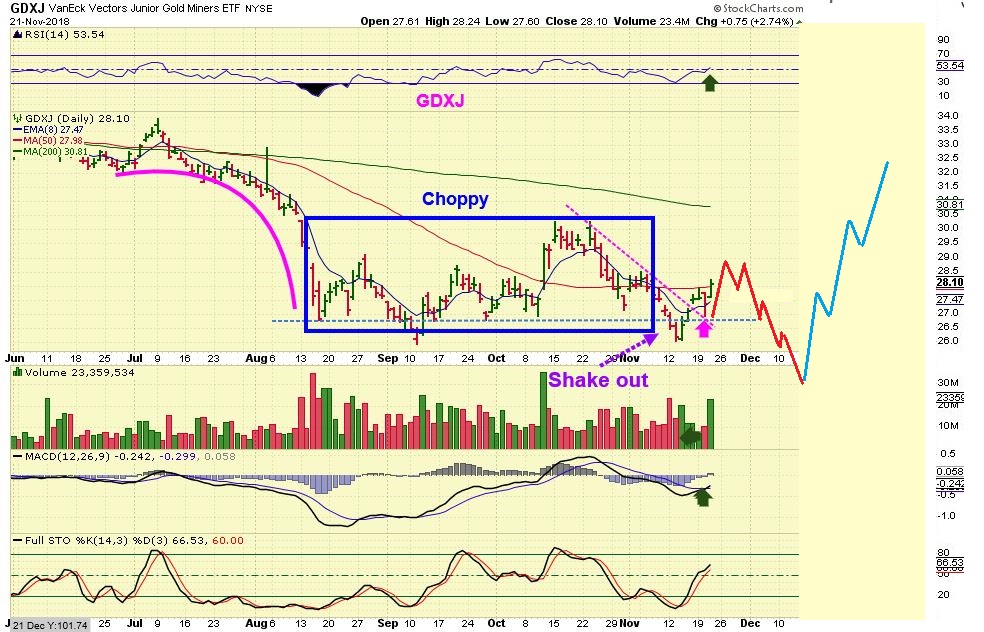
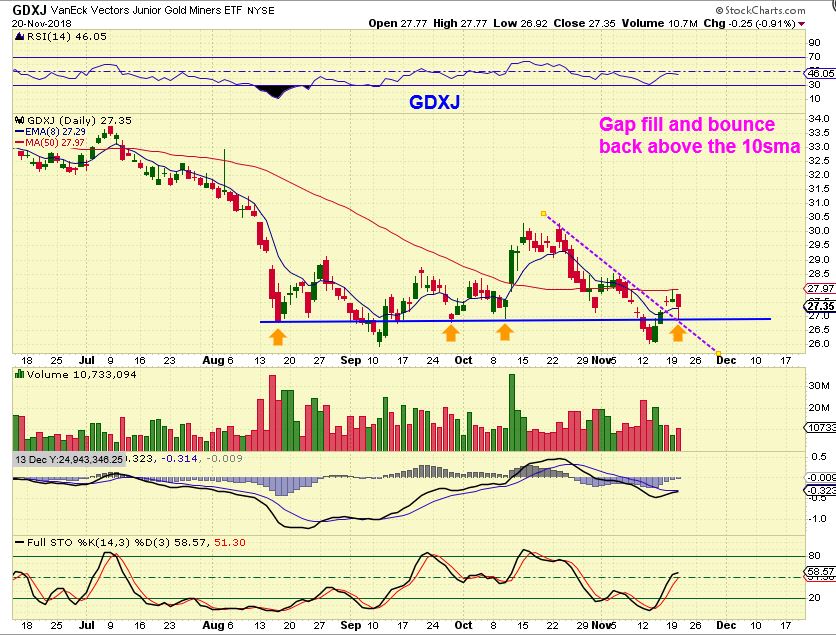
I go back to GDXJ and this is from my prior report Tuesday Night. We see here a Gap fill & trend line back test with a reversal at support. That alone is a buy in technical analysis with a tight stop…
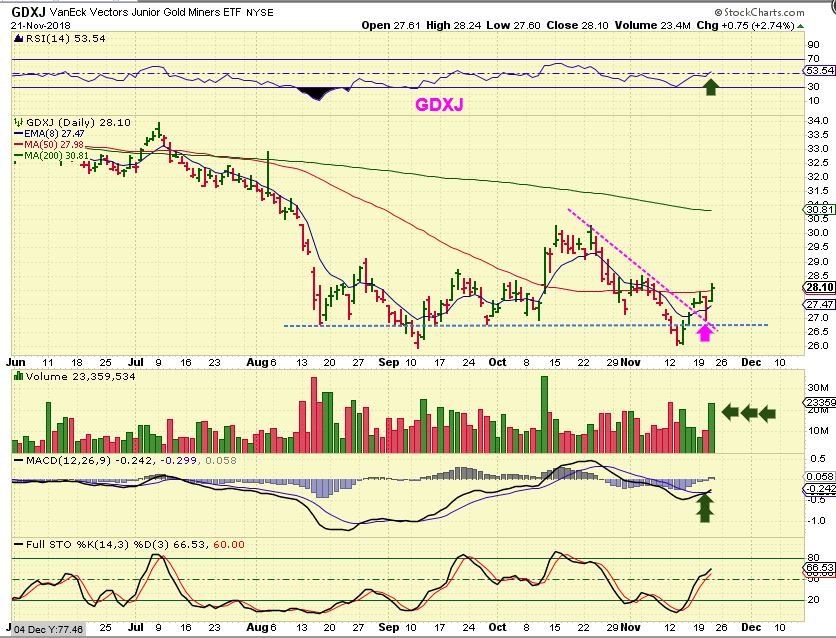
Wednesdays Push above the 50 sma had Big Volume. If I just saw this chart without any cycle count, I would have bought it Tuesday with a stop under the blue line. This looks like it wants to run to the 200 sma next. ( I actually bought the shake out reversal last week), and now I want to finish with these final thoughts …
I showed this a week ago too, this is a reminder. Do you remember this complex base that formed right before the 2016 launch? It was 1. a choppy complex base that broke down to a shake out. 2. Then it re-gained the 50 sma, then the 200 sma, and then launched higher, and left most behind.
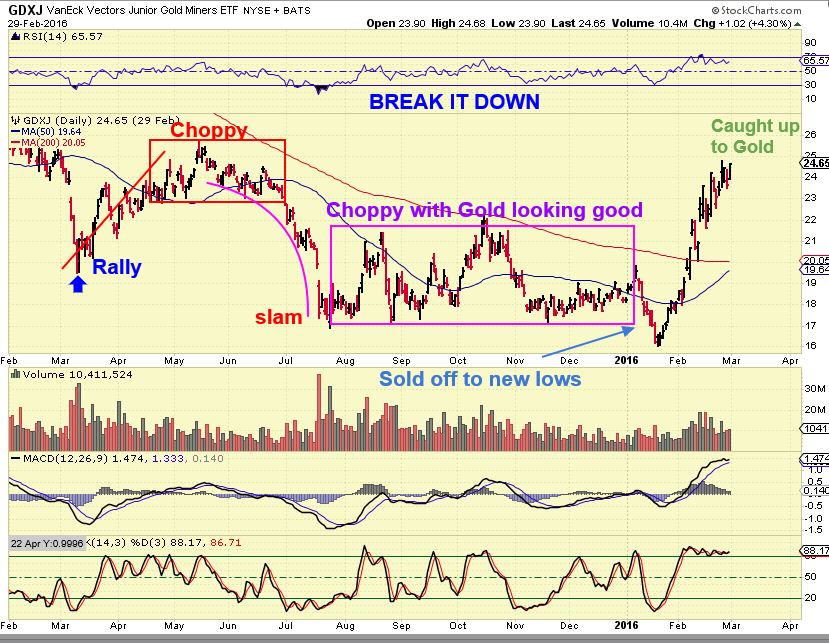
Currently we have: 1. A choppy complex base that broke down to a shake out. 2. Then it gained the 50 sma. 3. Will it run to the 200 sma? 4. Could this leave many behind? Scroll up to the 2015 chart above again & scroll back to this one & compare the two.
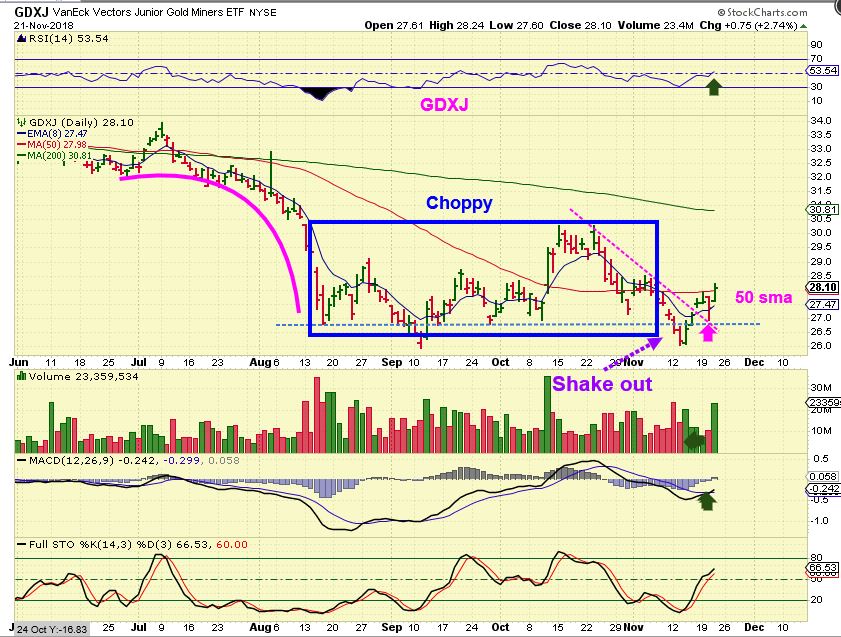
They are not exactly the same, but they are very similar in the way the base has formed. The recent shake out recovered, and now it has regaining the 50 sma. If this ran to the 200 sma & then higher, many would be left behind. That said, JUST REMEMBER TO USE STOPS, because if this doesn’t run to the 200 sma, this complex base may just take a little more time. I am currently invested long in this set up, and I do have a stop.
.
Enjoy your trading on this Friday ( 1/2 day in the U.S.) .
.
~ALEX
.
THE REASONs FOR STOPS:
.
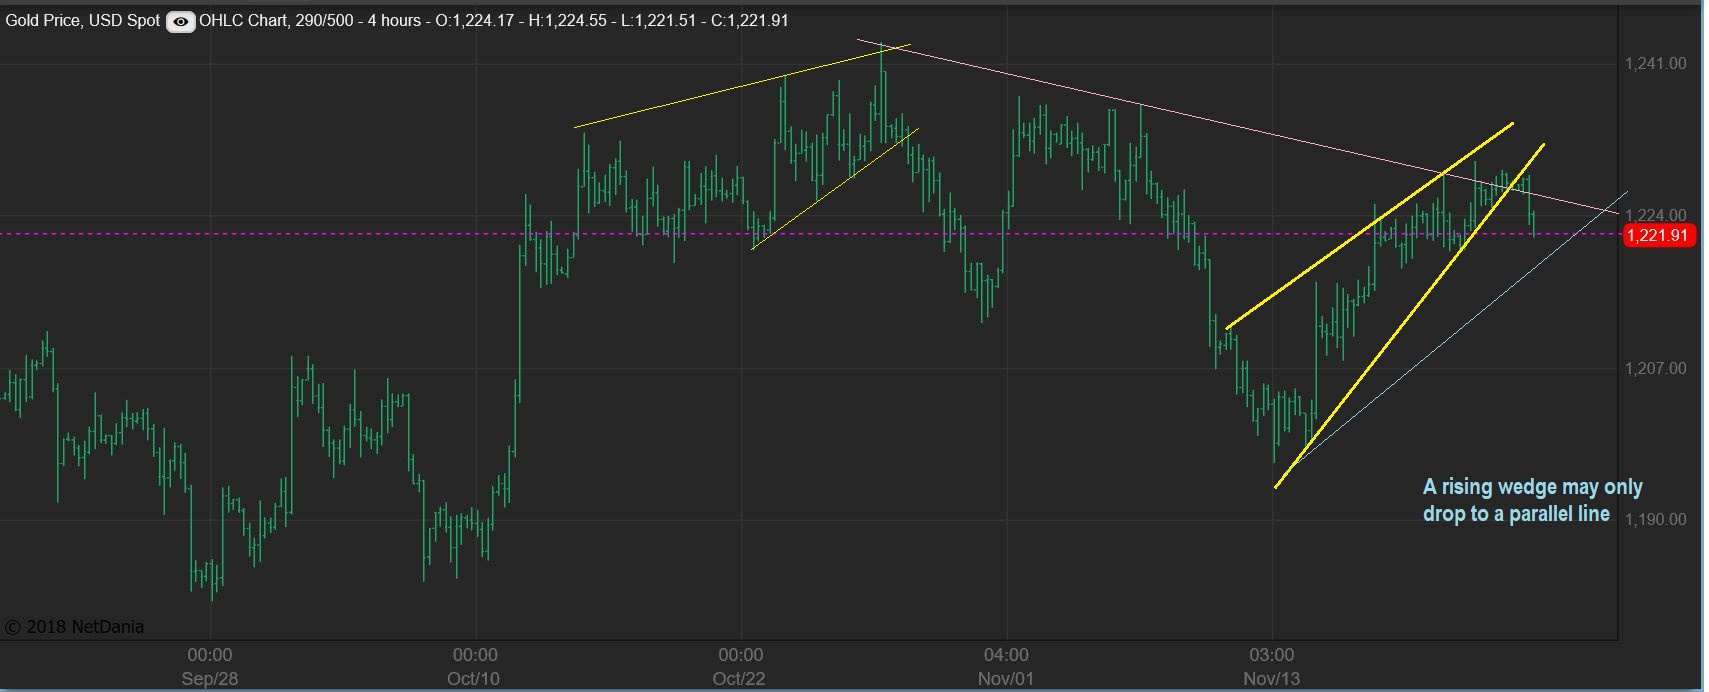
1. You may recall that I said this looked like a rising wedge at that trend line in Gold. (It may simply drop 28 – 50% though, a drop on the daily to the 50sma)
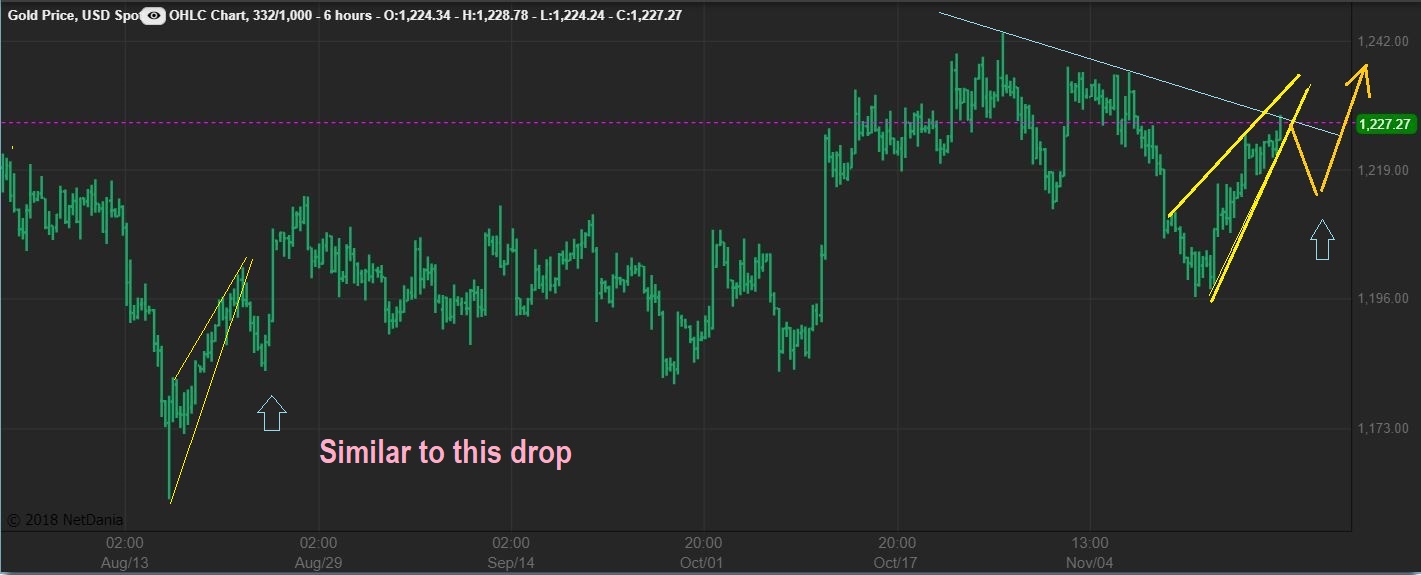
2, This is ‘GOLD live’ this morning and the break down began overnight. I don’t want to panic people, since Gold can just drop to form a channel, but it should be noted that this now shows lower highs and lower lows over the past few days ( This is a 4 hr chart)
ALSO :
.
That 2015 Complex base, ‘shake out & Launch’ set up that I have been watching…
We use stops JUST IN CASE THE Current Complex base, shake out & Launch needs more time and does a bigger shake out into the next ICL. Scroll up & down.