Weekend Rejoice! Oh, I Guess I Mean Weekend Review
We are all well aware of what happened in the markets this week, and really it is what we have been waiting for and discussing in the Big Picture Views for a while. That said, we now have a lot to look at in this Big Picture Review. Read each chart carefully…. To the charts!
.
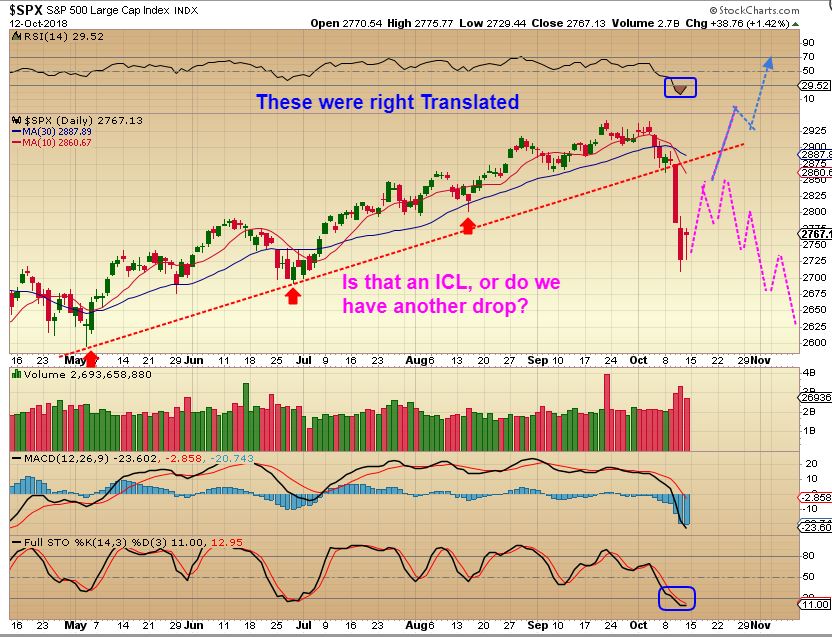
SPX WEEKLY – I’ve been looking for a drop into an ICL , similar to January. There it is, read the chart, and there is more..
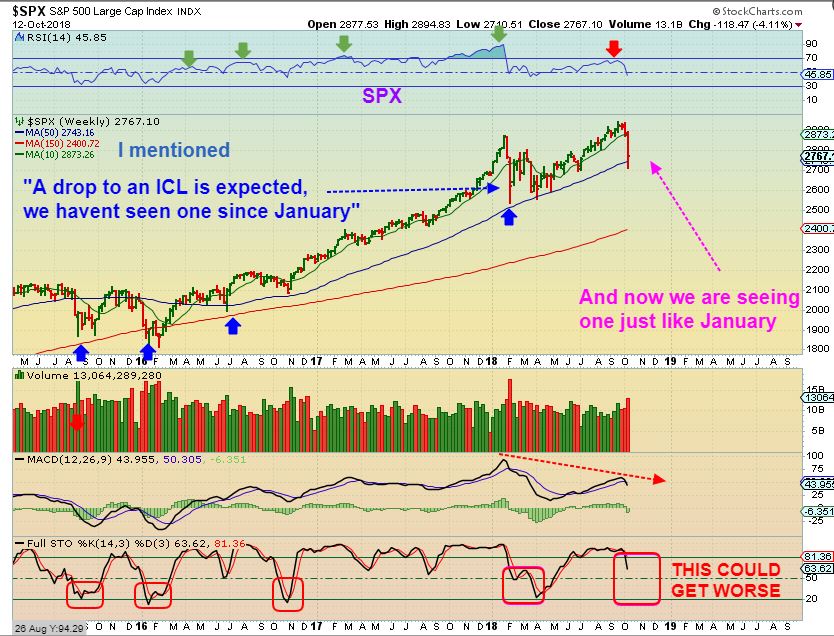
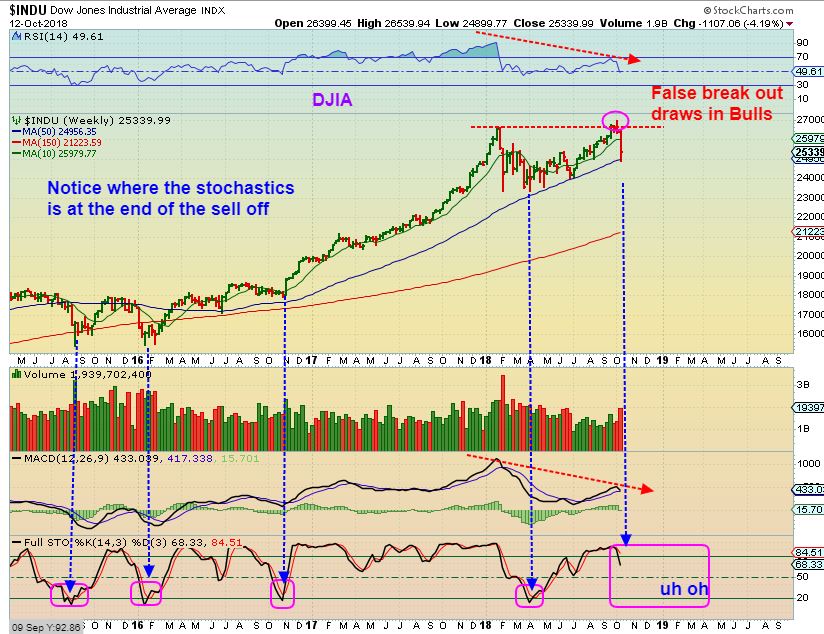
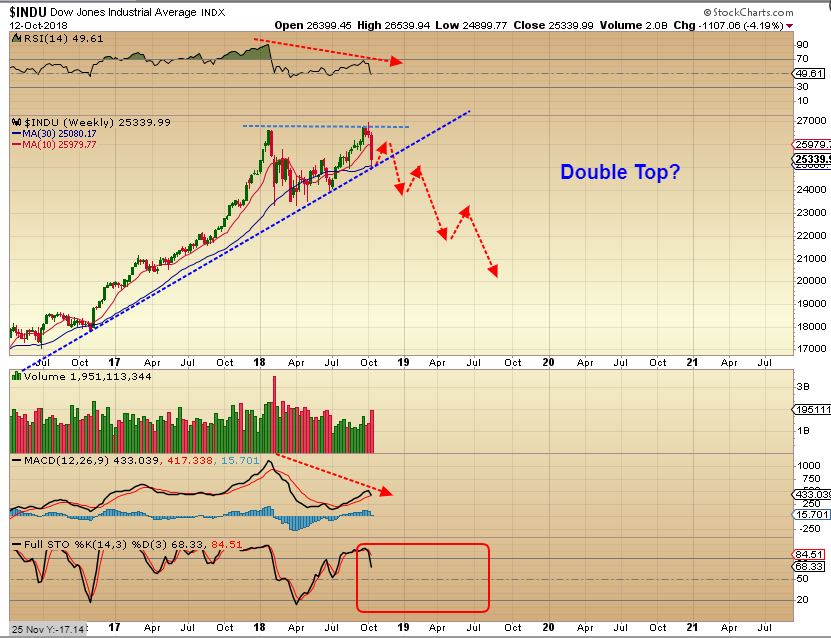
DJIA WEEKLY – Look at the stochastics on that SPX & this DJIA chart. Each prior ICL bottomed with the Stochastic bottomed too. These are still Overbought on a weekly basis! We may bounce off of support, and roll over again. These markets need watching!
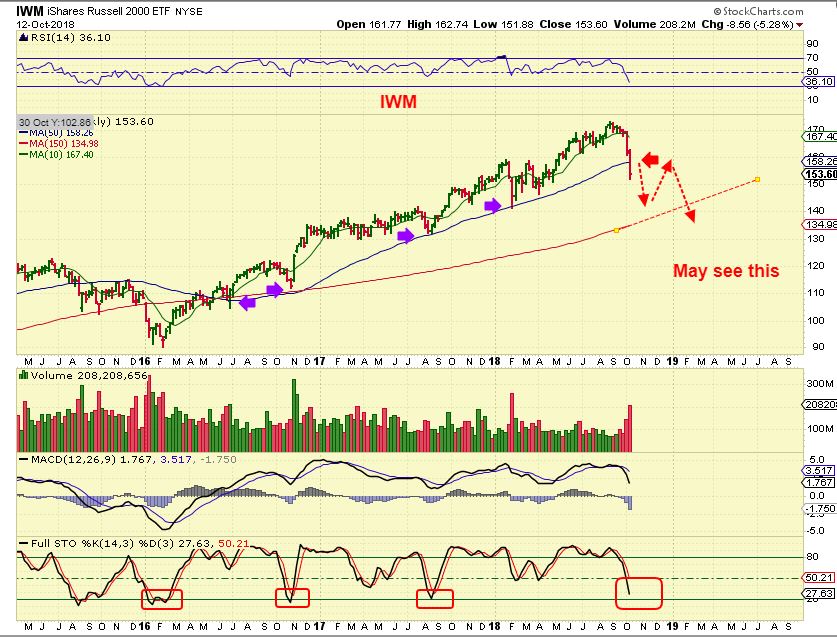
IWM WEEKLY #1 – Notice that the IWM WEEKLY broke below the 50 weekly MA. It did not do that at the JAN ICL or the 2017 ICL. The uptrend line is broken.
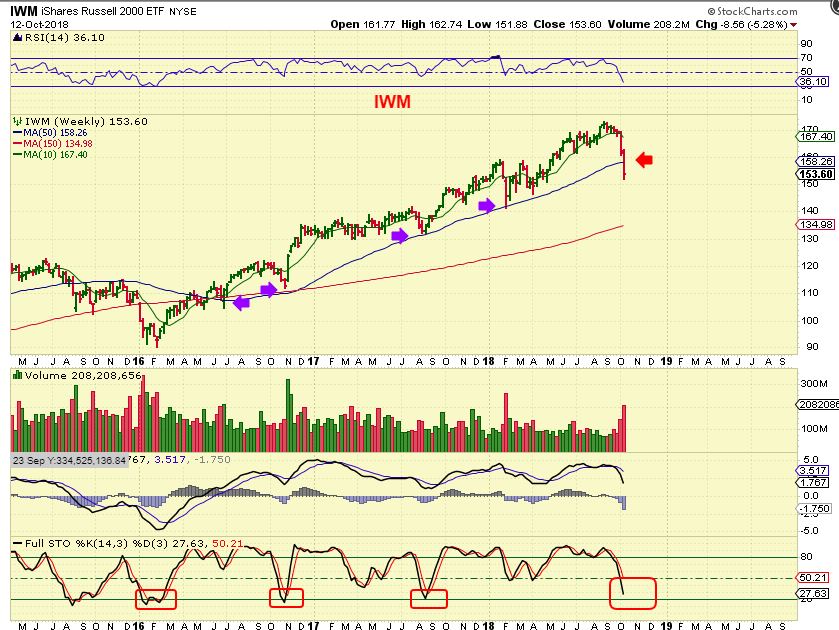
IWM WEEKLY #2– So again, maybe we bounce & get everyone is thinking “BUY THE DIP”, and then it rolls over further.
SPX DAILY – We need to monitor the markets going forward. The weekly charts remain very overbought for DJIA, SPX, NASDAQ. We’ll either recover or back test and drop again.
DJIA DOUBLE TOP FORMING? – We can’t tell yet, but look at that divergence and we are still overbought? Rising interest rates and other changes may begin hindering the growth we’ve seen with super low interest rates. Time will tell.
SUMMARY: Are the markets topping & Gold will now trend higher for months? We shall see. These were healthy looking right translated daily cycles, yet this drop was deep. An ICL is due, we anticipated this, but it does look like it may not be finished in the big Picture. We may now bounce, back test the break down, & get a L.T. Daily and keep falling. We’ll take it 1 step at a time, I need to analyze the bounce, but right now this should remain cautionary for me. You can buy a proper swing low if you want to, but use a tight stop & trail it. The better trade may be Miners now.
.
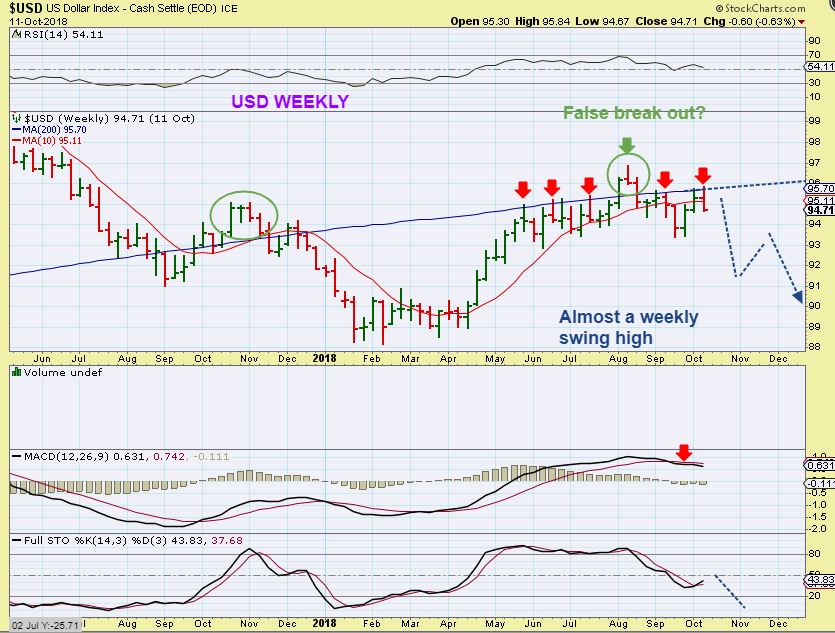
USD WEEKLY – A reversal at the 200week MA. This could form a weekly swing high next week, and the downside could continue (Good for Gold usually).
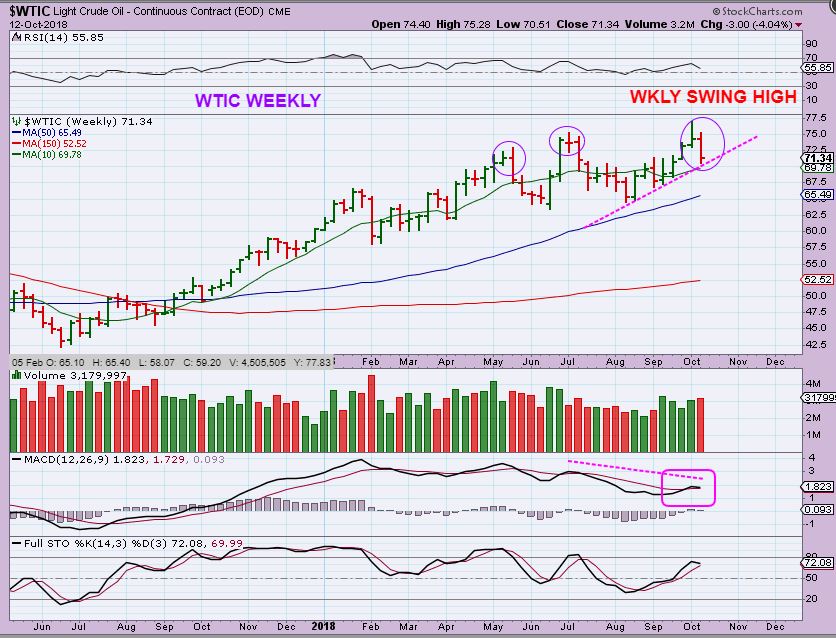
WTIC WEEKLY – Swing High. Oil could sell off further too. The daily chart is nearing time for a dcl, look for a swing low to form, but Oil is also still due for more of a drop into an ICL. If Oil gets cheaper, that could be good for Miners too.
.
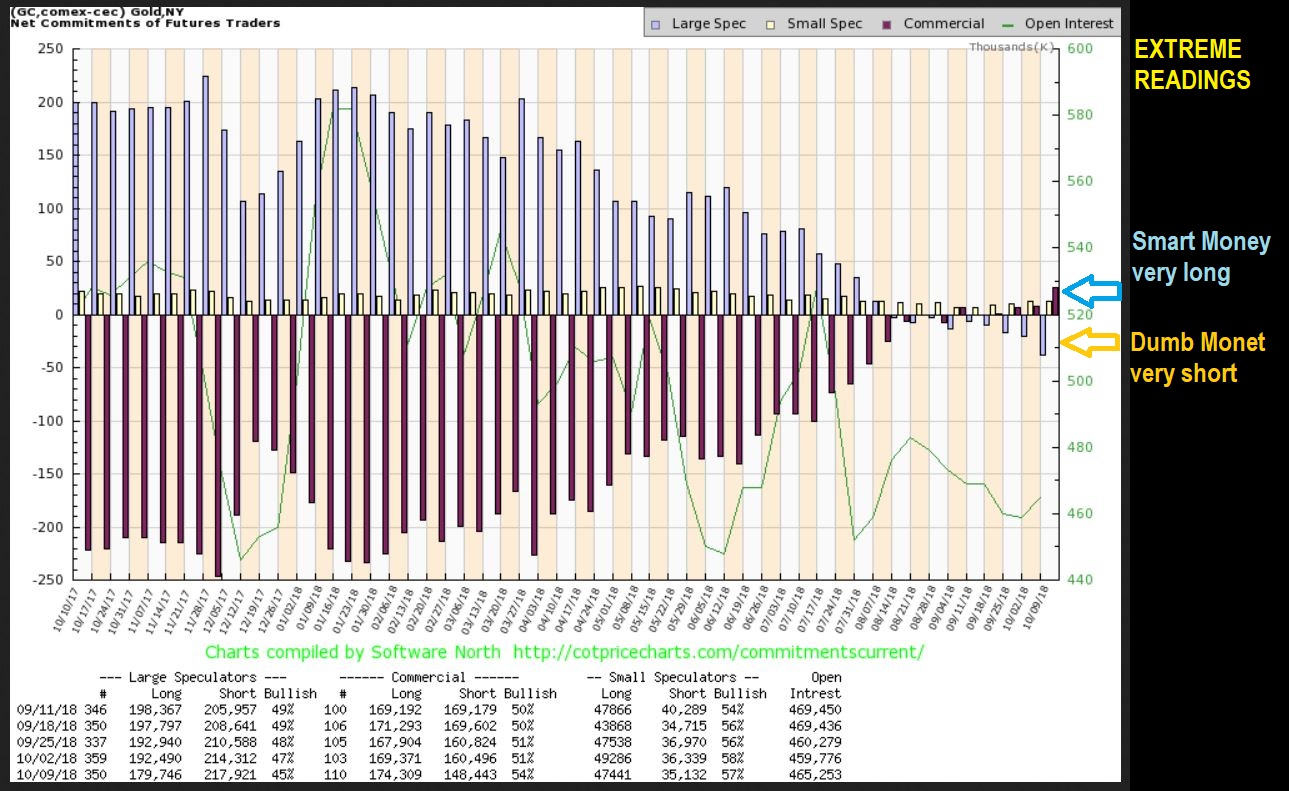
GOLD COT – Wow! As of Tuesday last week ( before Golds big pop) , the readings were extremely Bullish for Gold. In fact, I believe that I have never seen readings at this extreme before, in over 20 yrs of trading the Gold Market. The LONG BARS along the left are what you see at Tops.
.
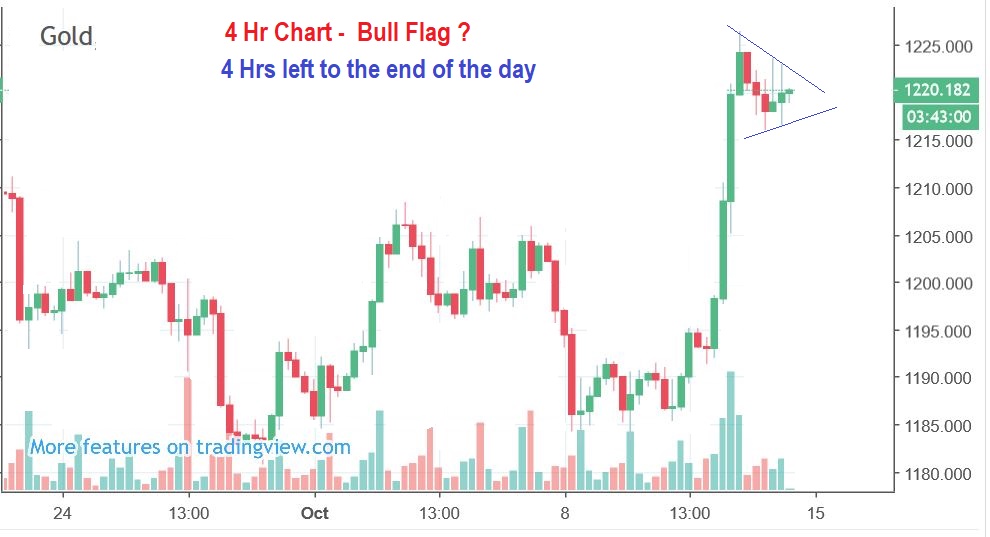
GOLD 4 hr chart – I posted this to show how GOLD looked Friday toward the end of the day ( last 4 hrs). It looks like a bull flag consolidating Thursdays gains so far. We’ll see if we get another move higher from here or a back test of the break out.
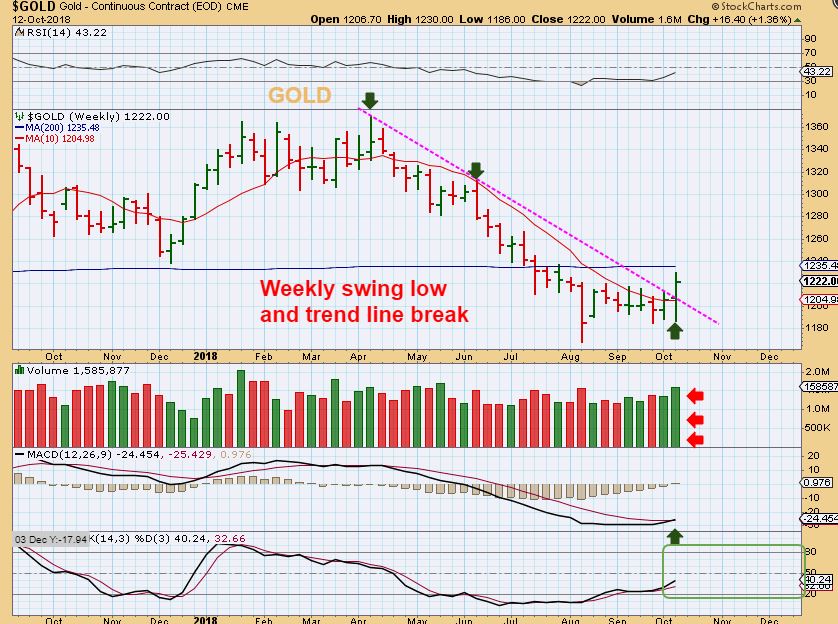
GOLD WEEKLY – We have GOLD finally Popping above the down trend line and we have a weekly swing low confirmed. Notice the ICL in December had 6 out of 7 weeks Green. I expect Gold to move higher from this base. The stochastics is oversold.
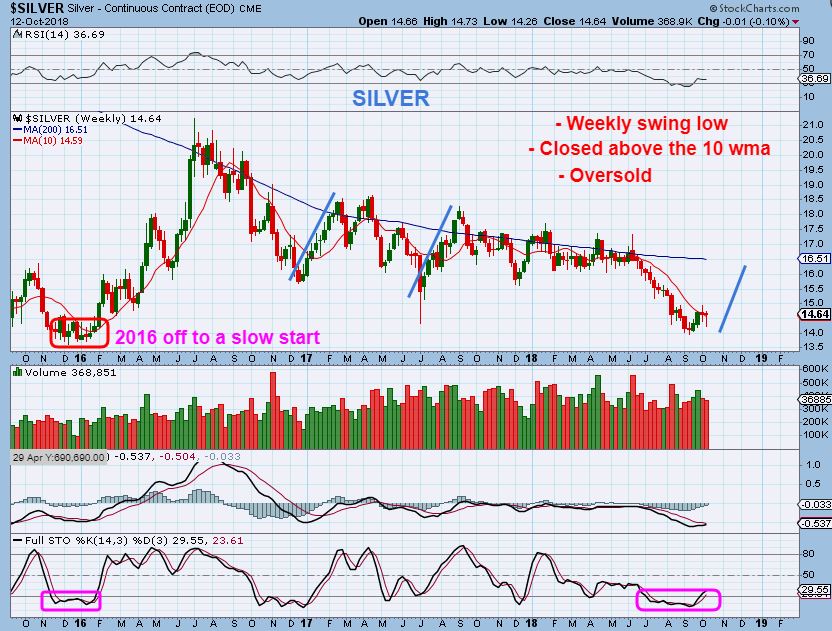
SILVER WEEKLY – Read the chart, weekly swing low in place, down trend broken. Oversold on a weekly basis.
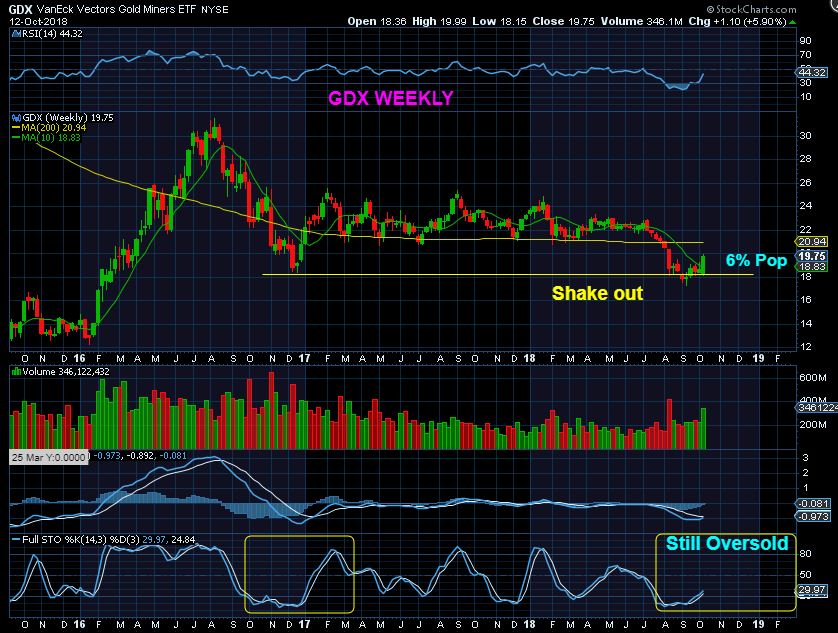
GDX WEEKLY – This looks like a weekly shake out and we had a nice 6% Pop this week. This is something that I have been looking for. GDX is still oversold on a weekly basis.
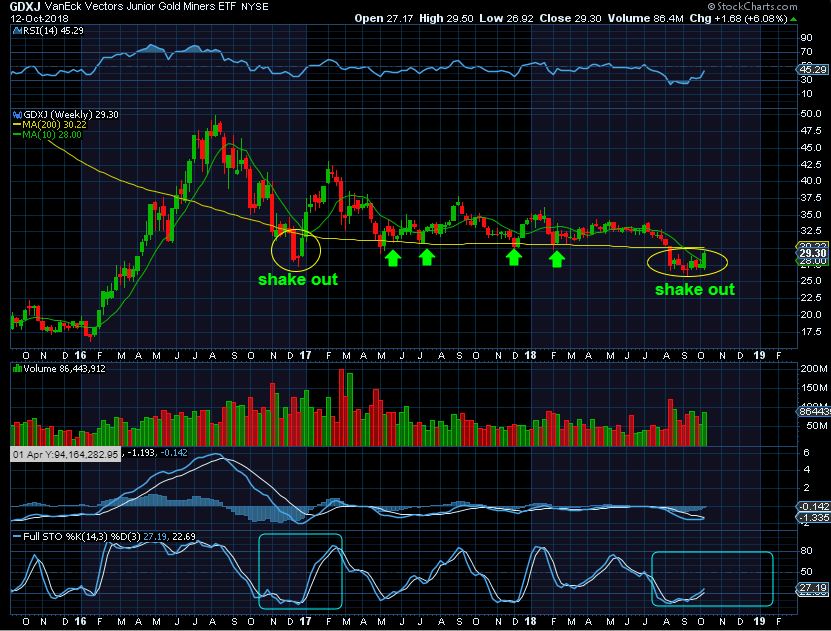
GDXJ WEEKLY – This long tight consolidation and a shake out can lead to a large upside run. It is still oversold on a weekly basis too.
.
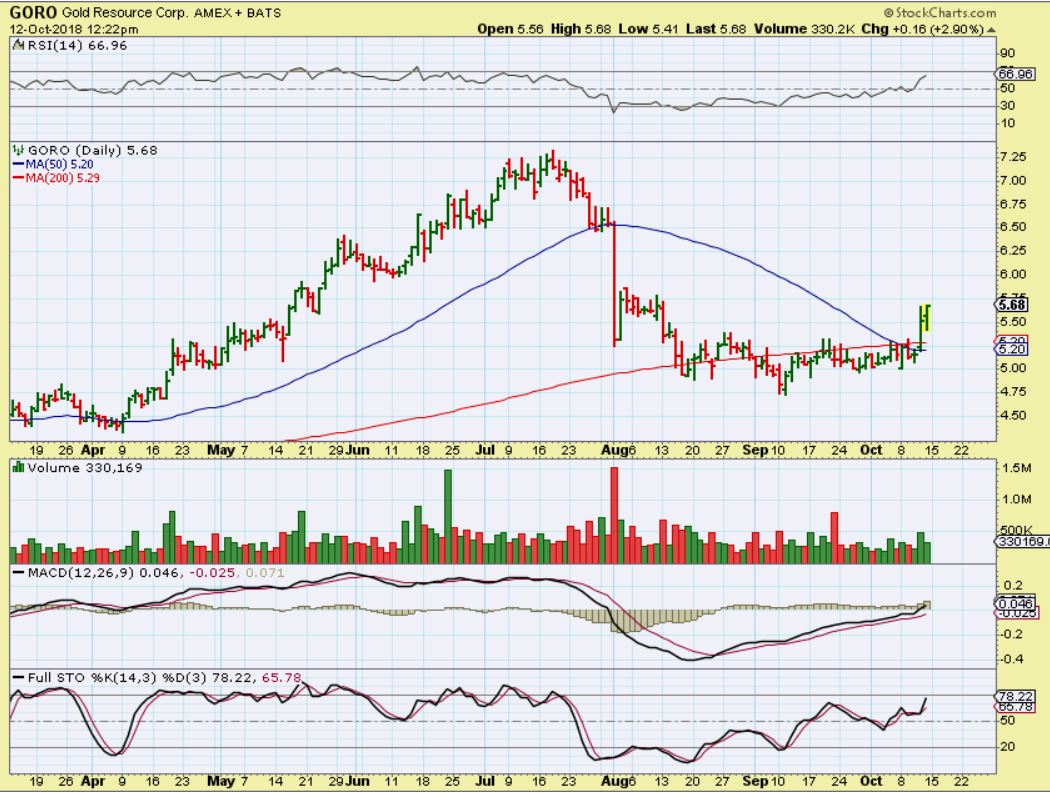
GORO DAILY – I bought GORO this week because it has the 50 & 200sma pinched together, the 200sma is slanted upward, and the last run was very good.
.
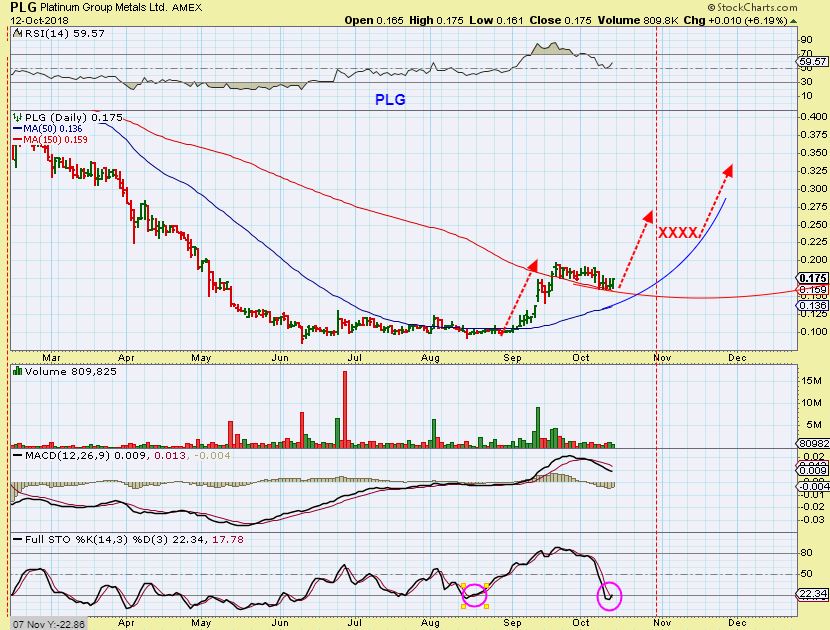
PLG DAILY – PLG has been consolidating gains, running right down the 200sma. Will it tag the 50sma now or later? I dont know but so far this remains a long term BUY & Hold for me. I posted here a few times as a buy near 10 cents.
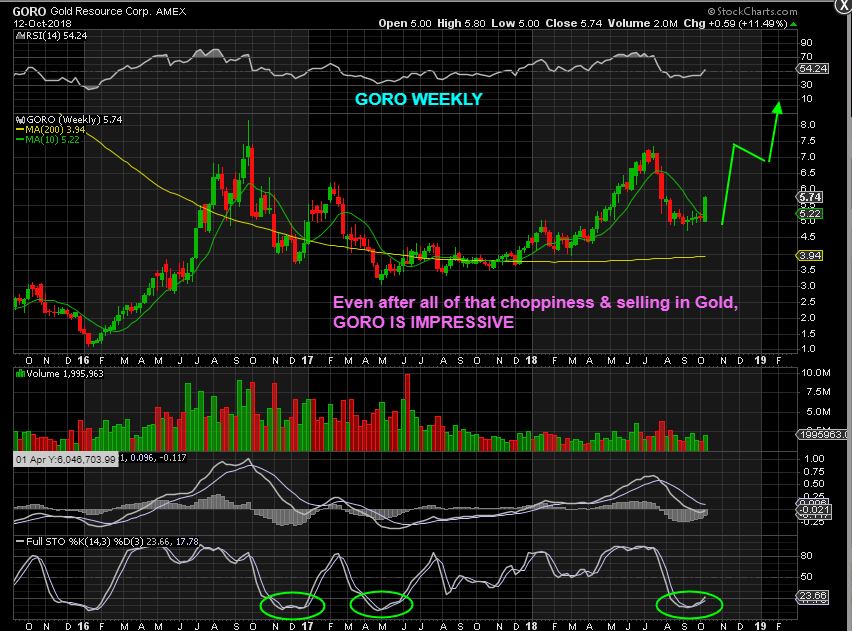
GORO WEEKLY – Even with all of Golds selling off, GORO does not look bearish, so I mentioned last week that I bought it right before it popped.
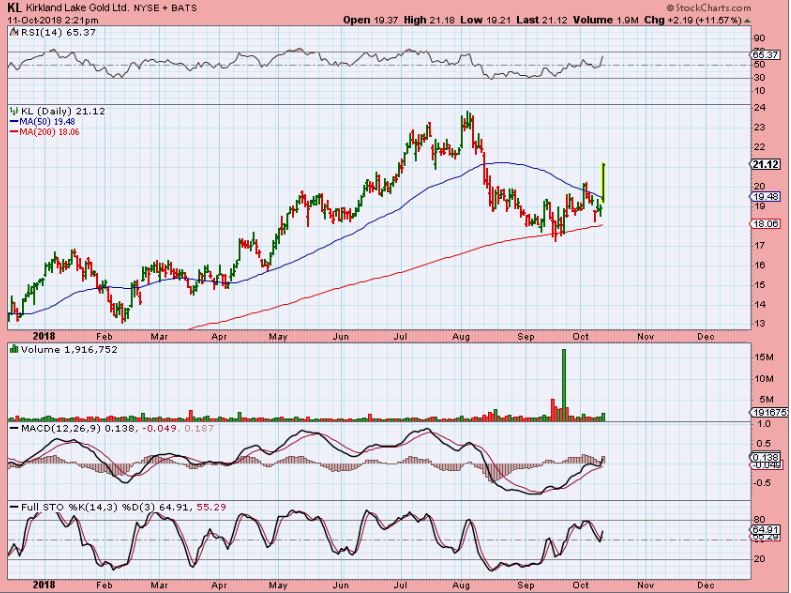
KL DAILY OCT 11 – I posted this chart in our reports last week showing how KL Bullishly pulled back to the 200 daily sma and bounced. Perfect.
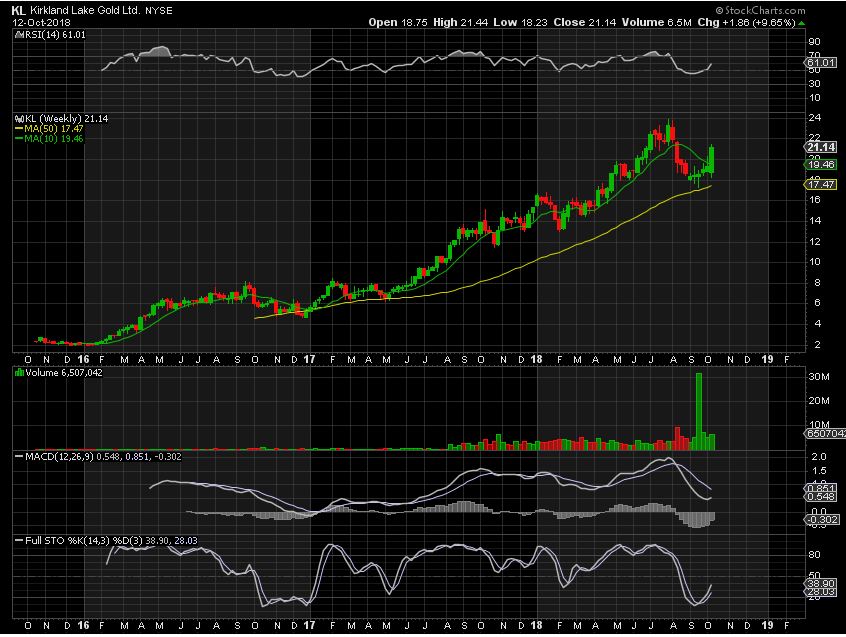
KL WEEKLY – WHAT – A – BEAUTIFUL – CHART. It remains oversold, and simply dropped and tagged that 50 Weekly MA.
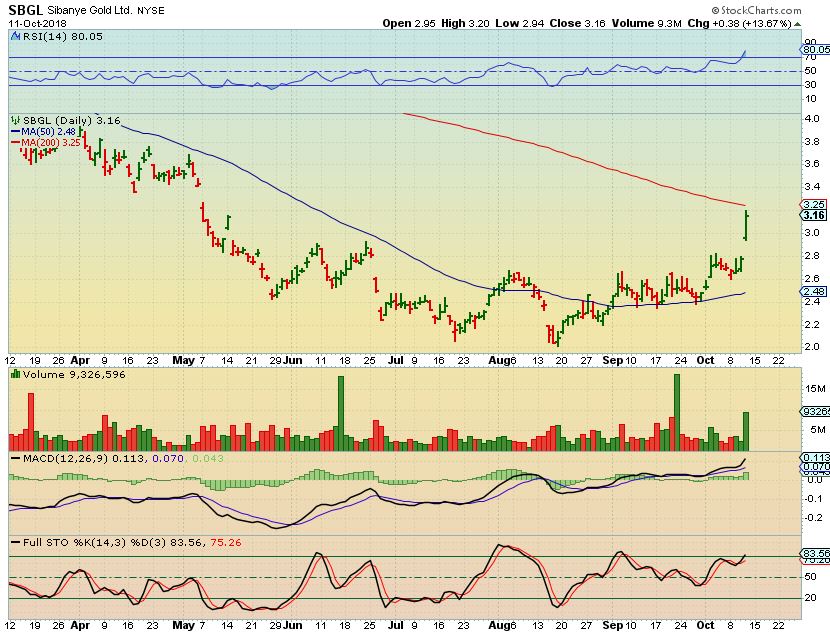
SBGL DAILY – I mentioned buying this last week before the pop too. It has formed a nice round base. Due to the progress that it made bouncing off of the 50sma and forming that rounding base, I also like the weekly chart..
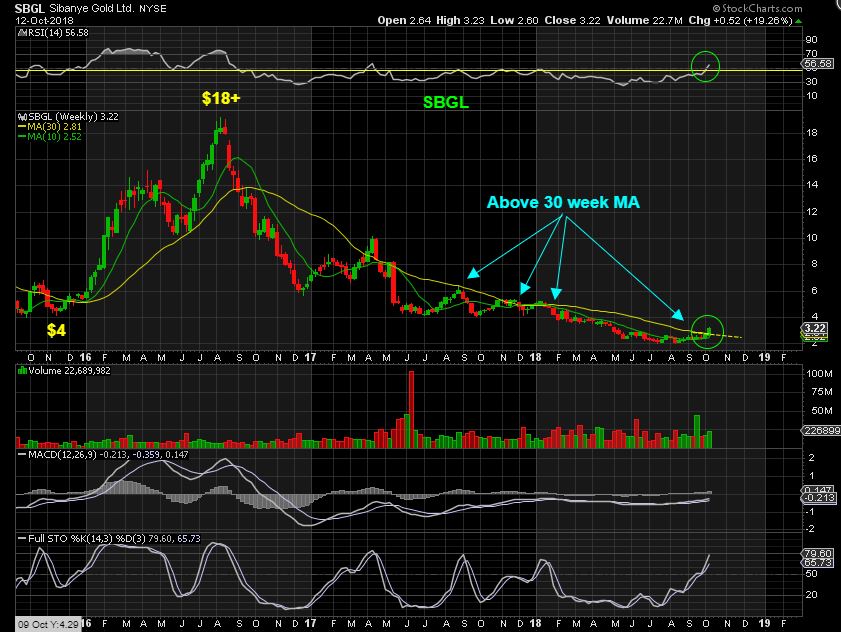
SBGL WEEKLY – So SBGL has now made it above the 10 & 30 week MA, and that is considered bullish. This used to be an $18 stock in the 2016 run. It is $3 now.
That is your weekend review. We have had a very promising development in the Precious Metals sector. A LONG AWAITED DEVELOPMENT. I am a lot more excited about the possibilities going forward than I think this report shows. If you were sitting next to me in a coffee shop or at a bar having a coffee, tea, or drink with me and asked what I think of the current COT set up, or Golds breaking that trend line on the POP higher, or the inverse H&S on GDX & GDXJ playing out, etc. ? You’d see my excitement about this current set up and the Bullish possibilities that can come from it. GOLD has bottomed and traveled along sideways under the 50sma for weeks, driving many crazy! We now have our first real burst higher.
.
It was another difficult bottoming process, so I have tried to just stay focused on the facts and remain unemotional. For weeks I have been pointing to the facts that The COT shows that Smart Money was going long (very Bullish) , The GDX:GOLD Ratio was Bullish, I have been showing a GDX INVERSE H&S formation (bullish) , GDX & GOLD Crawling along under the 50sma (Bullish) , Cycle Counts overdue for an ICL, and I searched for and found various Individual Miners that were leading the way higher out of the lows, etc etc, . These were our accumulating Bullish Signs, but Time just kept passing and that certainly did not make this easy.
.
This week, we got a very nice POP to confirm that we were positioned correctly. With an ICL in place, I would now expect some follow through over time. I look forward to next week, or the next few weeks, as we anticipate that this break out higher could lead to ‘short covering’ and then additional buyers jumping in, not wanting to miss the boat. We could begin to TREND upward like a normal bullish stair-step higher, instead of the choppiness that it frustrating and difficult.
.
Group hug for everyone, I think we’ve finally made it. Thanks for being here with me at Chartfreak. 
.
Enjoy your weekend!!
.
~ALEX
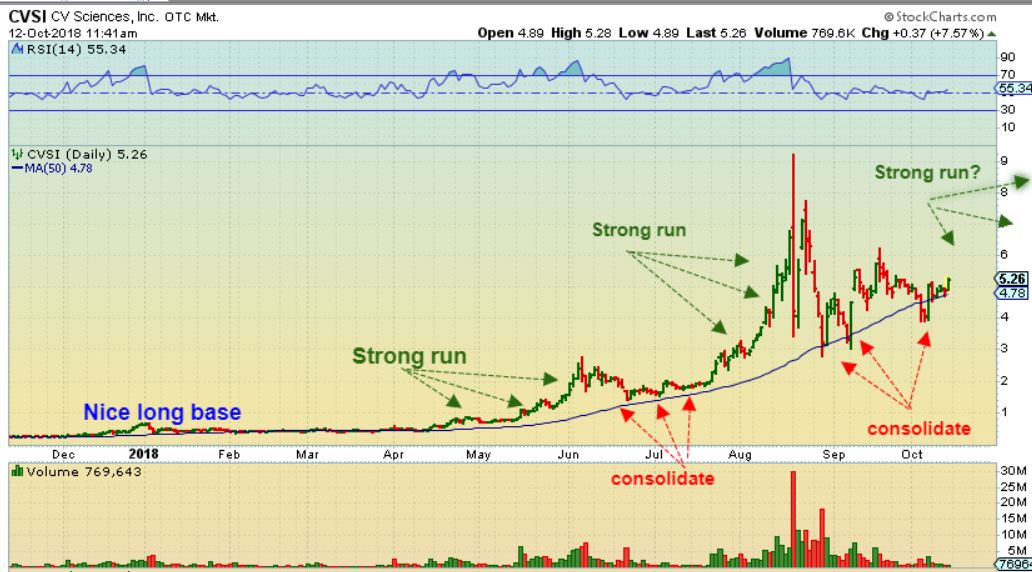
CVSI – I added to my CVSI position Friday, some of these MJ stocks look to have pulled back, many have consolidated, and may be ready to run higher. CVSI regained the 50sma
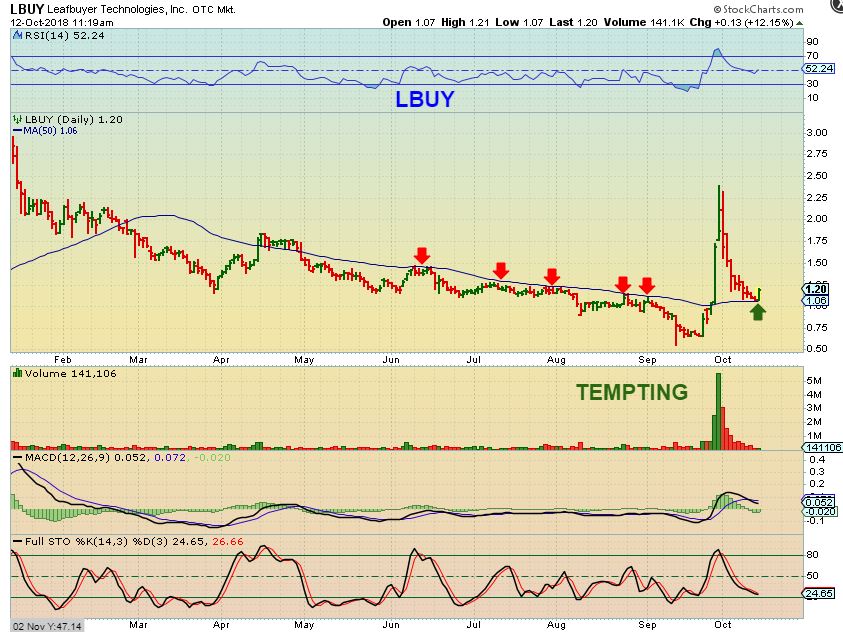
LBUY – LBUY reversed on support of the 50sma, so it could be considered low risk with a stop under Fridays lows.
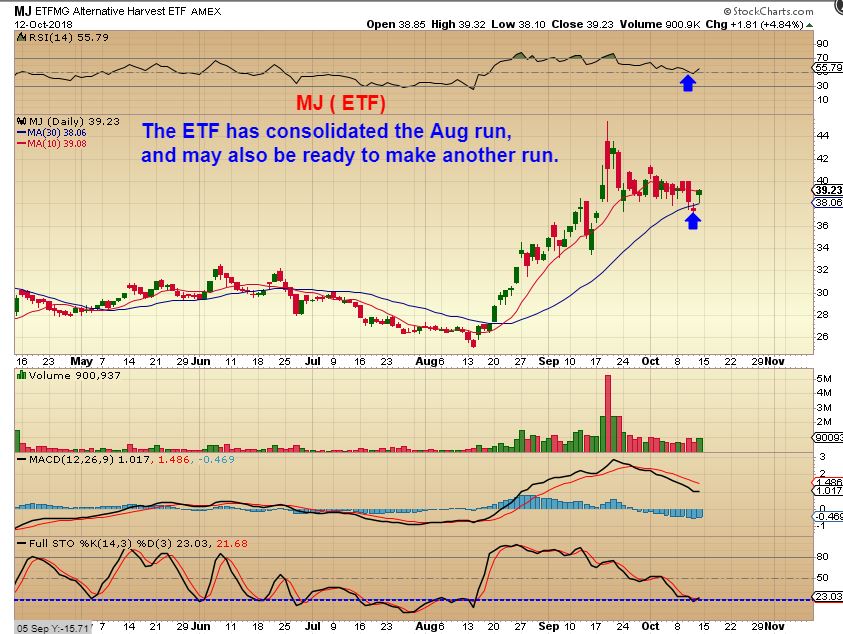
I have my eyes on a few other MJ SET UP too, so I am focused on long Miners and still long some Medical Marijuana stocks too. I still own OGRMF, CBWTF, CVSI, NWGFF, etc and even the MJ ETF has consolidated and may be ready to go higher.
.
Finally oversold, this could be a ‘BUY WITH A STOP’, or keep an eye on it. In 1 month MJ ETF ran from $25 to $45! Is it time for round 2?
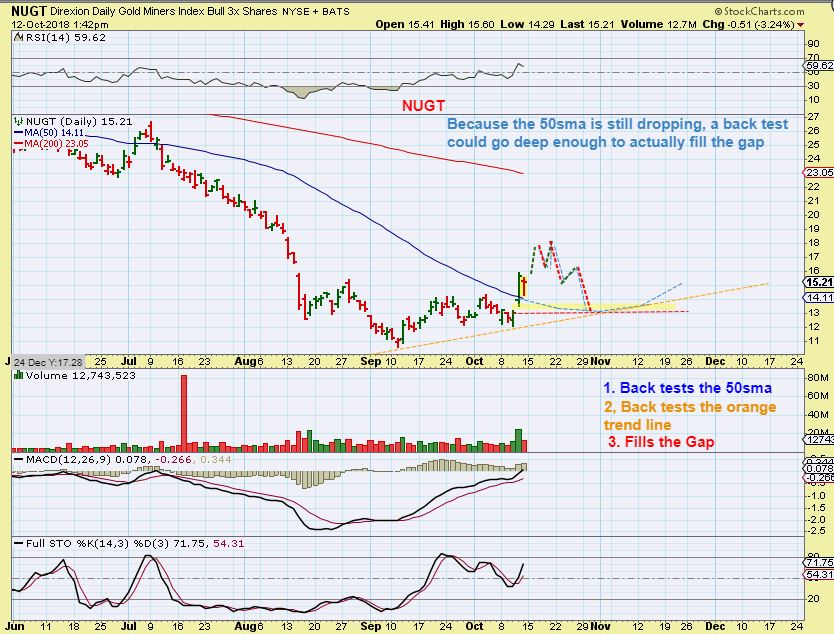
NUGT DAILY – I want to call this my ‘wort case scenario’ if this sector remains bullish. It is a back test that fills that gap, and this DOES NOT have to happen at this point. I wanted to throw it out there just in case we see a few down days into a dcl, and we dip back down further than expected. Read the chart.