
Weekend Detective Work
I have been digging in this weekend, and looking for more clues within our market sectors. Let’s just get right to it, I’ve stumbled across some rather ‘interesting’ finds to share with you. We will focus much of this report on the GOLD & MINERS , after reviewing the Big Picture on the General Markets and Oil…
.
SPX DAILY – The selling has been relentless and as mentioned, the safer buy would be to wait for a confirmed daily cycle low (DCL). Though we did have a bounce over a week ago, this week we did not have enough buying to push above that 10sma. That said, CYCLE COUNT indicates that we are very close to that dcl. A doji candle formed Friday, a candle of indecision with Buyers Vs Sellers breaking even. THE LOWS ARE DUE.
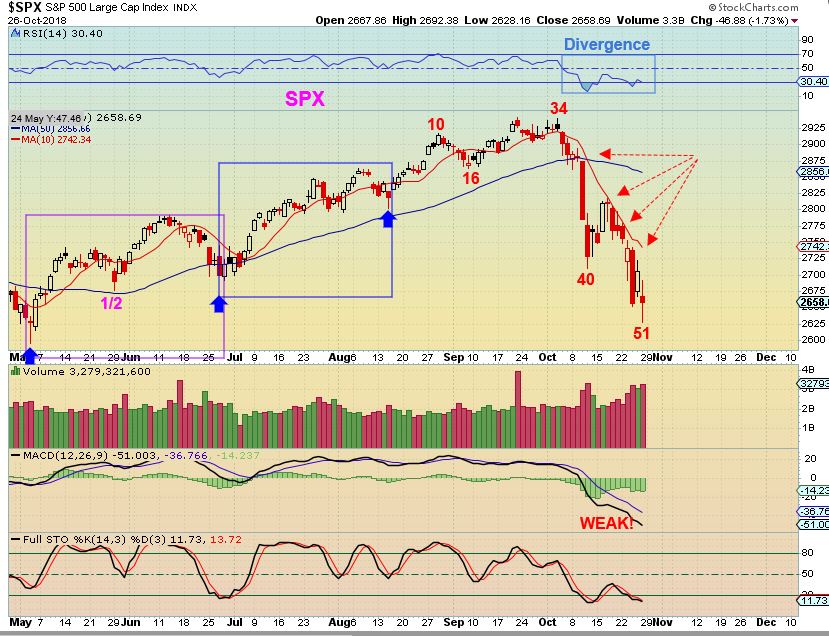
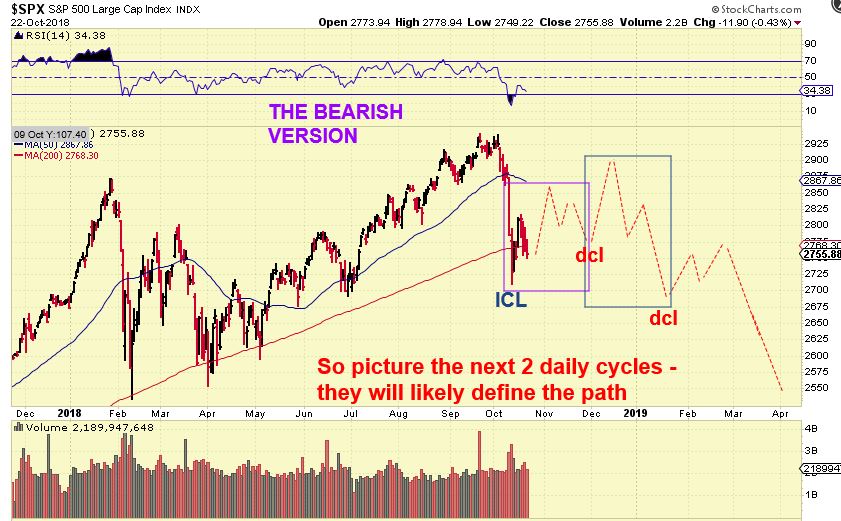
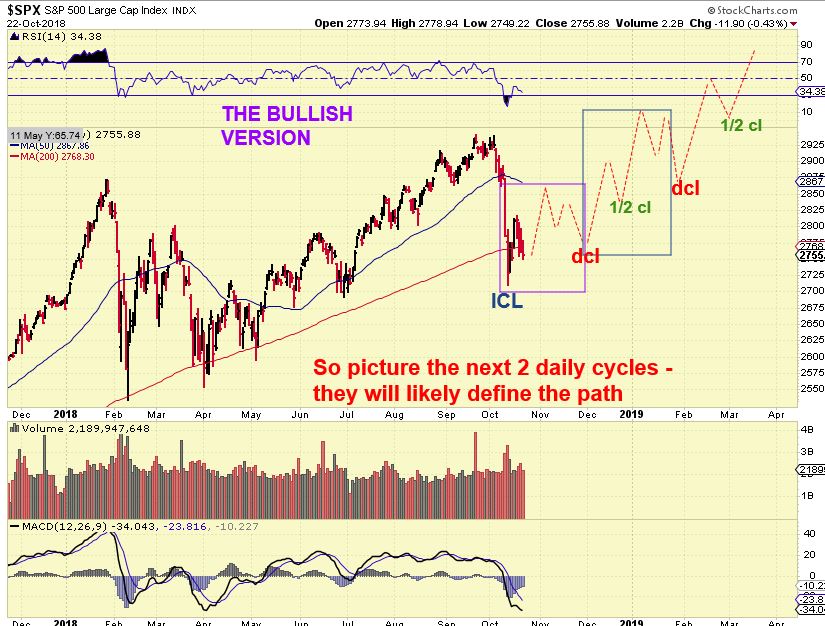
I have already pointed out these charts, but it is a necessary reminder: We are due for a DCL, and likely an ICL, but the next 2 daily cycles could just suck in the Bulls for the slaughter. .
But you can go long, raise stops on a price rise, and see if this unfolds. I am really thinking that the Bull needs a rest though.
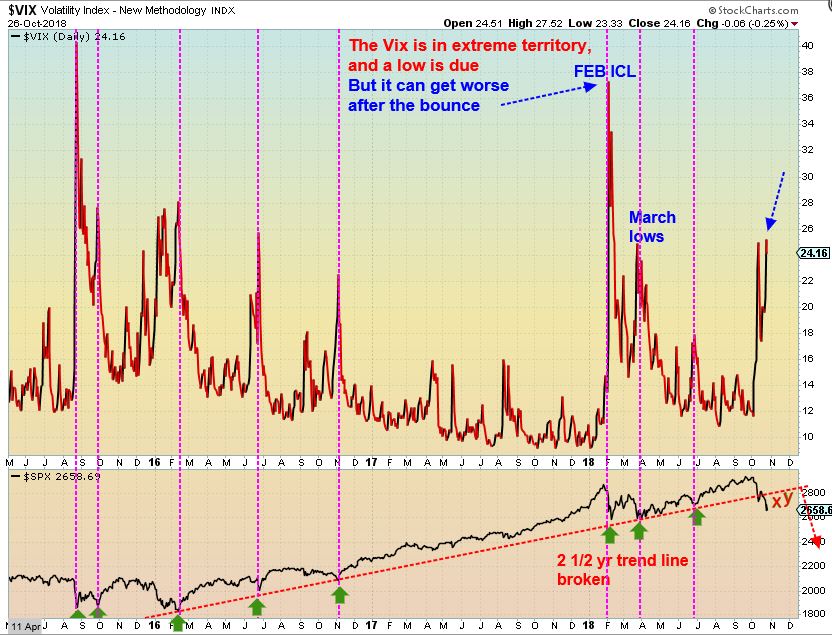
VIX & SPX #1 – This VIX chart with the SPX shows me where Lows are likely to form. Notice how much more extreme that the Vix can get ( or has been, even in Feb). Also look at the lower box, the SPX broke a 2.5 yr trend line.

VIX & SPX #2 – THESE ARE WARNINGS. So look at what I added to the SPX in the lower box. That could be our next 2 daily cycles starting soon with an ICL, and then markets pushing higher after elections in the US & into the end of the year. Remember that the markets Crashed last Jan through March, so we could see that again after a rally.
NASDAQ MONTHLY – That is one BIG Selloff Candle for October. October ends next Wednesday, so
1. Can we bounce next week & form a reversal candle?
2. Would a reversal make it Bullish? Not really. Look at the market action after the last crash & Big reversal candles. It sold off to new lows gradually over 7 months.
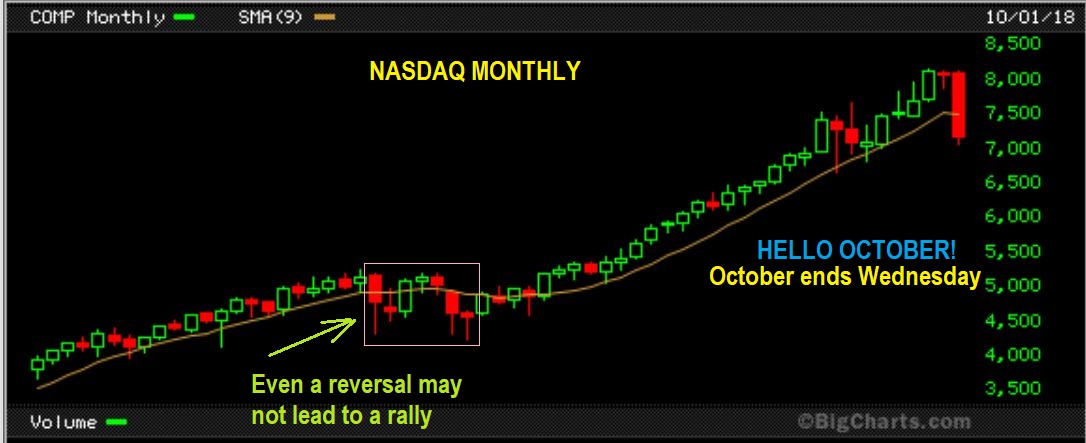
So right now, I would expect a bounce and it could be into the end of the year really, with 2 daily cycles out of an ICL, but that means that once a low is in place, I am short term Bullish, cautious about the long term.
.
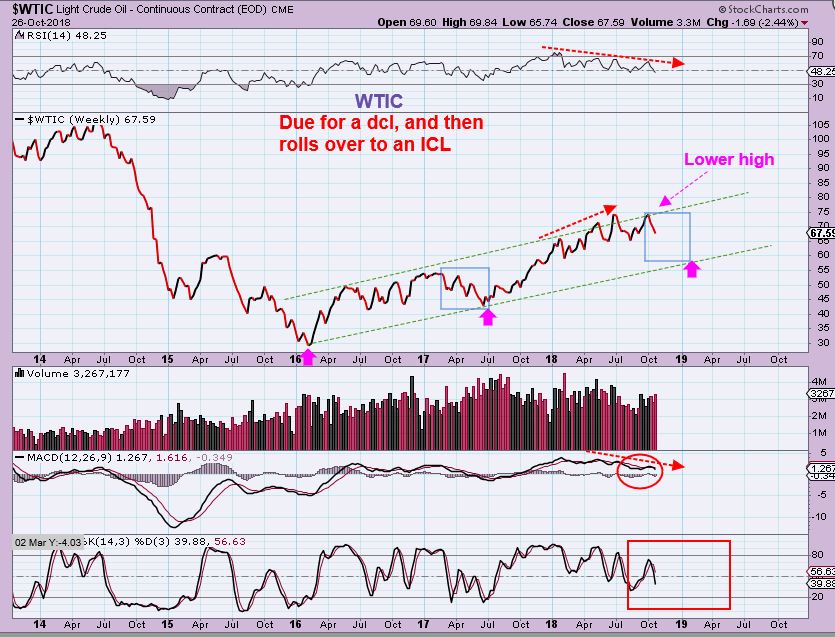
WTIC – I have been calling for this drop in Oil and a daily cycle low to form any day now. At day 47 on OCT 23 , we were coming due ( oil can run 50+ days). We have broken the 50sma & 200sma. I going to skip to the weekly chart now…

WTIC WEEKLY – After our next daily Cycle low, I expect a L.T. Daily and another drop into an ICL. Why?
1. Look at the RSI as Oil was making new highs
2. Now we had a lower high
3. Stochastics on the Weekly Chart has room to drop & so does price in this channel
4. Oils Intermediate Cycles are long now, containing longer daily cycles, so we see the last 2 ICLs at close to a 1.5 yrs. We are now due, see the blue box.
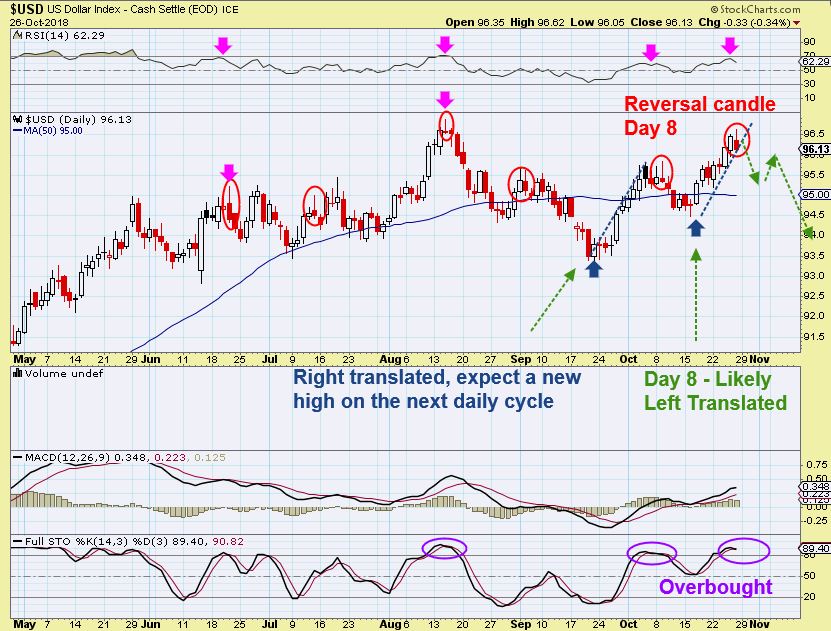
USD DAILY – A reversal candle on day 8 is promising for our second daily cycle becoming Left Translated & drop from here. It Could drop & pop & drop and top, bouncing around (Allowing GOLD & MINERS to finish reaching their dcl). So far, The USD has been strong, but other tops saw the RSI roll over here, and I see the RSI rolling. This still looks strong, but signs are at least ‘short term’ weakening.
.
PRECIOUS METALS
.
I hate to even mention anything remotely bearish in this sector, because it does cause a lot of concern and even possibly unnecessary panic in some cases. My thinking is this: If there is ‘something’ developing that would catch my attention as possibly a different scenario than what we have been discussing, I feel that I can only keep it to myself initially. THEN it either fades away and remains unmentioned or it grows and becomes a bit more of a possibility. Today – we go down THAT road of me discussing something slightly different from our current view at the end of the report. IT WOULD BE LESS LIKELY for now, but since it has been slowly developing as a possibility, I want to point it out ahead of time.
.
FIRST THE CURRENT SET UP – The Bullish View still most likely to play out.
.
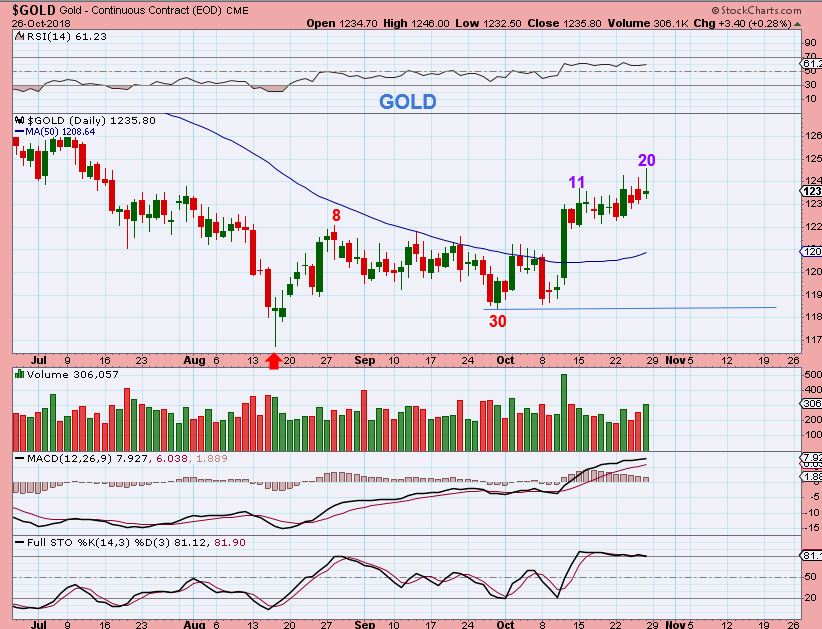
GOLD – This is Bullish with a day 20 peak on a second daily cycle. Miners dropped to their 50sma, so Gold should head down and back test the 50 sma at it’s next dcl too. THIS IS BULLISH SO FAR.
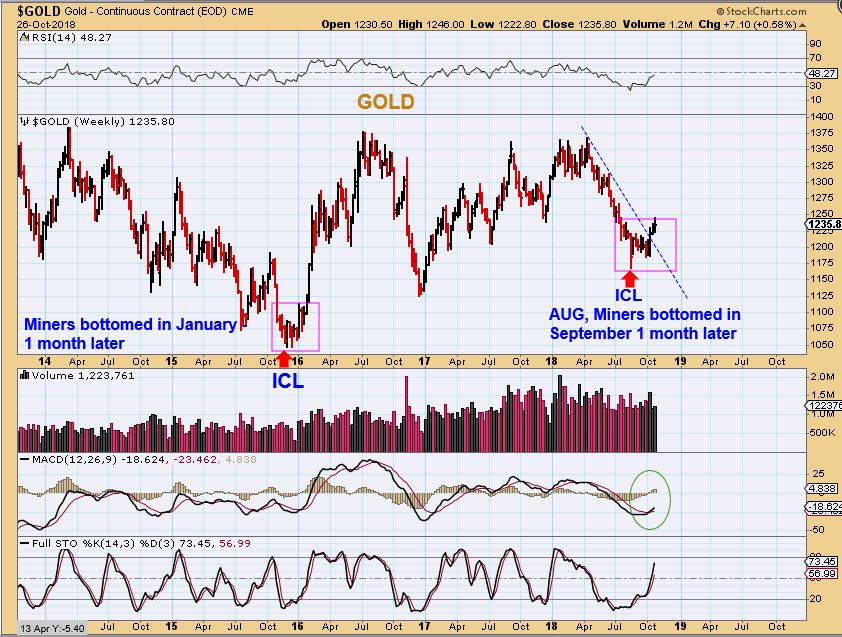
GOLD WEEKLY – The ‘Base’ and break higher resembles the lows of our 2015-2016 ICL and massive blast off higher. View the chart.
1. In DEC 2015, GOLDs ICL came 1 month before Miners. The Miners ICL was Jan 15ish, 2016.
2. Right now GOLDS ICL came in Aug, and that is also 1 month before Miners ICL in SEPT. (See the chart). So this remains bullish at this point.
GDX ( 10:30 a.m.) – The current count for MINERS would be day 32 , if day 21 was not a dcl. Again, this would show that Miners bottomed 1 month after Gold with thier ICL in September, and a back test of the 50sma in the first daily cycle. THIS REMAINS BULLISH SO FAR.
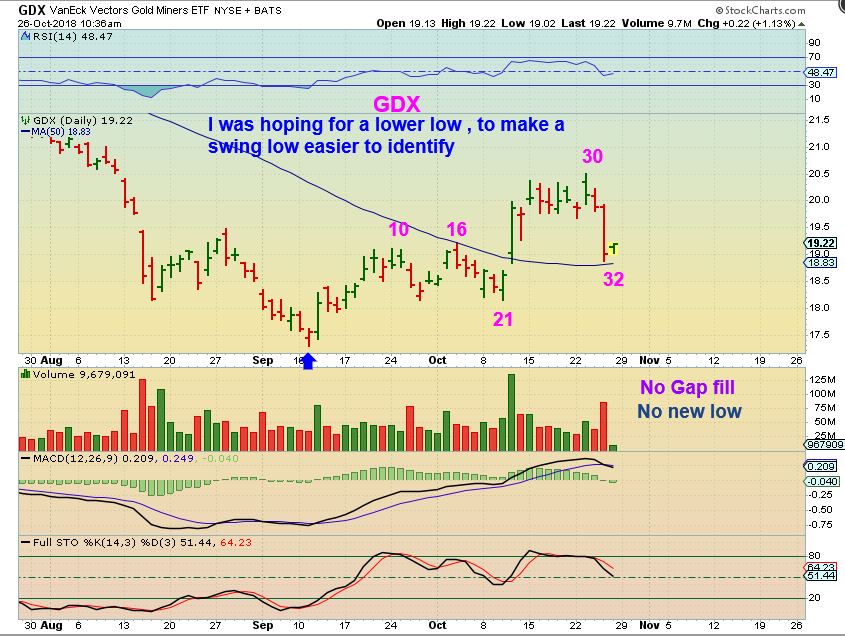
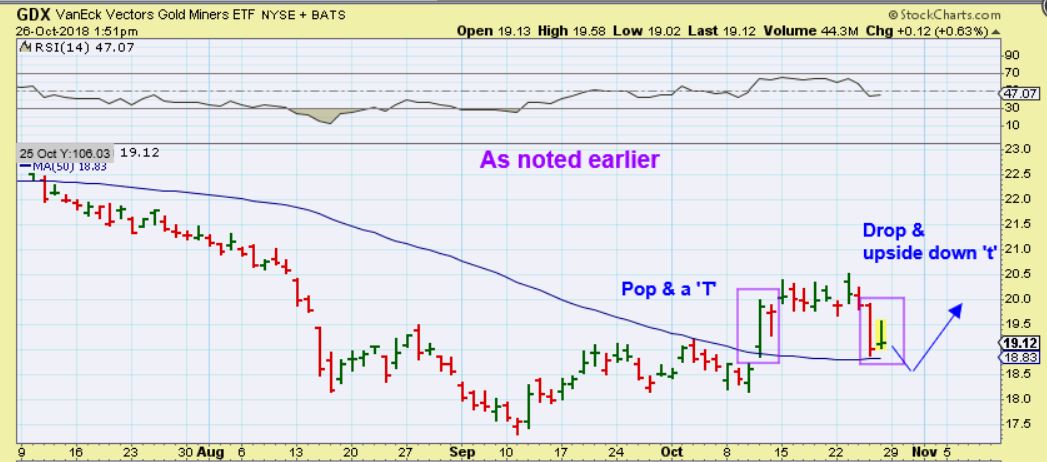
I mentioned in our comments section that I noticed something interesting. Look at that day that GDX POPPED. It had no real follow through. It POPPED, formed a ‘T’, and then went sideways, so our recent DROP may not have follow through either. I drew it as a DROP, form a ‘t’, and slightly lower gap fill as a dcl.
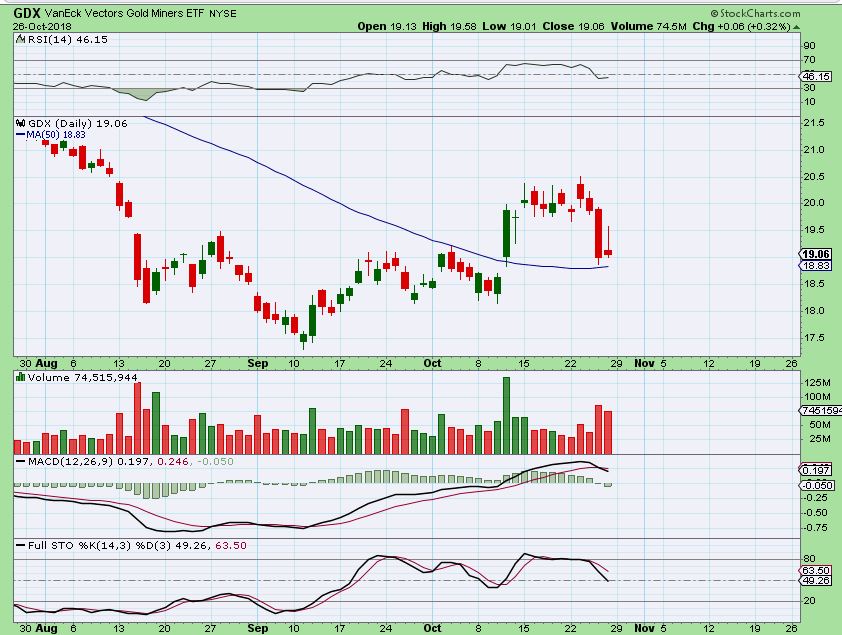
GDX AT THE CLOSE : GDX back tested the 50sma and we got a Gravestone Doji Friday. THESE CAN BE REVERSAL CANDLES
GDXJ – This is similar, but a hint of some things that I do not like. I don’t like the RSI losing the 50% when the stochastic has more room to drop, and the MACD crossing over. I have mentioned a possible shake out & Gap fill all along too, so it is possible that we go lower, and …
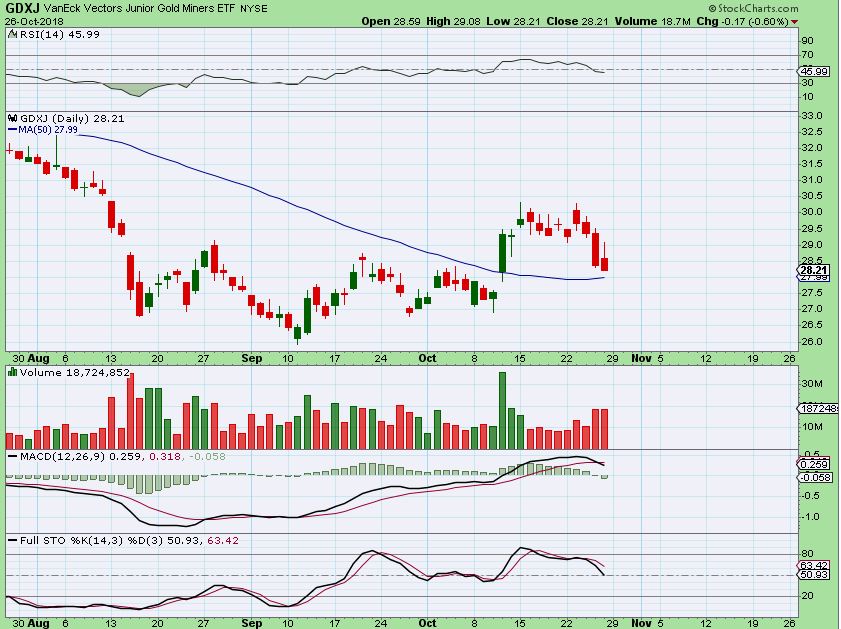
These can all be fixed eventually with a run higher or even a sideways move.
Seeing those points mentioned above also leads me to start to look for other possibilities … ‘Just In Case’ we break the 50sma and do more than a gap fill. What if we drop back to the lows? This is where I make people nervous, and I hate that, but I will include additional information on that at the end of this report.
.
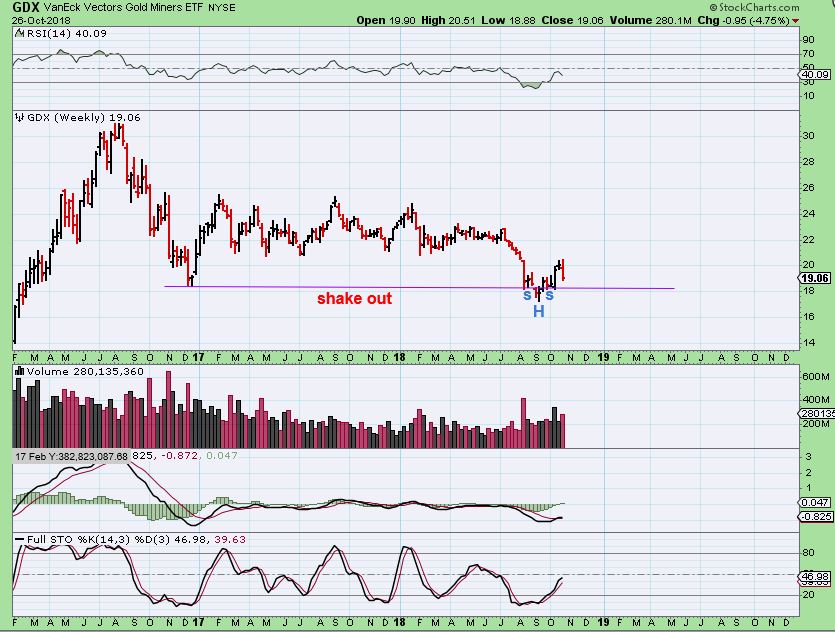
Before we review the other ideas, this is a Bullish Weekly View of GDX . You can see that a stop at say under $18 would minimize losses, but right now THIS IS STILL A BULLISH SHAKE OUT.
.
So I want to close this report as my current analysis, and it remains bullish as is. I will give an alternative view below that would be a bit more unpleasant, but it needs to be addressed so that we are not blind sided or unprepared. For now, things with GOLD & the MINERS are still on track. It is only if we begin to see further deviation, as explained below, that adjustments will need to be considered.
.
Enjoy the rest of your weekend, we’ll see what next week brings our way.
.
~ALEX
.
NOTE: ANOTHER VIEW – This isn’t purely Bearish, but it could drag out the process. I still view this as less likely, but it has to be pointed out, so people will use stops. What? Yes, Too many people still tell me well after a drop, that they didn’t use stops or are still holding on to a stock ( MJ STOCK or TECH STOCK) that is down 25-40%, and want to know the best way out. Wait to sell a bounce or just get out?
Recently – One reader frustratingly wrote that they decided to ride out the drop in the General Markets ‘long’ in TQQQ with out stops, and then added on that first bounce with Calls, again with no stops. Now we are at deep lows. “Do I sell now, or hang on for a bounce?” Sadly, now I have no advice. We could bounce, we could drop a bit more. And it was mentioned that They knew that I said that I expected an ICL drop similar to February, but didn’t want to give up positions. Conclusion: It is not the end of the world, but it is emotionally painful and makes it very hard to be confident if one doesn’t step aside at a reasonable spot, especially leverage. Then often when selling persists, people sell right at the lows to stop the pain & it rallies higher. SO AVOID THAT PAIN, STOPS ARE IMPORTANT IN CHOPPY MARKETS, use them if things start to deviate. Now let’s discuss what I have looked into, and if you use stops, you’ll be fine ( maybe irritated, but fine)…
.
THIS IS ONE IDEA THAT CAME TO ME THAT WOULD AGAIN FRUSTRATE THE BULLS (and us) .
.
OUR CURRENT VIEW OF GOLD IS BULLISH AS MENTIONED EARLIER & AS SEEN HERE, and that is why the reports have been bullish with an ICL in Gold. This is a day 20 peak in the 2nd daily cycle. That is Bullish. …
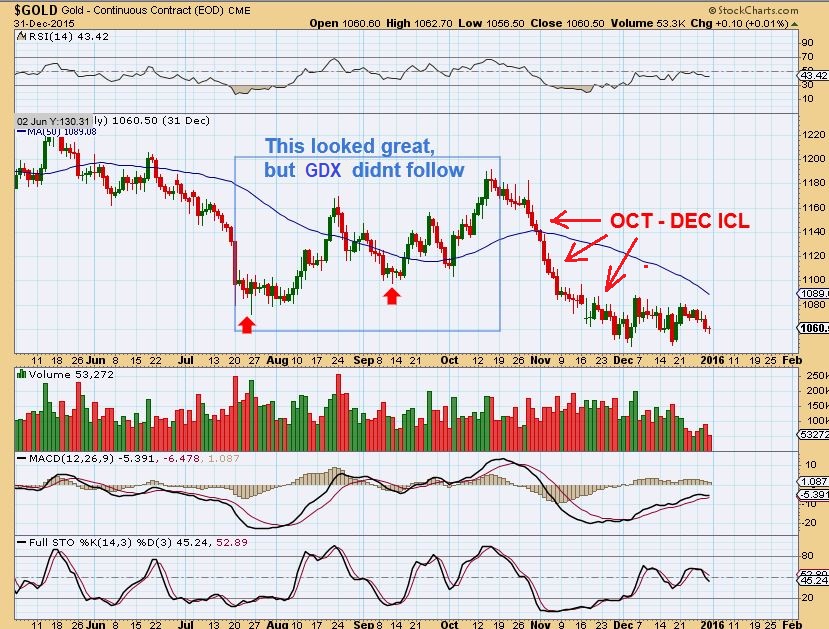
GOLD JULY ICL of 2015 – In the Blue Box, GOLD was Bullish on its 2nd daily cycle out of an ICL too. Gold moved with a higher low in September, but Miners actually dropped to a lower low in Sept. The 50sma had turned upward in Gold then also. Notice GOLDs HIGHER LOW IN SEPTEMBER.
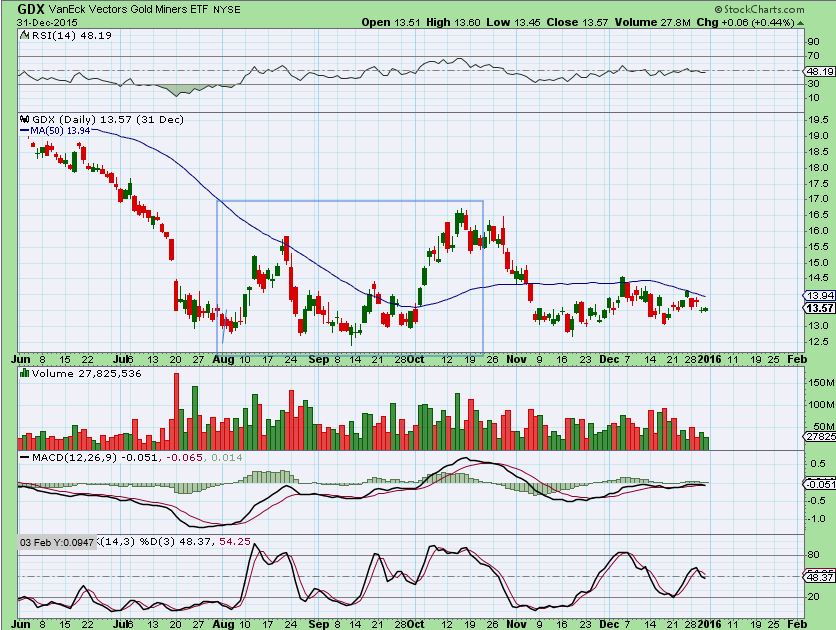
GDX 2015 July onward – GDX had a drop to a lower low in SEPT, but Gold didn’t. That meant that GDX was weaker than GOLD (Sound familiar), so I am watching GDX now on it’s back test of the 50sma. Gold didnt drop yet, but that is fine so far. My next point? Miners in 2015 dropped back to lows after losing the 50sma in November & this just became a large choppy base building process, as you will see. THEN GOLD CAUGHT UP & DROPPED TOO. Let’s look a bit further…
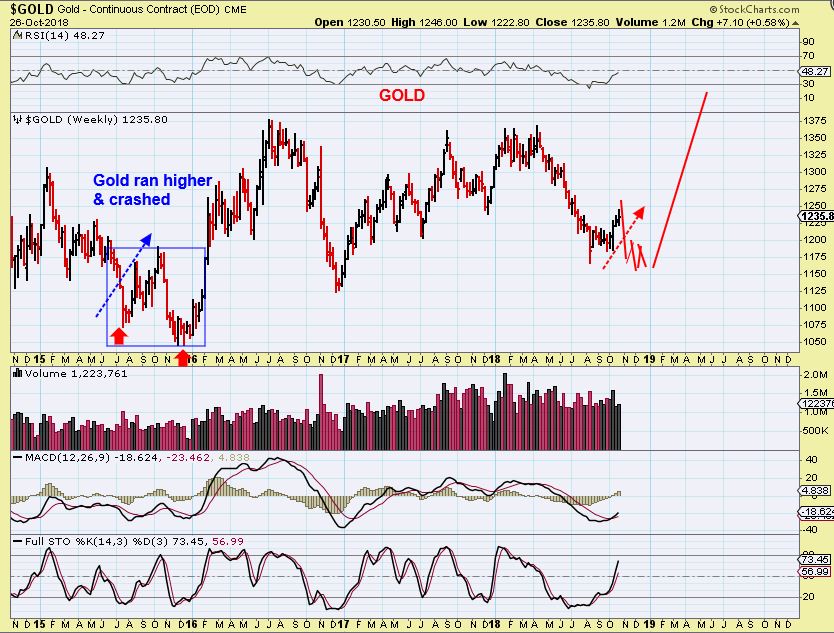
GOLD WEEKLY – So Gold made that 2 daily cycle run in the summer of 2015, but then crashed from October to December. I have drawn what that would look like if it happened now on this chart.
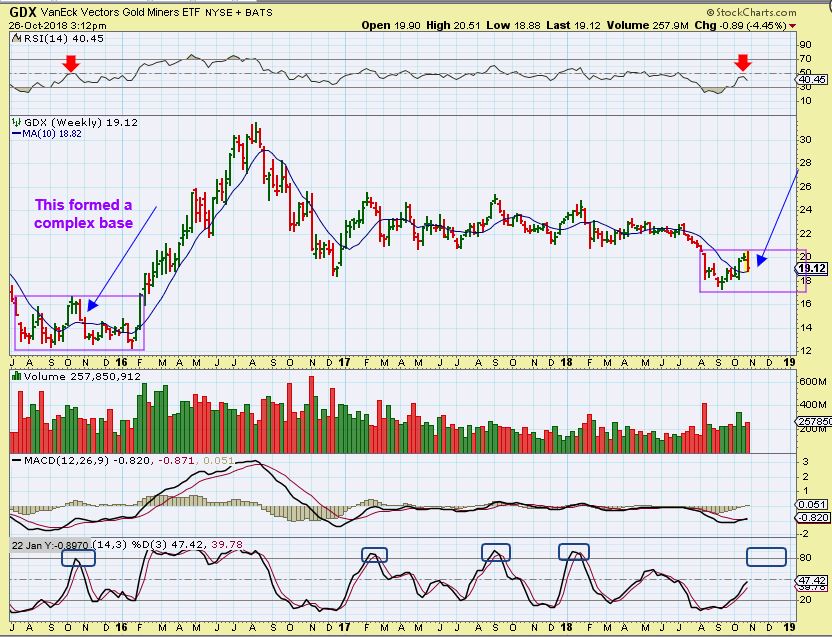
GDX WEEKLY – So I looked at The GDX WEEKLY and see that this weeks drop is also a bit similar to the first drop below that 10 weekly ma too (Blue arrows). We are currently above the 10 week MA, so this is Fine right now. That matches the 50sma on a daily, so this is our back test. In 2015, the back test gave way & dropped to the lows and formed that long complex base into January. THEN THE REAL LAUNCH CAME, so look at the purple boxes…
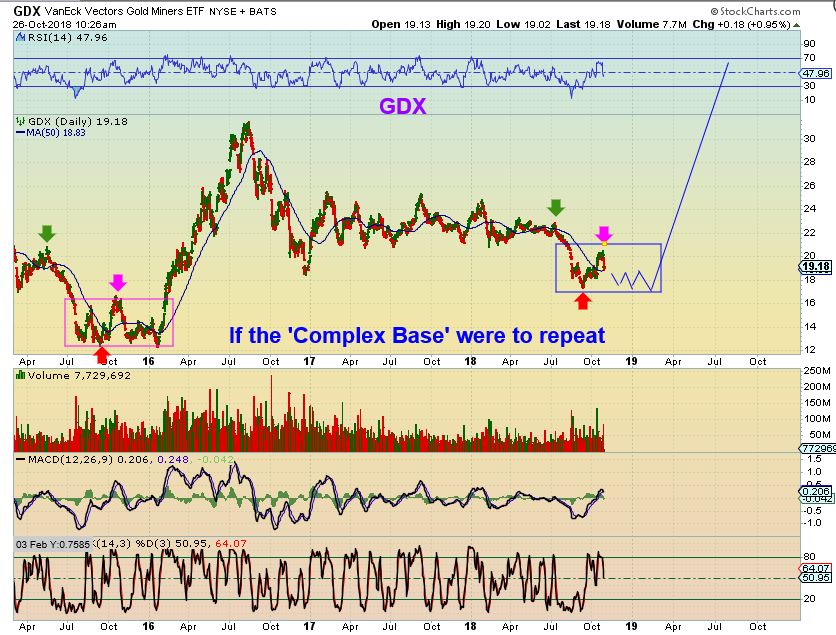
GDX DAILY – For a repeat, we would now see sideways action for weeks.
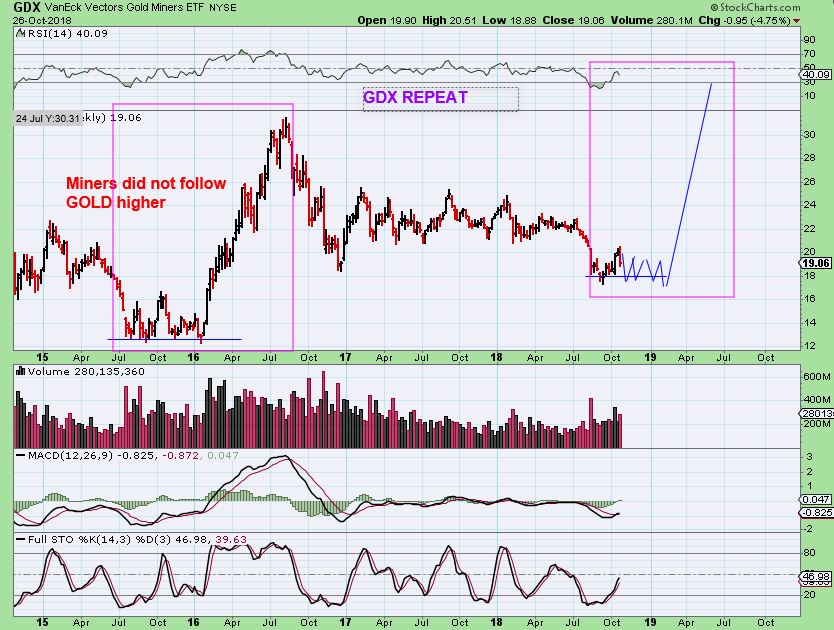
GDX WEEKLY – to form a similar complex base, it would unfold something like this. You can see at this point that it is not unheard of or impossible for a longer base to form.
MY REASONING FOR MENTIONING THIS IS BECAUSE IT COULD MATCH THE TIME WHEN I EXPECT THE GENERAL MARKETS to have a 2 DAILY CYCLES RALLY HIGHER/SIDEWAYS into the year end. Does Gold flounder around while the markets rally? Maybe.
So I just wanted to mention this, but I will close with this Bullish review to build everyone back up 🙂 …
GOLD WEEKLY – The ‘Base’ and break higher Actually resembles the lows of our 2015-2016 ICL and NOT the 2015 Summer ICL- the sharper incline that crashed.
Similar to that time before the massive rally – GOLDS ICL came in Aug this year, and that is also 1 month before Miners ICL in SEPT. That happened at the Red Arrows too (See the chart). So this remains bullish at this point.
GDX AT THE CLOSE : GDX back tested the 50sma and we got a Gravestone Doji Friday. THESE CAN BE REVERSAL CANDLES
I currently see a shake out / Inverse H&S on the daily & weekly chart, so until this breaks down, I view it as bullish.

