
Oct 6th – Weekend Market Review
SPX WEEKLY #1 – I have been expecting a dip into a DCL, and likely an ICL. Last week saw the SPX drop how deep will it be? Please read chart #1…
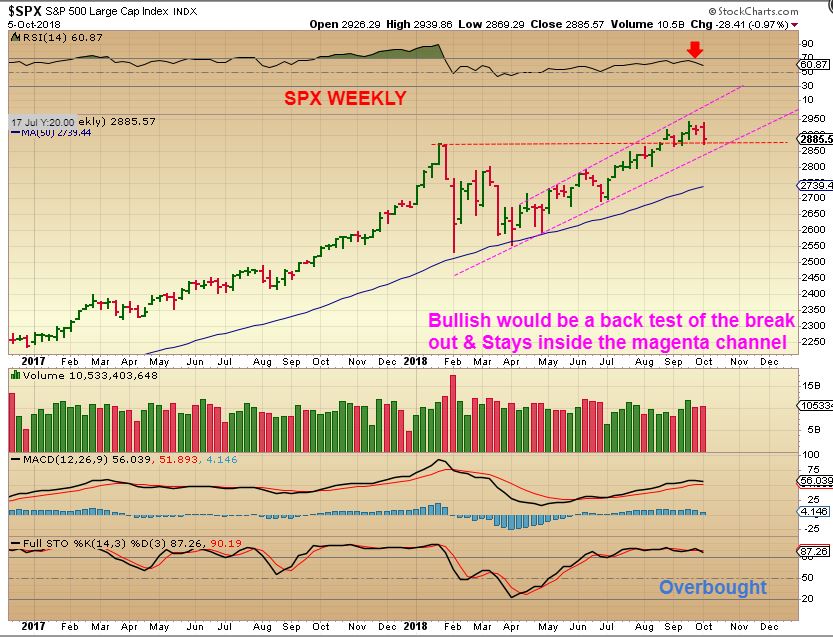
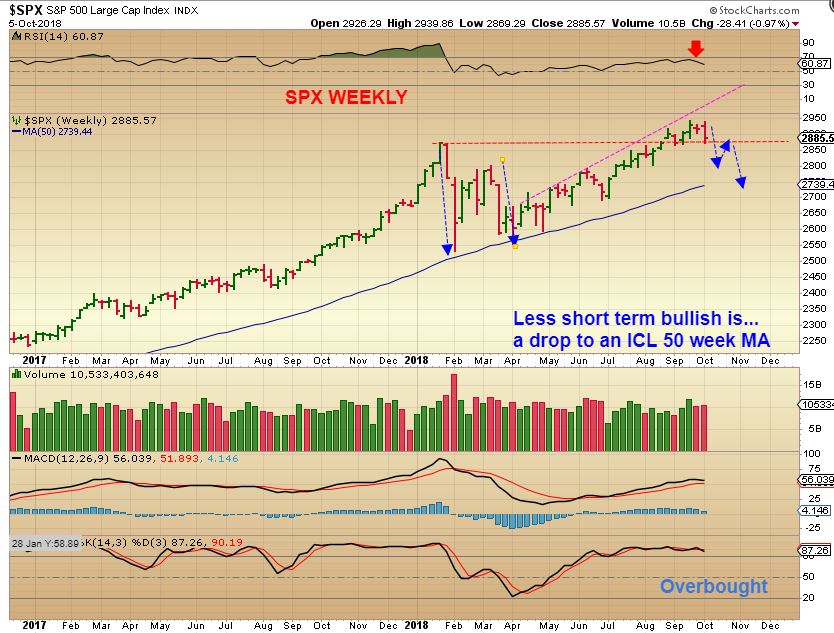
And now Chart #2
SPX WEEKLY #2 – A drop to a visible ICL, similar to the one at the beginning of 2018 could look like this ( or straight down).
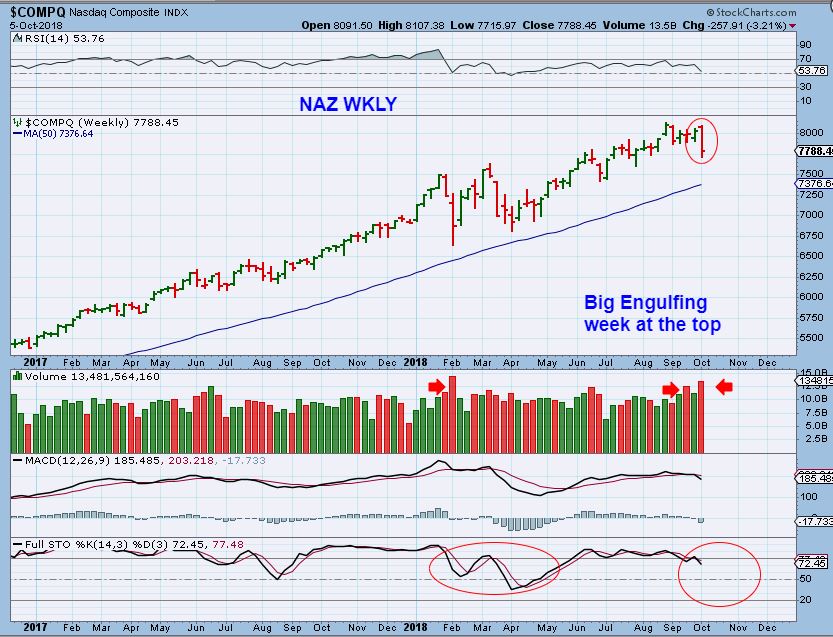
NASDAQ WEEKLY – The NASDAQ lost over 3% and formed a weekly bearish engulfing. The daily chart shows that it recovered a bit , so it could bounce, but we’ll watch the bounce carefully, because this weekly ( And QQQ Weekly) Looks like a high volume bearish engulfing.
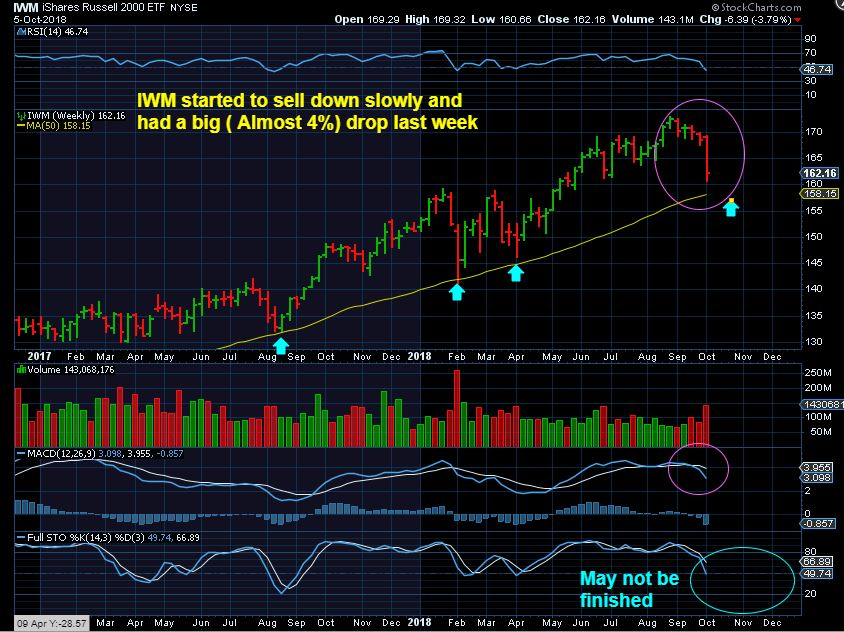
IWM WEEKLY – And the RUT ( or IWM) lost almost 4% last week too.
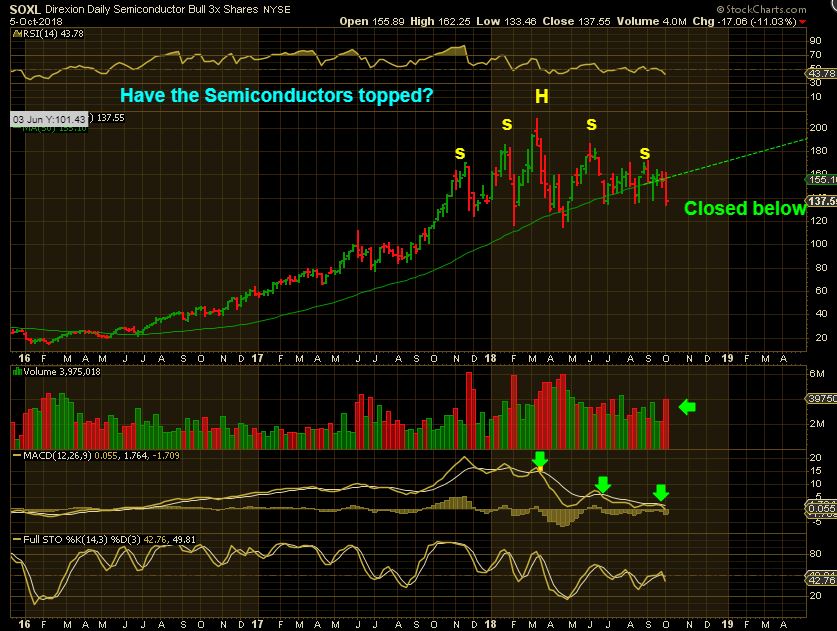
SOXL (Semis) WEEKLY – Closing below the 50 weekly ma, this needs to recover quickly, or we may be seeing Semis leading the way down.
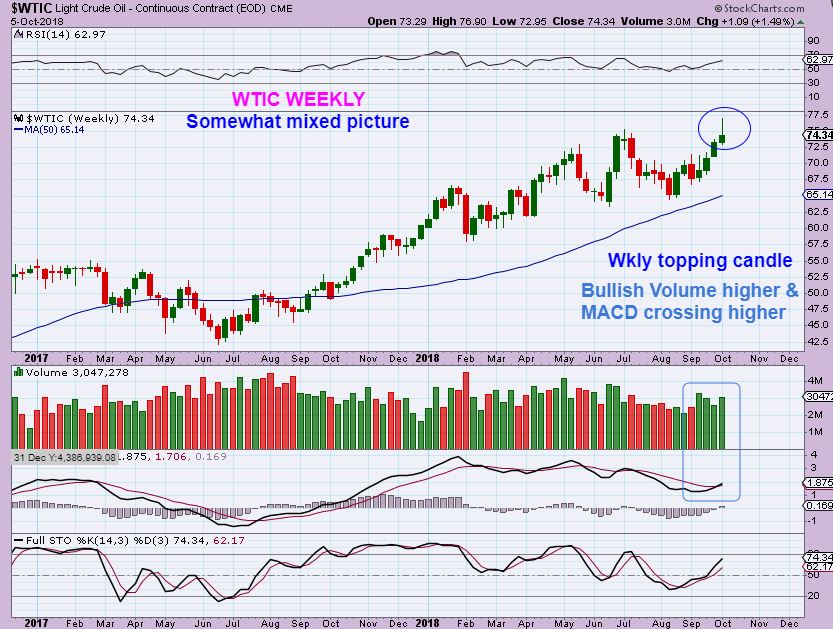
WTIC WEEKLY #1 – After a few strong weeks out of what could be an ICL, This looks like a topping candle
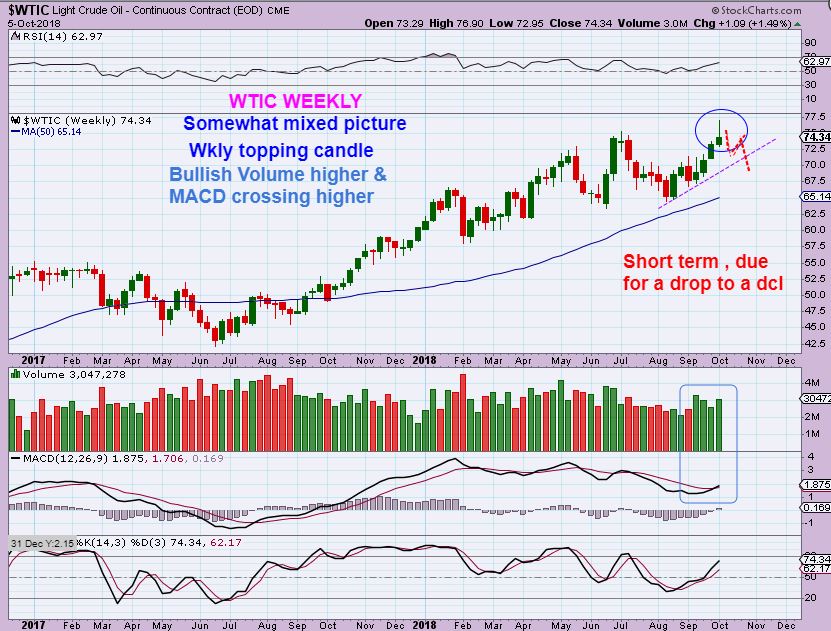
WTIC WEEKLY #2 – A DCL is coming due.
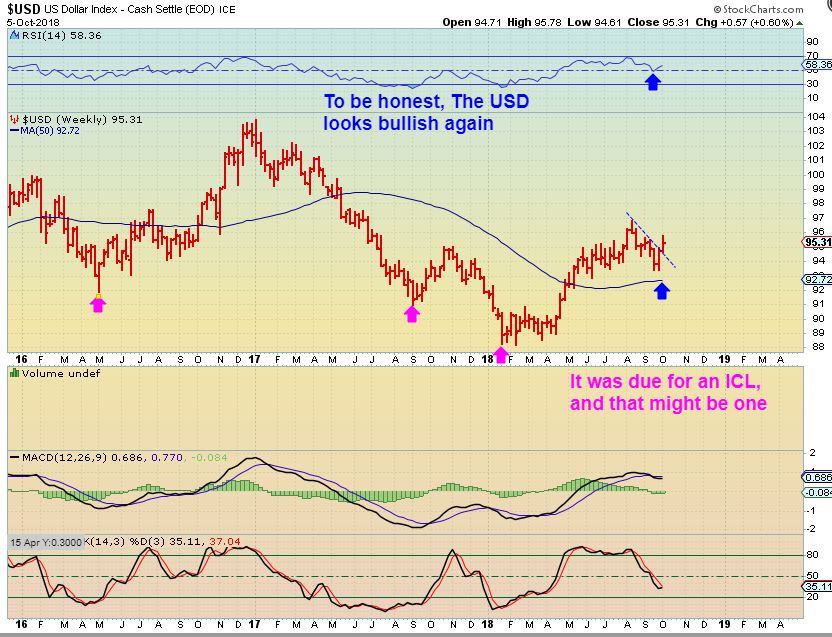
USD WEEKLY -Read the chart
.
Bullish looking USD? What about GOLD, Silver, and The Miners?
.
2 BULLISH SIGNS IN GOLD LAST WEEK
.
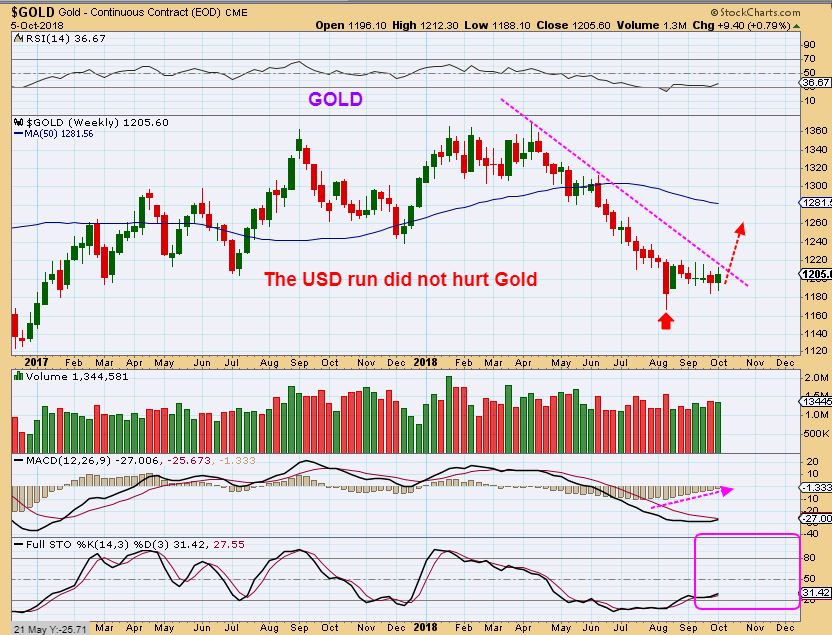
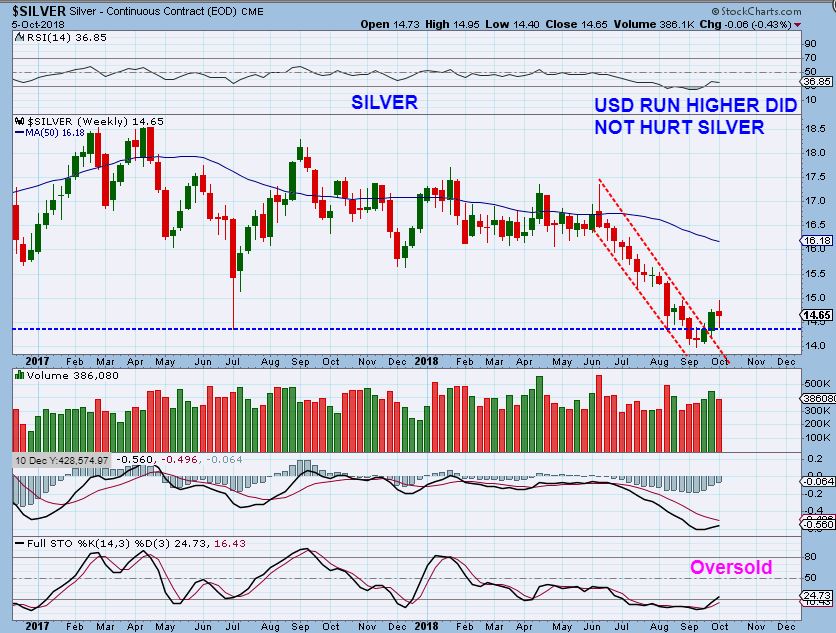
1. The USD was higher, GOLD, SILVER & MINERS were not phased by it.
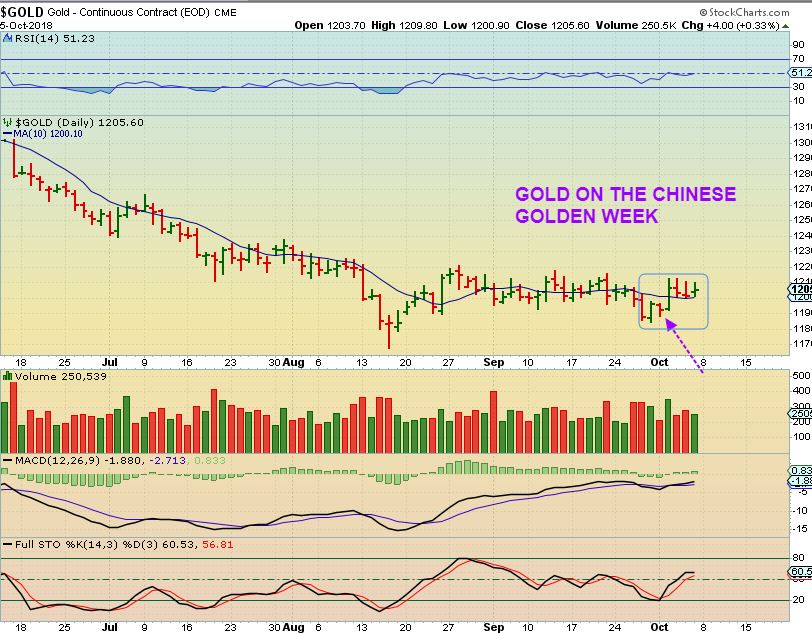
2. Remember that last week was known as the Chinese Golden Week, a week long holiday in China where Gold has sold off sharply ( $40 – $60) over the past few years.
Well, GOLD closed Higher this Golden Week, with the USD rising.
.
GOLD WEEKLY – That is a nice weekly reversal higher , despite the head winds mentioned above.
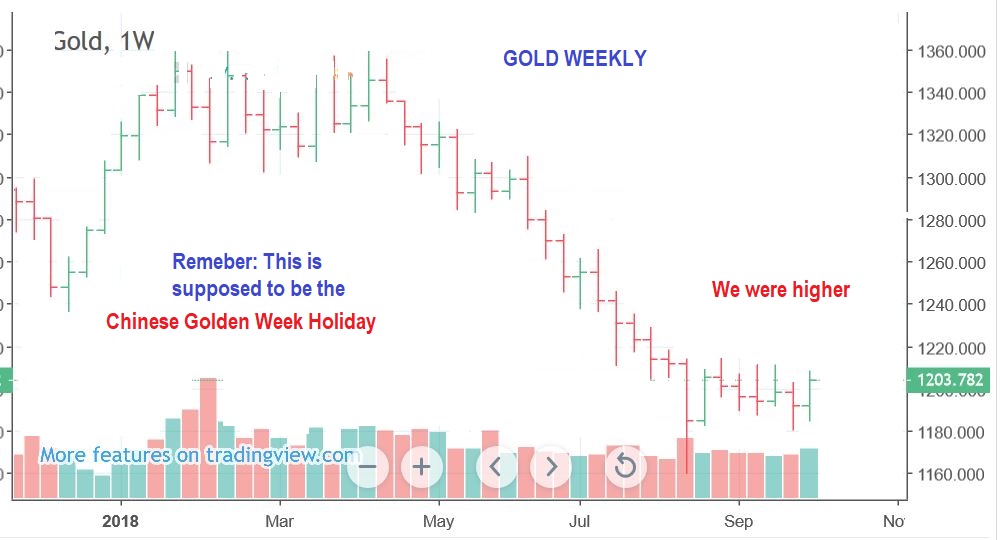
GOLD WEEKLY – We could see buying next week that pushes Gold above its down trend line. Last week I mentioned that on Chinese Golden Week, the losses of $40 – $60 were often regained in 2 days the following week, when the holiday ended. The GOLDEN WEEK holiday has now ended with no loss.
GOLD DAILY LAST WEEK
SILVER WEEKLY – Silver still holds above the shake out
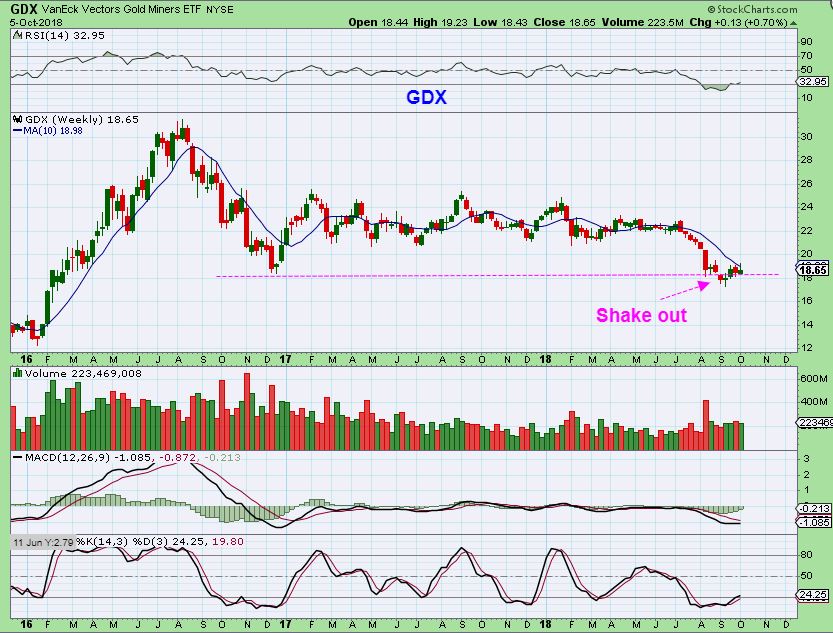
GDX WEEKLY – Miners held above their shake out
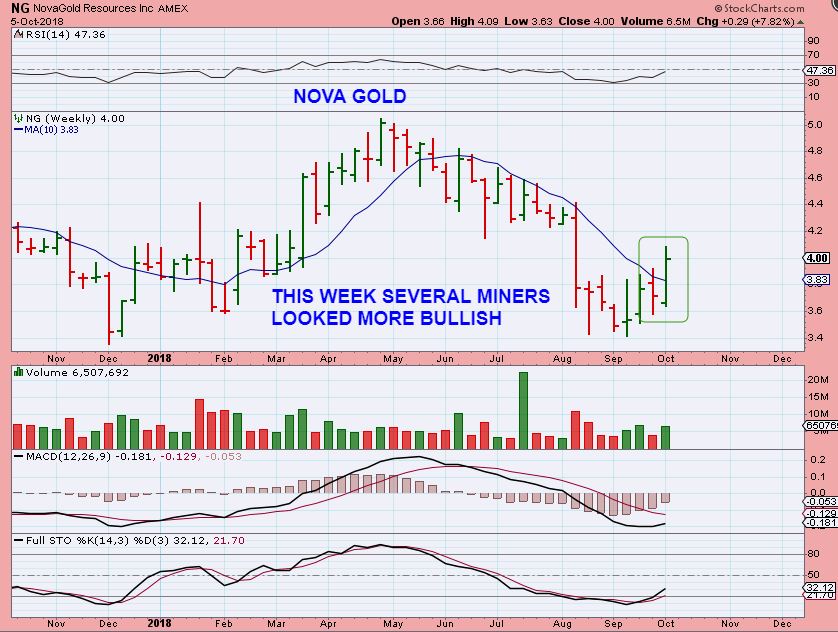
NG WEEKLY – We had some MINERS actually put in a strong week, while the USD ran higher. NG added 8% last week.
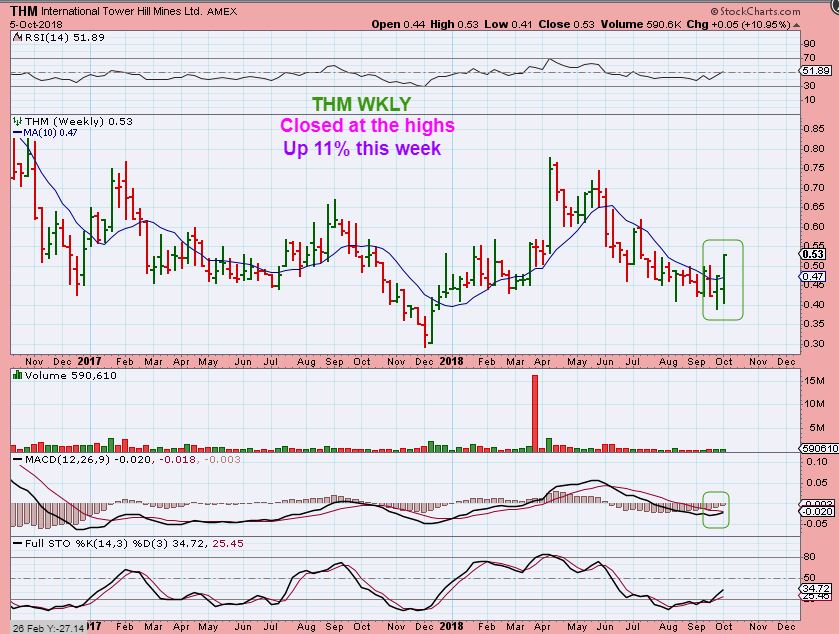
THM WEEKLY -THM added 11% last week.
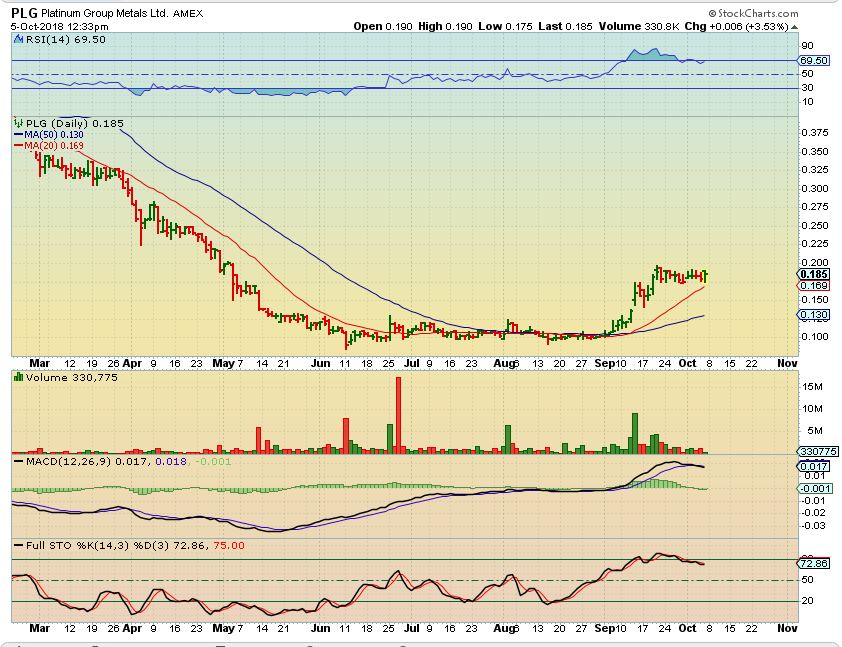
PLG DAILY – Our Platinum Stock. This is just a nice flat-line consolidation so far, after running up about 100% in September. THAT is bullish, for it not to pull back 50% or more in this phase. So Far , this is a beautiful chart.
.
So the General Markets look as though they could drop,
.
The USD actually looks rather bullish, but Precious Metals are ignoring it, and
.
Gold, Silver, and The Miners had a Bullish week despite the Chinese Golden Week, which caused a sell off over the past several years, and also in the face of a rising USD. I have wondered if the General Markets will pull back into an ICL, causing loose change ( Freed up Money) to seek Miners as a safe haven. This is a possibility, the way things are lining up now. That could begin the phase that we have long awaited, the ‘trending higher’ phase. Some Miners are actually already doing that now.
.
Next week, which would be the week after the Chinese Golden Week, has been VERY Bullish for Gold, Silver, and The Miners over the last few years. Gold saw gains of $40 – $60 recovering the prior weeks losses. Will we at least see the buying come in even though we didnt Sell off last week? I think it is a good possibility, pushing Gold above that down trend line. I look forward to seeing if that is true next week. 🙂
.
Thank you for being here at Chartfreak with me, and have a great weekend!
.
~ALEX
.
This is a lesson or a story based on a couple of Emails ( questions) that I have received. They are Understandable inquiries, and I hope this helps all to understand a little better the types of movement that you may see in a bullish sector.
.
I want to quickly discuss how markets often move in a normal bullish manner and what it might mean to ‘buy the dip’. Often you will see a strong run higher, but eventually a stock or etf will need to pause and consolidate those gains. It can then become “Buy the Dips” if it continues to act correctly while pulling back, but I am hearing a few things that helps me to see that some may not quite understand ‘Buy the Dip’ under various circumstances. I want to discuss that in the Medical Marijuana Sector ( It applies to all sector though).
During a strong run up higher, many may just want to jump right in after a 1 or 2 day pull back. “I bought the dip”. However, what if that stock doesn’t move higher? Some may then assume that ” I bought a piece of junk, because Other MJ stocks are popping.”
Please allow me to show you another way to look at things. I always try to be patient and wait for the right time to ‘buy that dip’ if a stock that I like ( Like the MJ stocks) have had a massive run higher. I do not just want to jump back in on every 1 or 2 day pull back after an overly extended run. Doing that when a consolidation is due can cause one to stop out repeatedly, get caught un choppy action, or ride a stock down too far. Let’s see this in action…
.
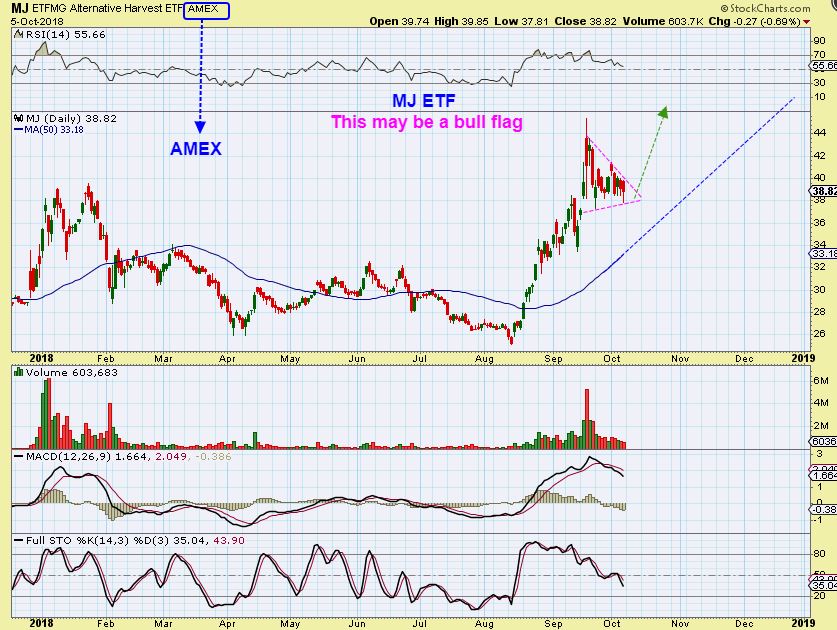
MJ ETF #1 – This is the ETF. This MIGHT be a bull flag, but notice that after it’s strong run, it has gone sideways for 2 weeks actually. Buying the dip after only a 1 or 2 day pullback would have one stopped out or at a loss for weeks now. Is this a piece of Junk now, because it just went sideways? No, this could be a Bull Flag ready to go higher. See this chart and then let’s look at chart #2.
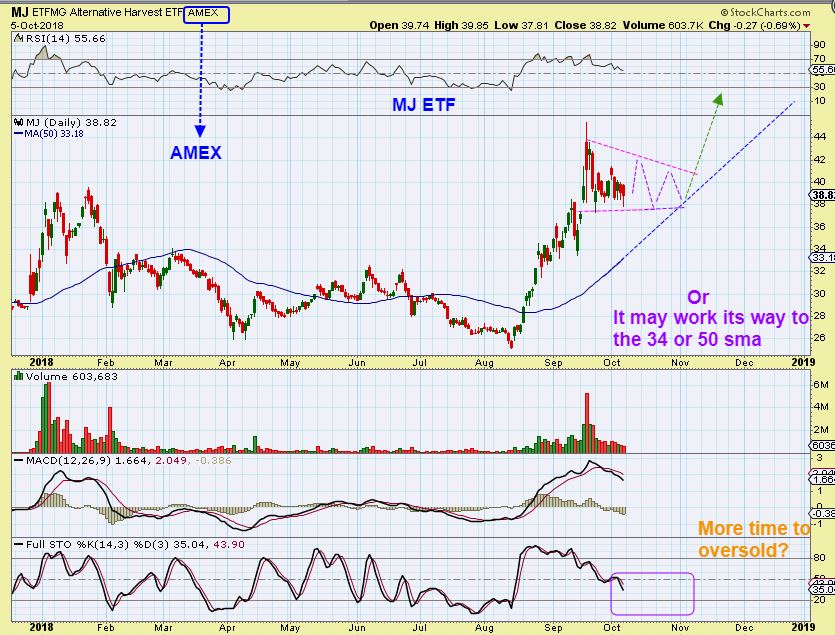
MJ ETF – There is even a possibility that the ETF could do this for a week or 2 more, but why? Because the stocks in that ETF may all have run up strongly too, and need to consolidate further. And notice the 50sma. That & the 34 sma in this sector is a common target. And…
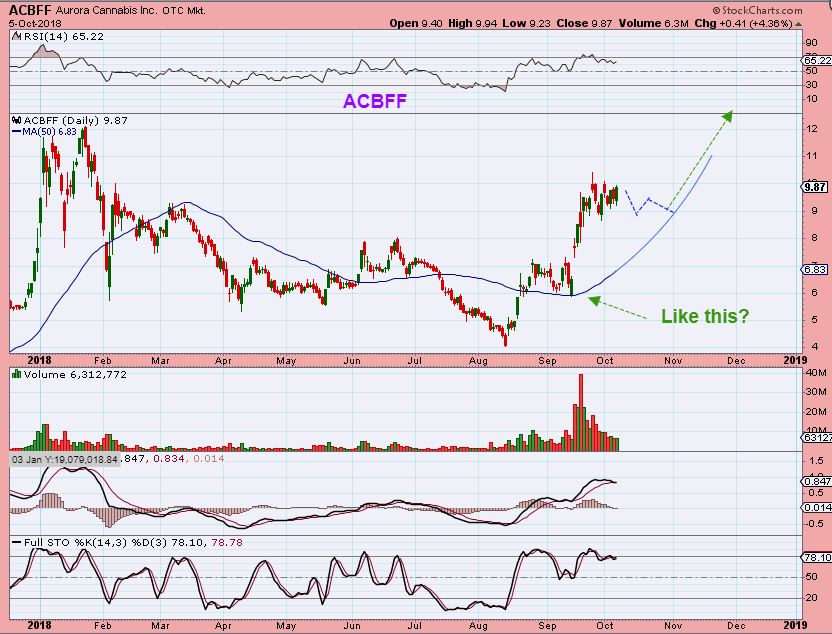
ACBFF -Look at the 1st consolidation of ACBFF in Aug – Sept. It went sideways and then tagged that 50sma. Then it ran strongly again. Buying that first dip after 1 day down after the run to $9 would have put you inside of this current consolidation for 2 weeks so far. That is fine, as long as you have a stop & understand that the stock is not ‘Suddenly a piece of dead junk’, because others are running today. It is still acting bullishly. It COULD break out any day now, but it also may not quite be ready until it gets to the 34 or 50sma. Lets look at a few more charts.
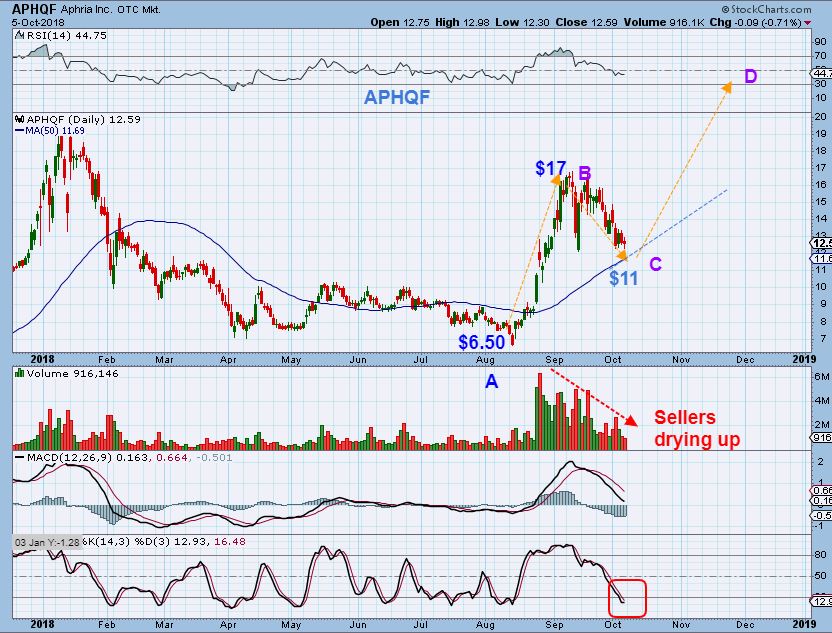
APHQF – After a great run $6.50 to $17, this needed a rest. Someone who jumped in on the first 1 or 2 day drop from $17 bought this at $15 and may now be stopped out 2 or 3 times. They may just this, “This piece of junk now. $17 to $12 is bogus!” , So does this chart look Ugly & Weak to you?…
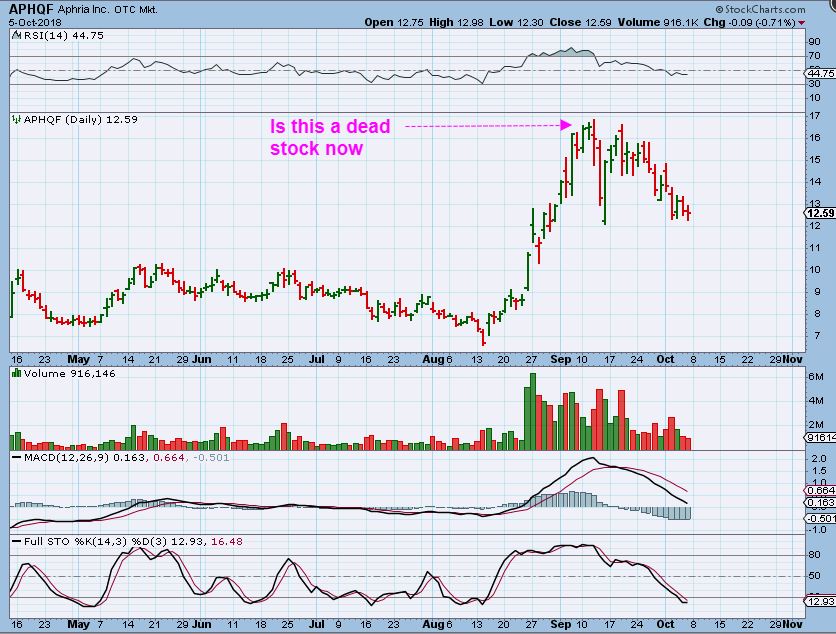
Really, this it is almost a BUY in my book. This is what I like to see.
1. It has recharged and is near a support of the 50sma.
2. Look at the volume.
3. Look at the stochastics. This may be getting ready to do a second $10 higher.
My point is to help some see that “Buy the Dip” may not be just any ole dip on the first day or two down. If a stock has had a massive run, it may need a bit more of a rest, a consolidation. Buy the Dip is often best on one that has pulled back to support. I think here at Chartfreak, we’ve all seen me want to buy a low risk entry when we see a pullback at the 50sma, but also we want to see a reversal takes place & it is even better if it is oversold. So Buy the Dip may take patience. Lets continue…
.
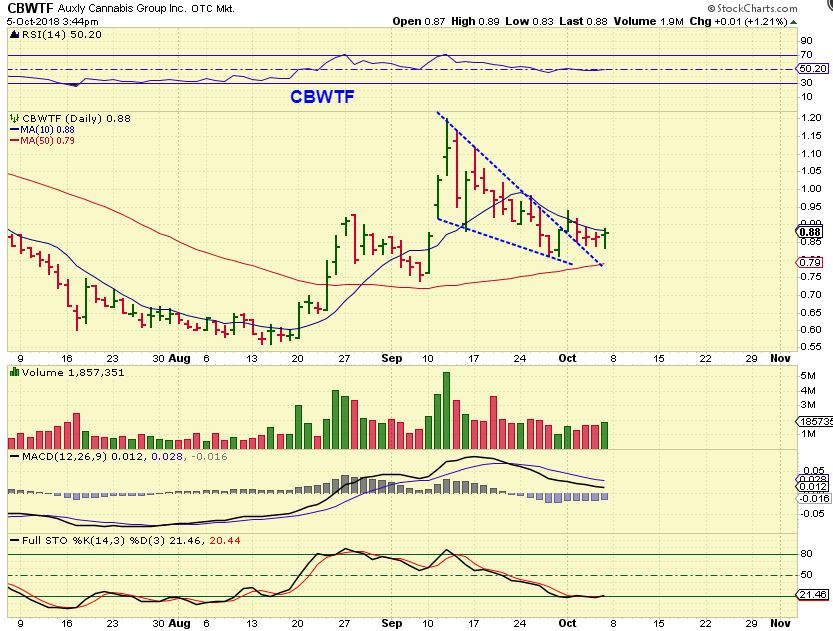
CBWTF – Here we see another consolidation. I bought this recently, breaking from the wedge, but even it still needed more time. I still own it because it hasnt done anything bearish. Think about this: It ran from $0.55 to $1.20 in 1 month!! It rested in between that run too. A sideways move after a nice run, does NOT mean it is a piece of junk, just because ‘Other MJ stocks are popping’. The sector has various stocks or companies taking turns attracting buyers. I see a break out, back test, and it is now oversold. My stop would be a bit below the 50sma
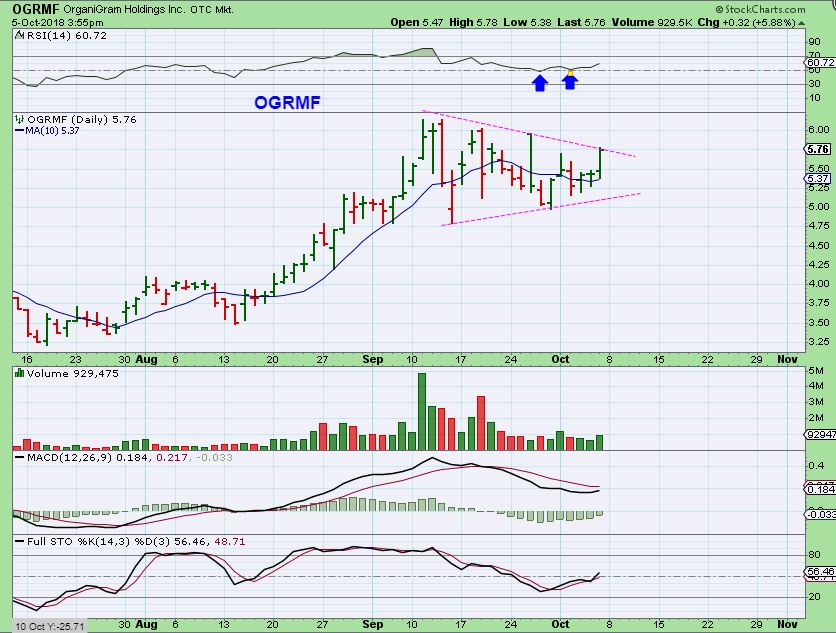
OGRMF- Another consolidation. This may be a buy as soon as Monday
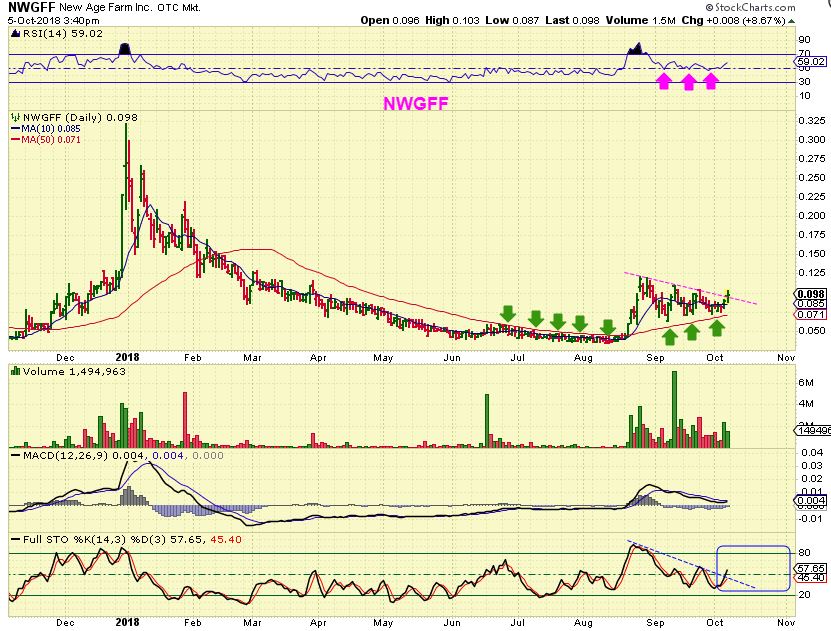
NWGFF- Look at this consolidation after a very strong run out of the base. Is this a piece of junk because it didn’t run last week while others did? Not in my book, I had 6 charts of this alone in Fridays report. 🙂 But some might say…
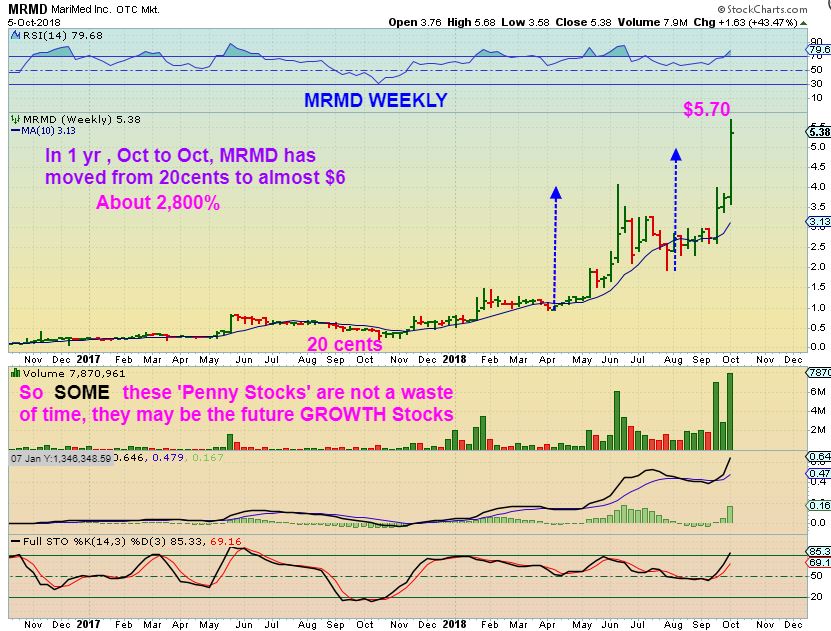
But some might say… “Its just a penny stock”. Can it really remain bullish over time?
.
MRMD GROWTH – $0.20 to $5.70 is about 2800% in 1 year. NOT AN EASY RIDE, but this was ‘Just a penny stock‘ last October. And please note the long sideways consolidations too. It was NOT a piece of junk, just because it went sideways or pulled back for weeks after a good run. 🙂 Read the chart
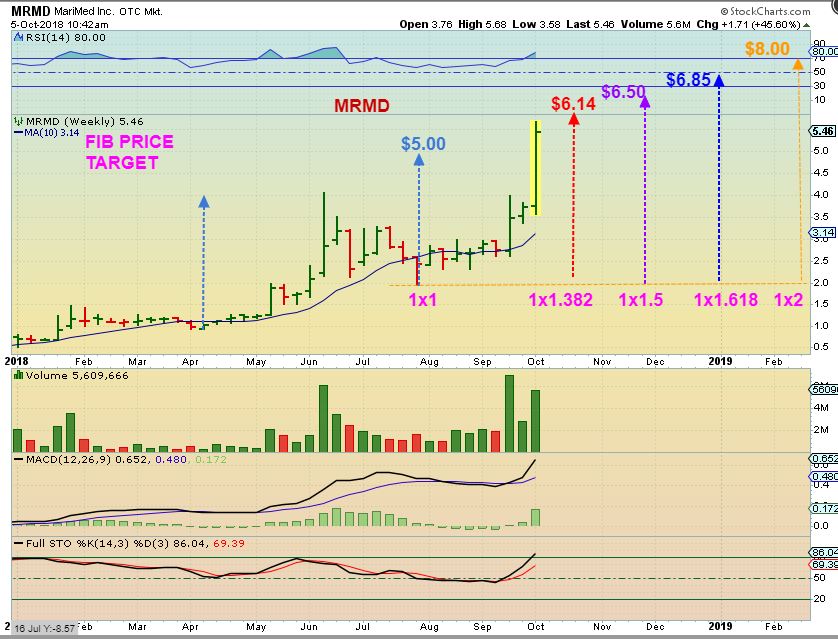
MRMD FIB TARGETS – At 10:42 a.m., I captured the chart to show some price targets. These DO extend, but I sold some Friday as it moved well above $5 just to capture my 100+Gains. We bought this around $2.50 only 2-3 weeks ago and it has more than doubled. I will ride the rest and watch these Fib Targets.
I do hope this story or lesson has helped some to understand the answer to a question that may go something like,
” Why do I always seem to buy a piece of junk? It runs like mad without me, and as soon as I buy the dip, it dies and rots in my account, but others are still running?”
The answer is that consolidations are very normal and even healthy after a very strong run higher. If an MJ stock is up 100% or 200% in a month, I would expect that it is going to pull back & may start a long sideways consolidation phase. As seen in the charts above, NWGFF is consolidating. APHQF is, ACBFF is consolidating.
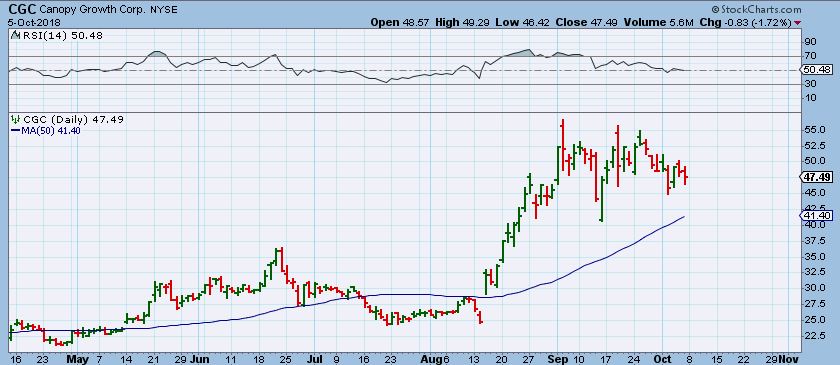
Even CGC is consolidating …
And even PLM ran 100% and is consolidating

