Friday October 5th
It is Friday, the last trading day of the week, so let’s just do a quick review…
.
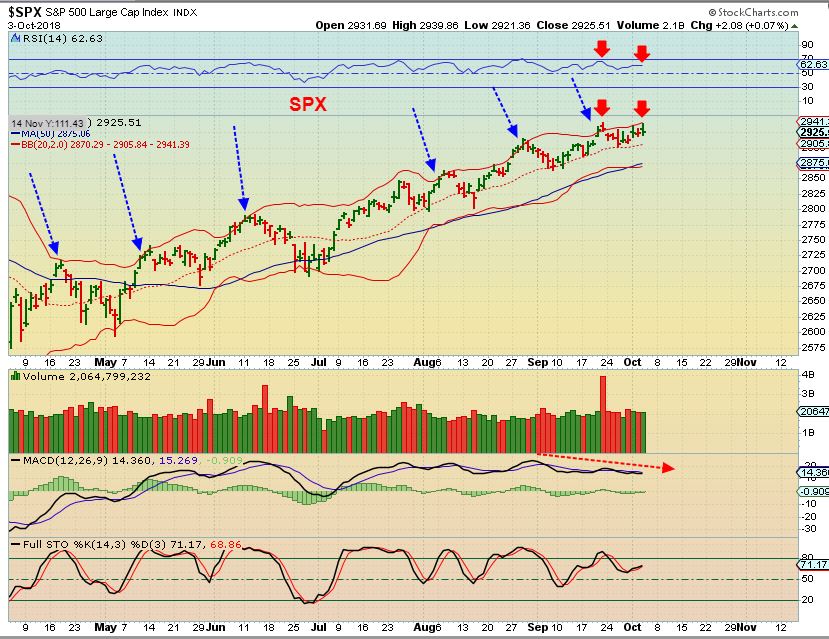
SPX – Yesterday using this chart , I pointed out that the SPX was running up along the top of the B.B. with divergence and due for a daily cycle low. The Markets dropped yesterday.
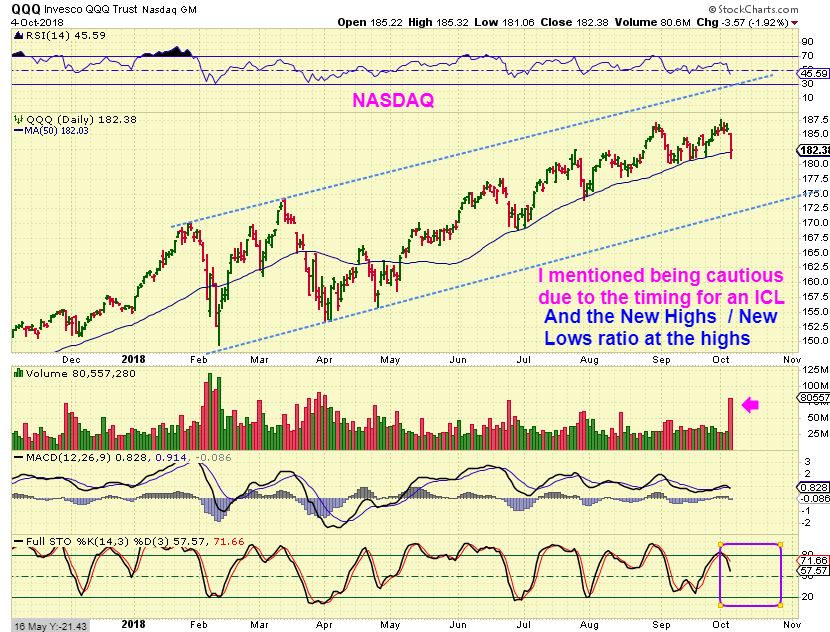
QQQ – The Markets began to sell off . We Also discussed that the General Markets were showing divergence in the RSI & MACD, Due for a dip cycle-wise, and showing a much higher number of new lows than new highs at the top here. A dip is due and seems to be starting here…
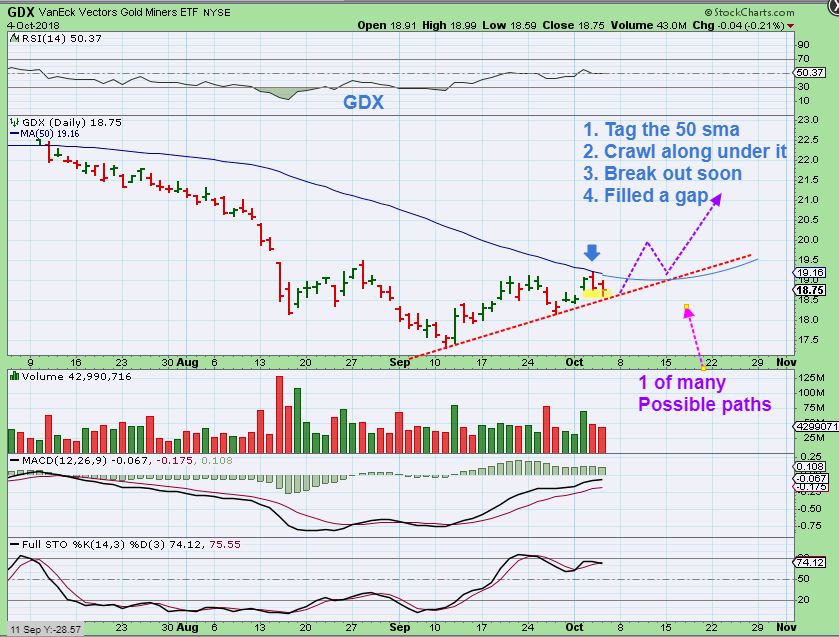
GOLD IS CRAWLING ALONG THE 50 SMA, AND STILL LOOKS FINE.
.
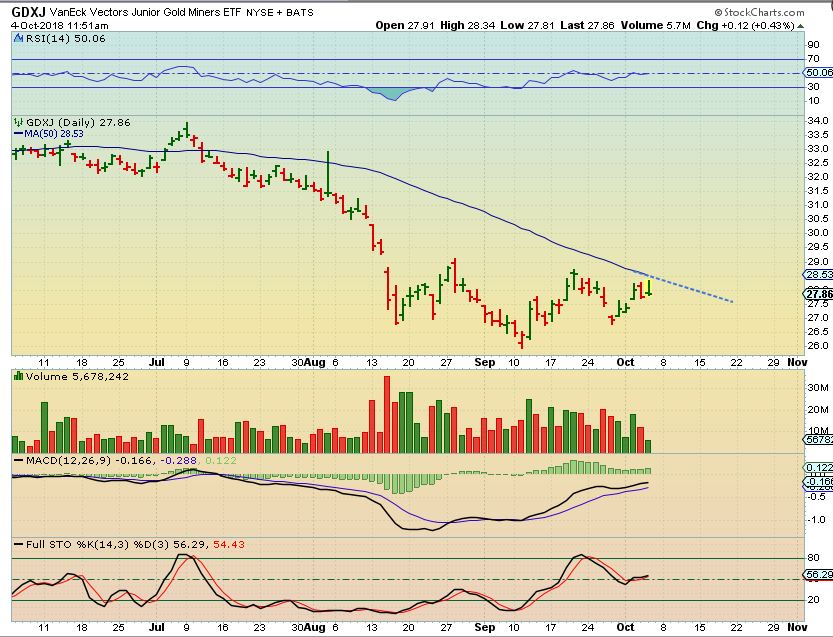
GDX – Sometimes a stock or ETF Price will break right through the 50sma, and at other times price crawls along under the 50sma to build steam for that break out. This week GDX & GDXJ tagged the 50sma area and stalled so far. It MIGHT break out and back test on a dcl, or it may crawl under the 50sma and try to break out on the next daily cycle.
GDXJ – Same as above, this could be ready to break out or it could stall, but the Miners still look like inverse H&S Patterns and as I have pointed out, several individual Miners are already above their 50sma and look bullish
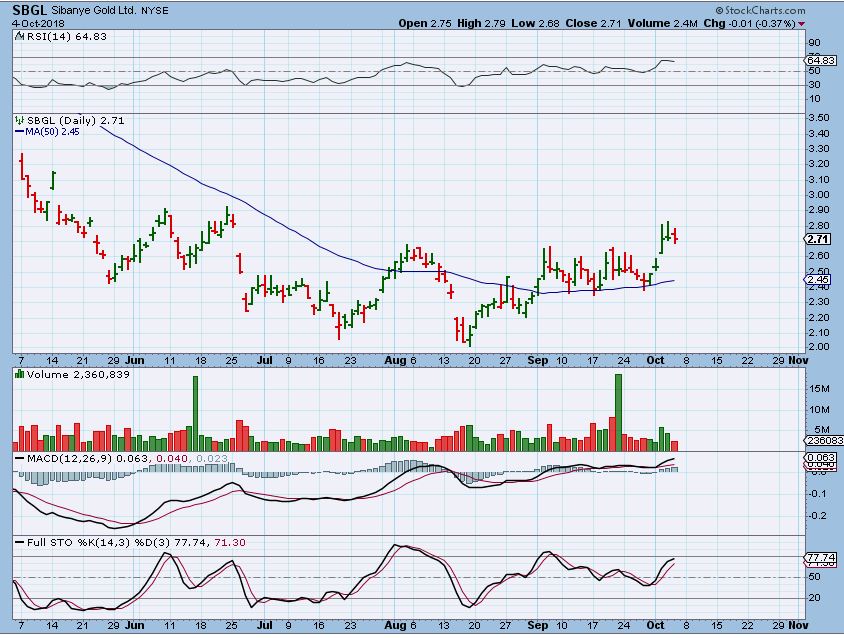
SBGL- An example of a Miner leading the way higher. This gives confidence that GDXJ will break above that 50sma too.
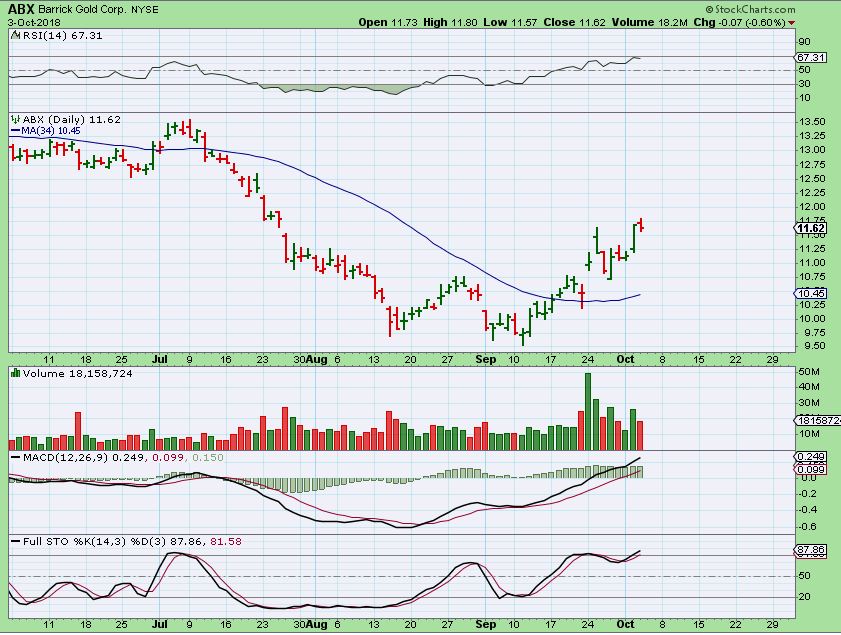
ABX– ABX is well above the 50sma too, confidence for GDX.
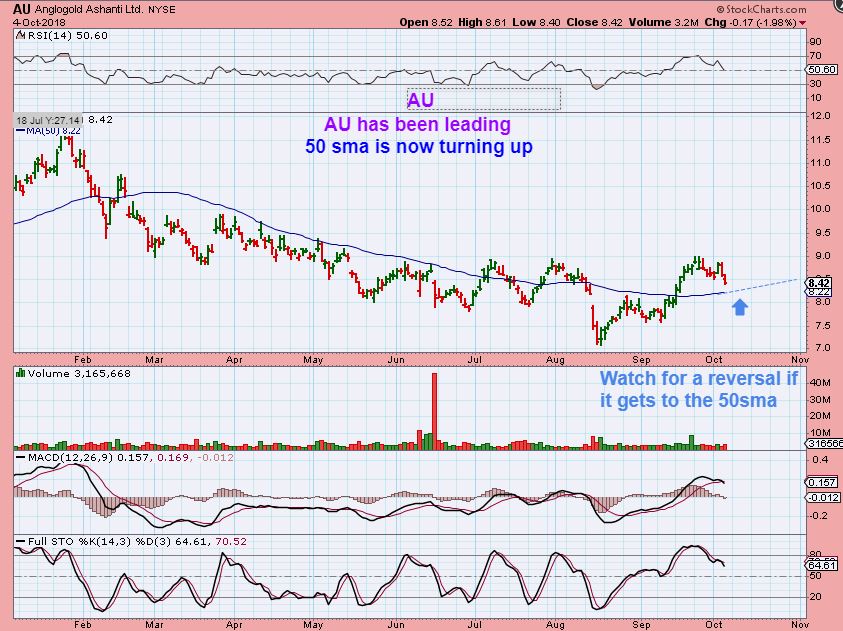
AU– AU broke above the 50 sma and may do a back test & Reversal to offer a low risk entry. Put this on your watch list or buy it here with a stop under the 50sma ( loosely).
So going into the weekend, the things that I have discussed in prior reports still seem to be playing out well. I will discuss the BIG PICTURE VIEW in the weekend report.
.
Enjoy your Friday trading!
.
~ALEX
.
TRADE REVIEWS
.
MRMD – This was recommended as a buy at the 50sma in September, and I posted this yesterday as a 2nd buy opportunity. A rising flat wedge ( Or large Cup & Handle).
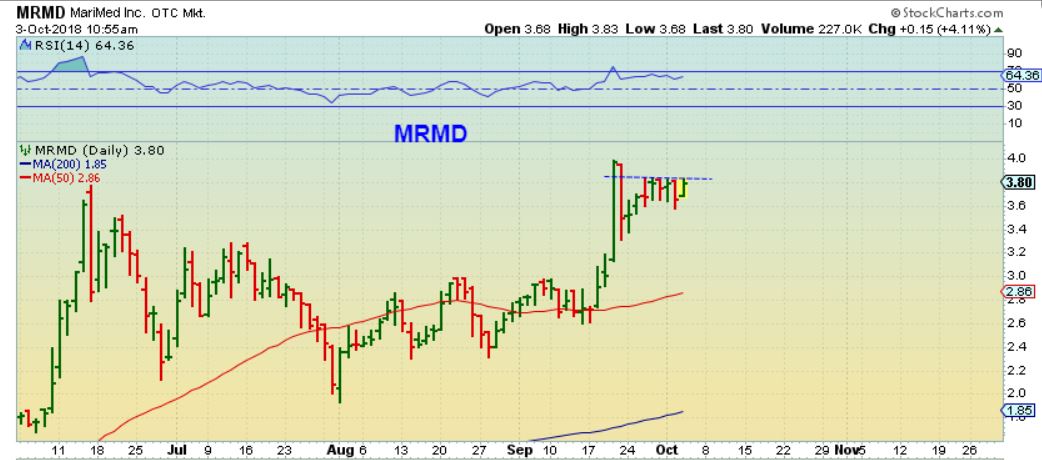
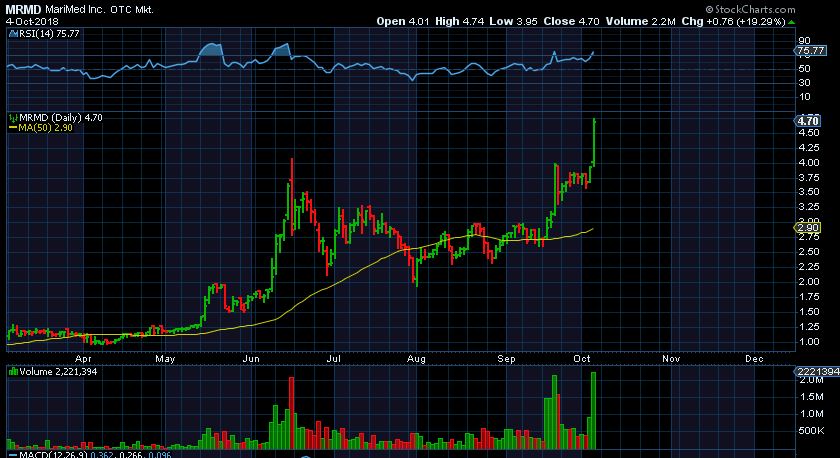
MRMD – We had nice follow through and this chart shows it up 20% yesterday alone. MRMD has been a great trade from $2.60 ish to $4.70 . I had a $5 target for an initial drive.
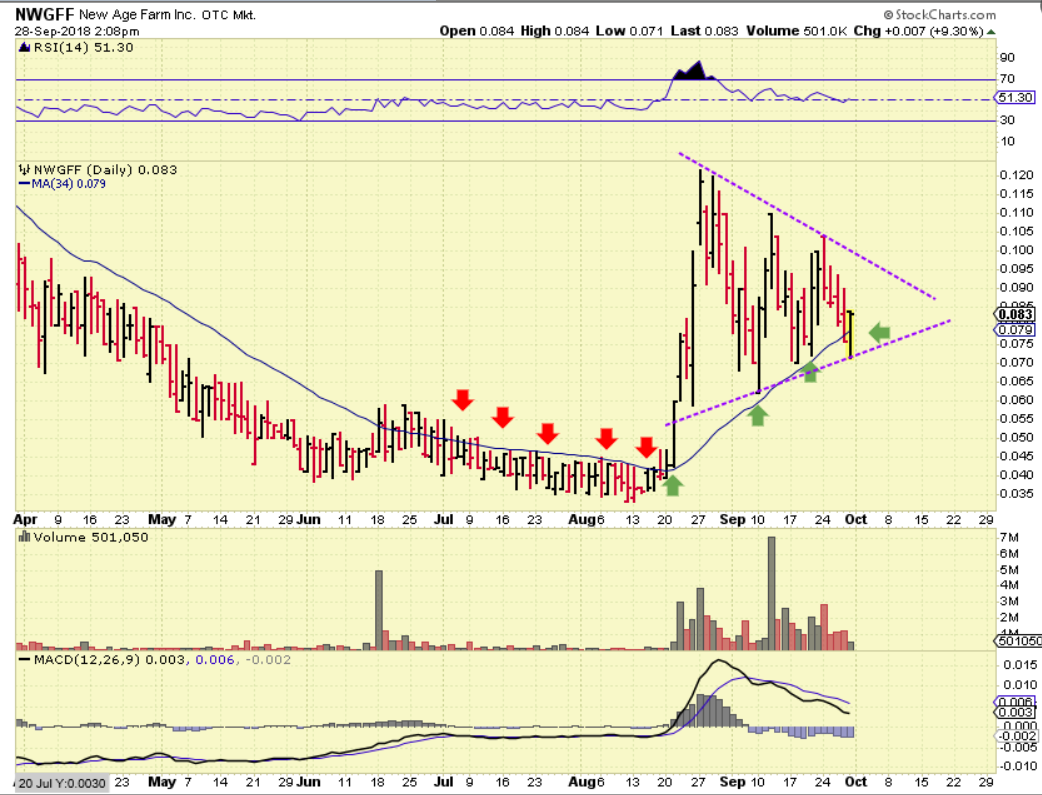
NWGFF – On Sept 20th, I posted this long term chart of a medical Marijuana chart forming a triangle consolidation. It needed a little more time to complete the APEX. It is low price and OTC, so this may not be for everyone, but I do own it.
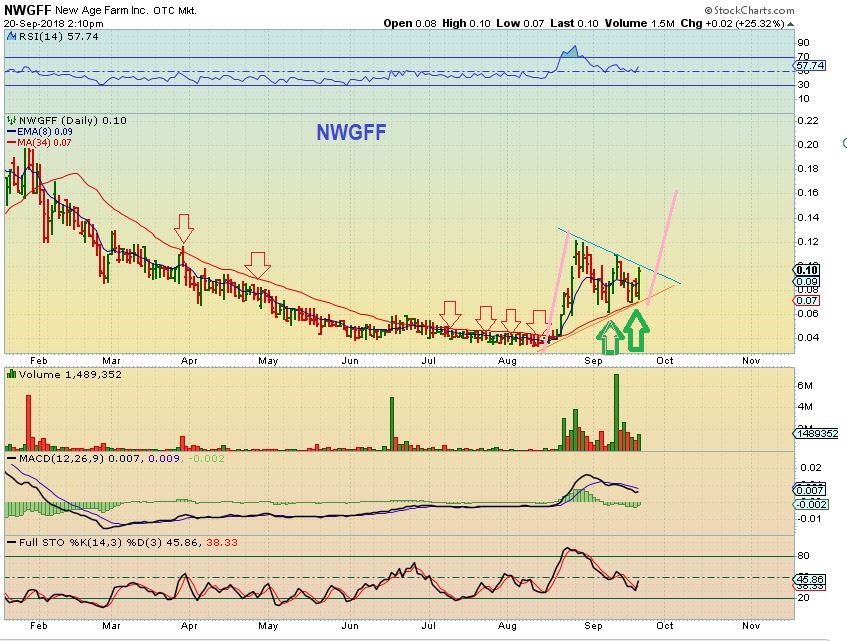
NWGFF – And notice how it was repeatedly rejected at the 34 sma, and then popped above it. It now rides on top of it, and the 34 sma can be viewed as support.
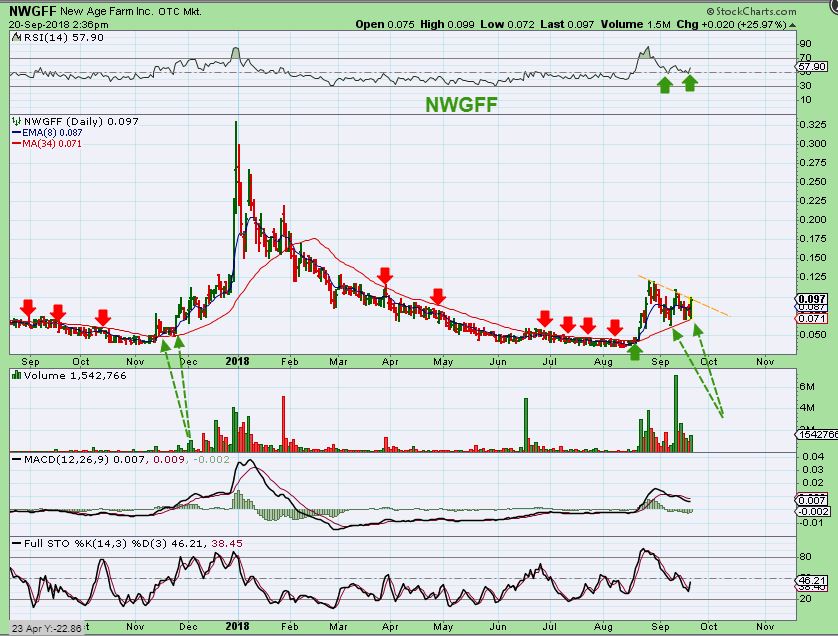
NWGFF – September 28 – This was a reminder that it was now at the lows and pulled a reversal at the 34 sma after a false break down, but I mentioned that this triangle needs more time to fill the apex.
NWGFF – I think we are now there. I drew this Thursday morning & Posted it in the comments section , and…
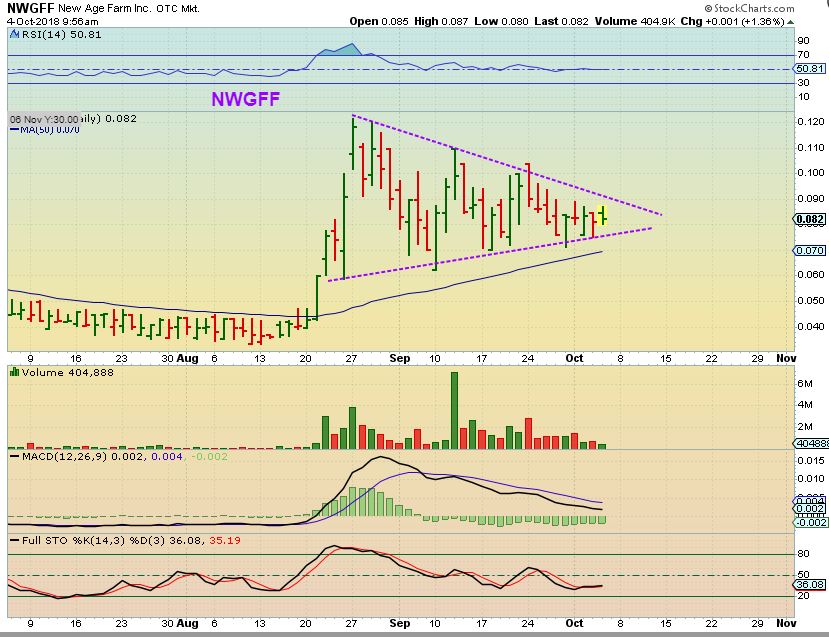
NWGFF – It popped 11% right away. I think we are now ready to go. The Volume increased into the close, price ran toward the top of the triangle, the APEX looks complete. Again, NWGFF is a penny stock, an OTC stop, and not for everyone, BUT this is also an 8 cent stock that could run to 16 cents (100%). It already ran from 3 cents to 12 cents ( 300%).
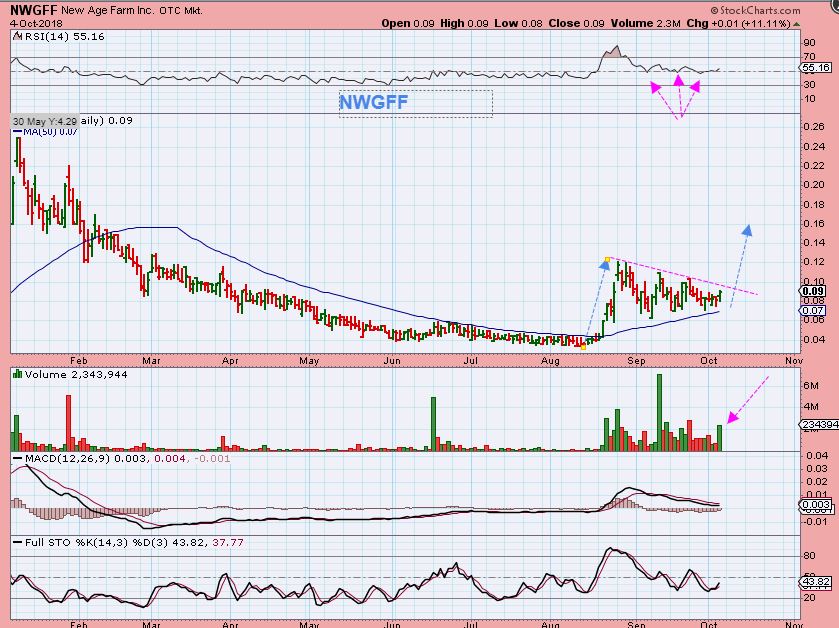
As I have said it the past, THESE MJ STOCK ARE GREAT TRADES, BUT THEY SHOULD NOT BE VIEWED AS EASY ‘GET RICH QUICK’ trades with no risk. They move quickly higher, or they can crash down 20% in a day. Be reasonable in position size, enter & Trade at your own risk. 🙂
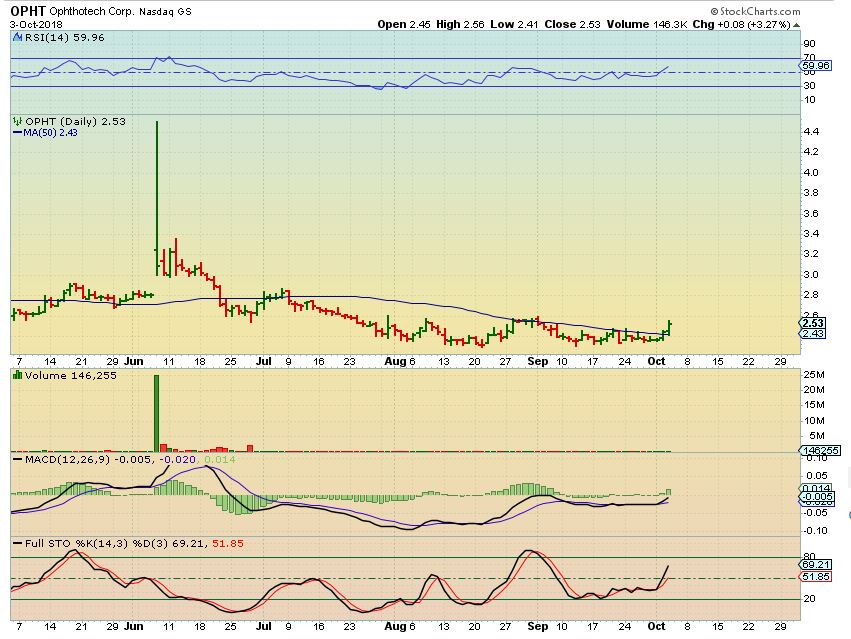
OPHT– I like this set up, you know by now how much I love these long bases if they continue to form constructively. I posted this in the comments yesterday. It actually dipped down toward the 50 sma yesterday, so one could watch for a reversal and see if that 50sma acts as support. Buying a reversal here allows you to put your stop under the 50sma ( or recent base lows).
Also for recent trades – I pointed out many Uranium stocks & shippers that were bullishly following through. Let’s do a quick review of just a couple of these, but you want to see charts of SB, SBLK, FRO, TOPP, DCIX, TNK, NAT, etc . The sector is bullish, and Pull backs can be bought.
.
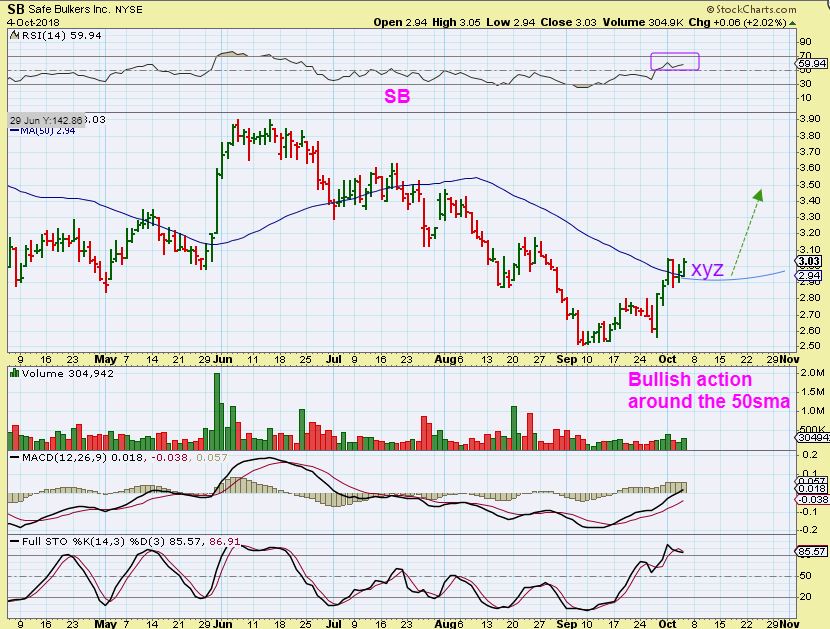
SB – A break above the 50sma was bullish and..
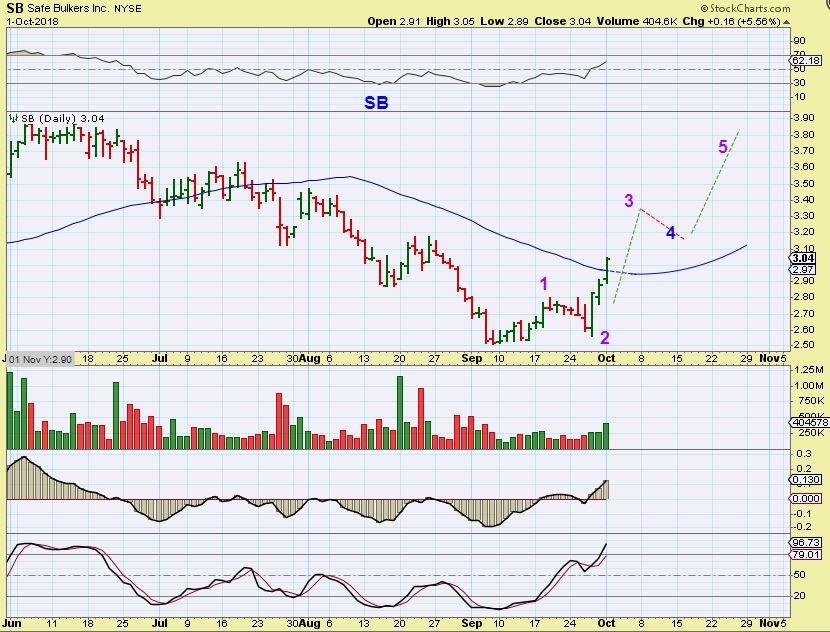
SB – It is crawling along that 50sma. It is a low risk entry in my opinion, with a semi tight stop (Maybe $2.80).
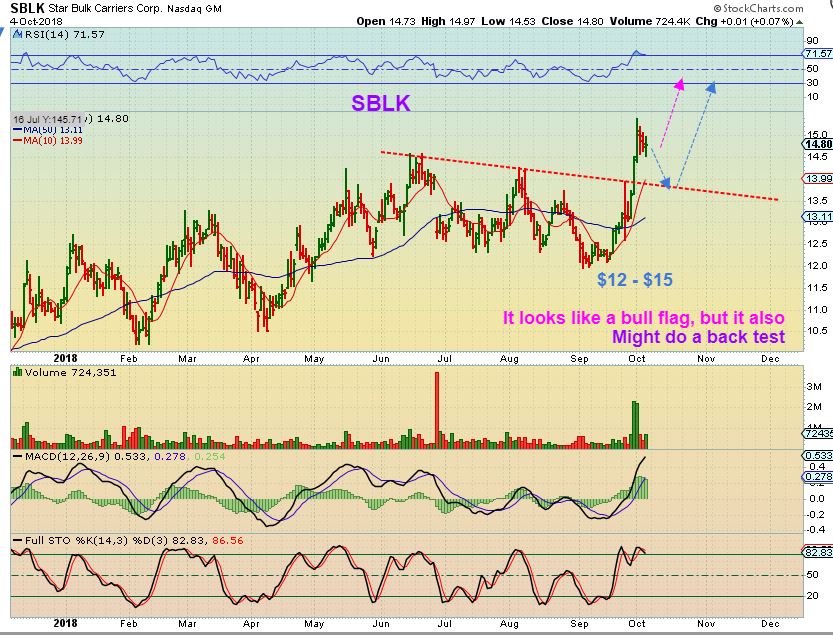
SBLK OCT 1 – A long base ( it has done reverse splits) with a lot of potential.
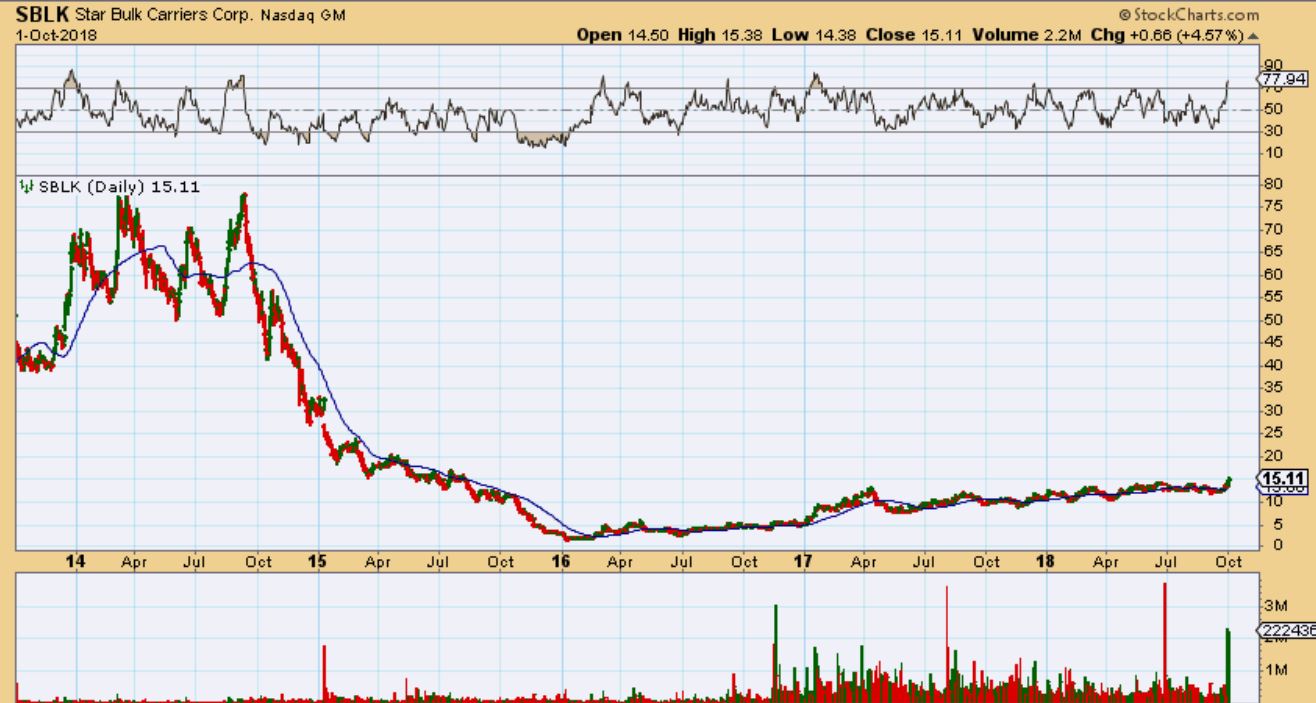
SBLK Oct 1 – I mentioned that SBLK is extended and may need a rest or pull back, put it on a watch list, it may offer a lower risk buy later.
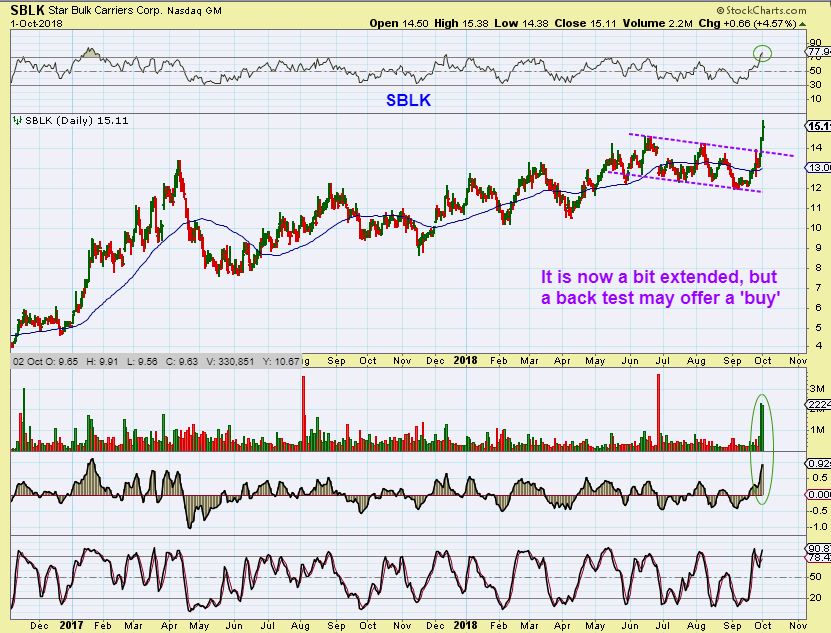
SBLK – So it may be forming a bull flag here, but if it drops to support, it could also offer a nice entry. Keep it on the watch list.
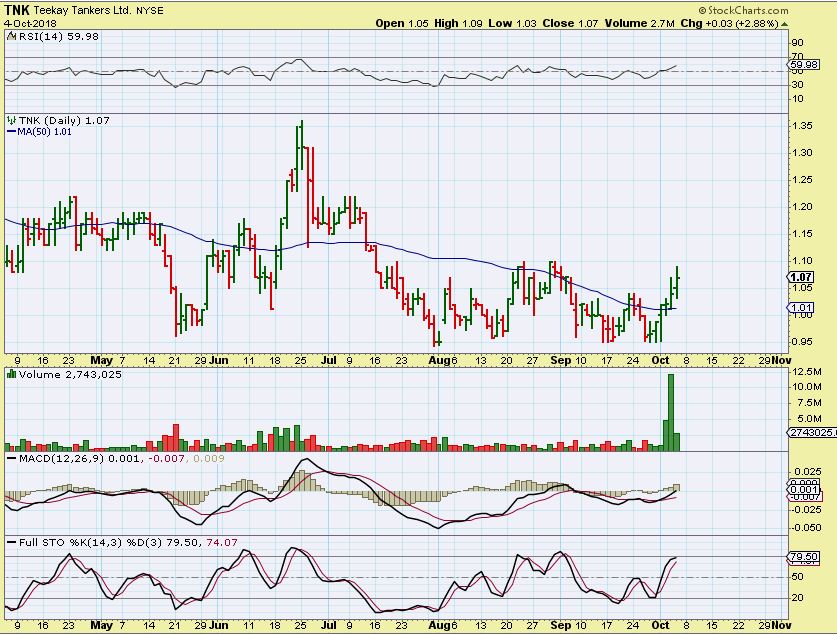
TNK OCT 3 -This was a low risk buy, breaking from a base with strong volume pouring in.
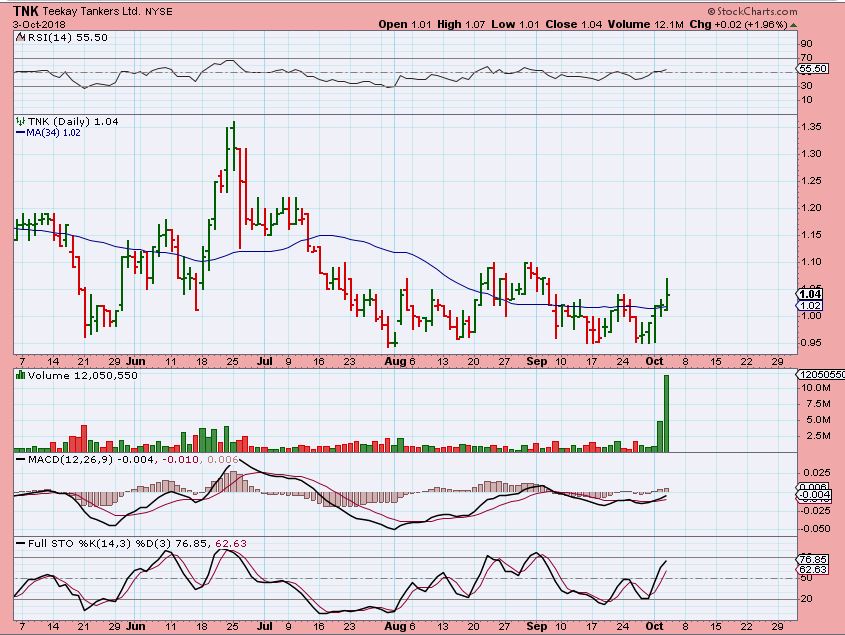
TNK – Yesterday it continued higher and can still be considered a buy.
.
The following series of charts are a few ( of many) of the recent ones that I used to show that UUUU is a buy…
.
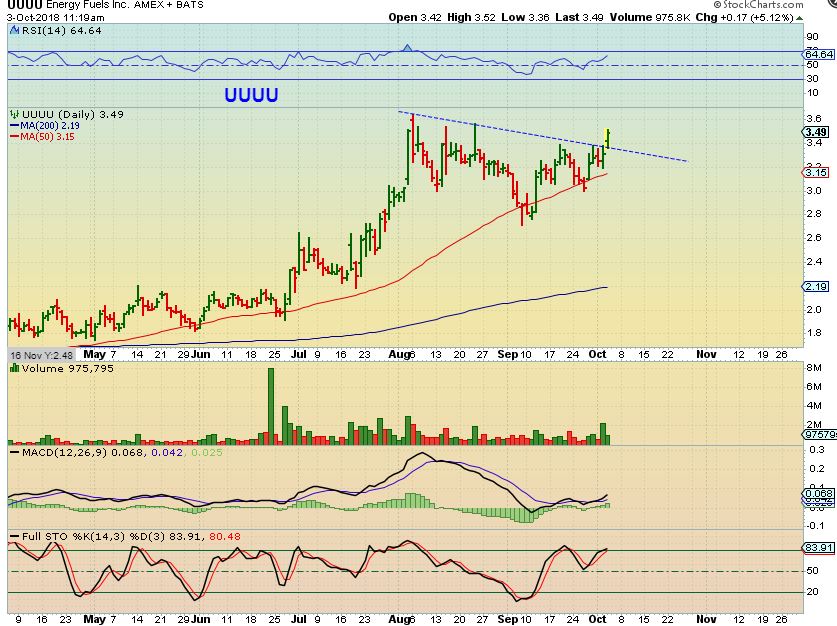
UUUU – This is a long bullish base with plenty of upside potential. I love the potential here if this sector remains Bullish.
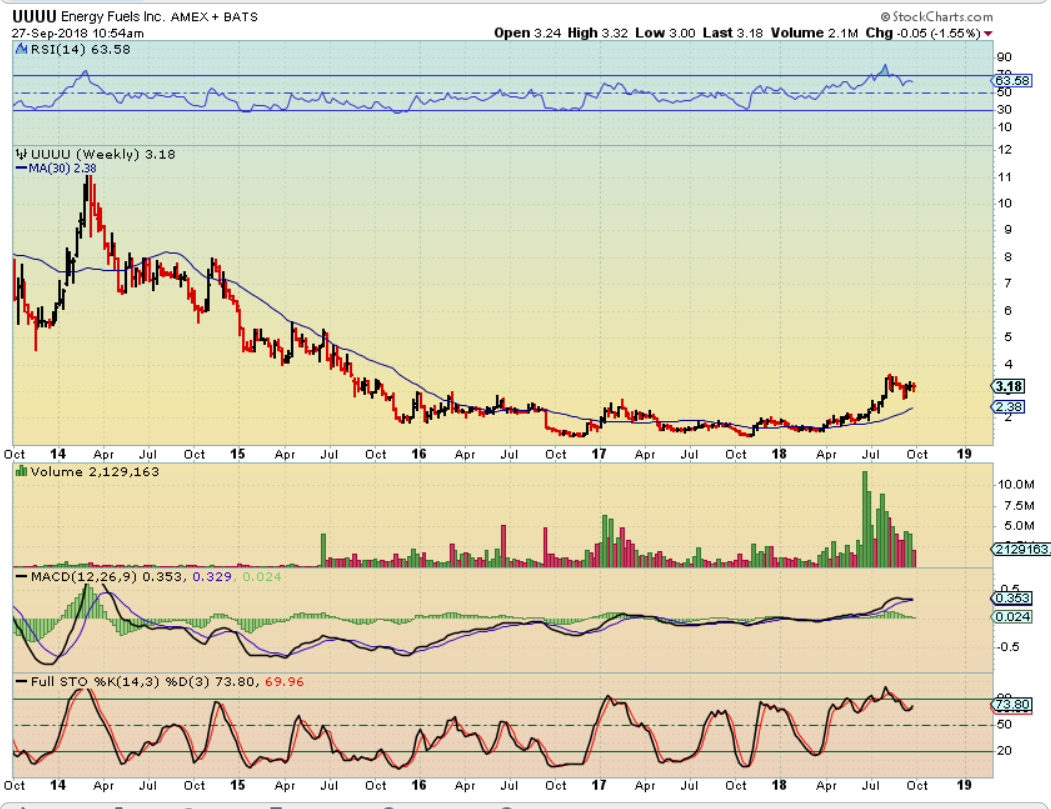
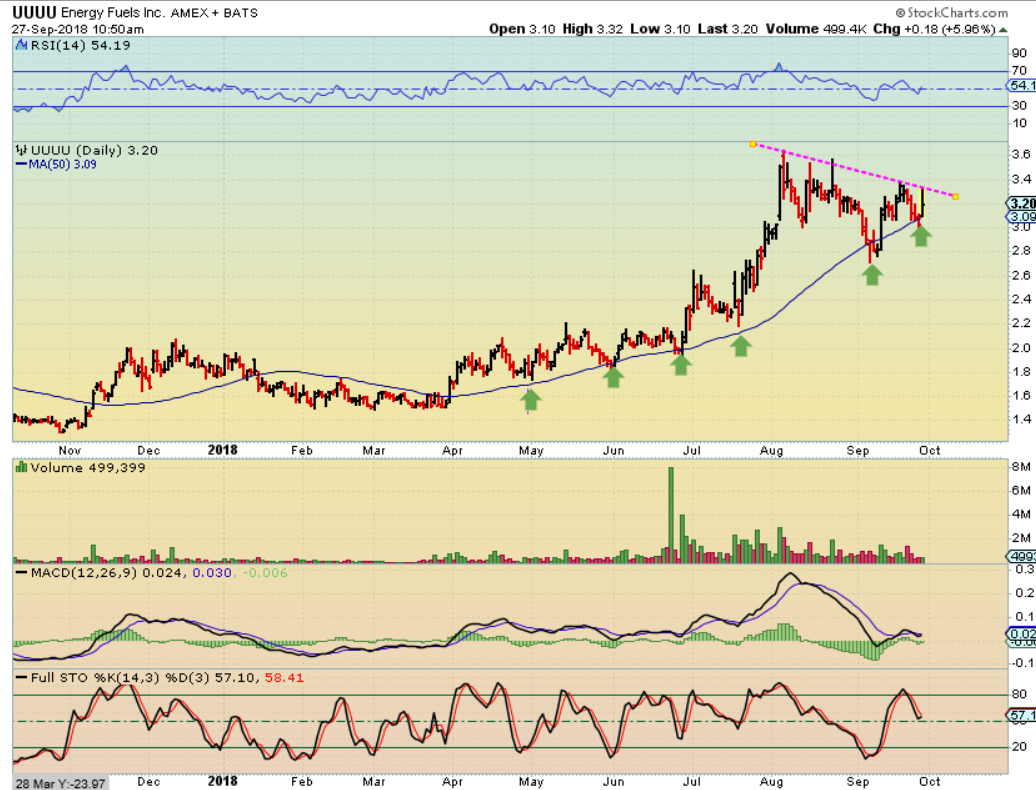
UUUU – It has been reliable buy along the 50sma, so I recommended buying it here again on Sept 27 at the 50sma
UUUU – It is consolidating those recent gains, but broke out- this confirmation was a good place to ‘add ‘ to current positions or even start a position.
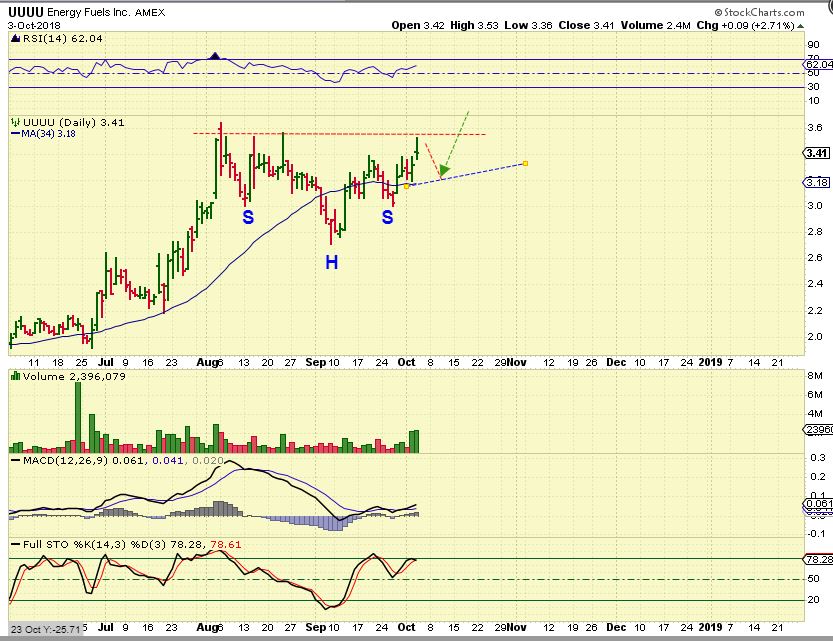
UUUU – I mentioned that we may need to be patient, it could continue to stall under resistance, even tagging that 50sma again. It is still bullish.
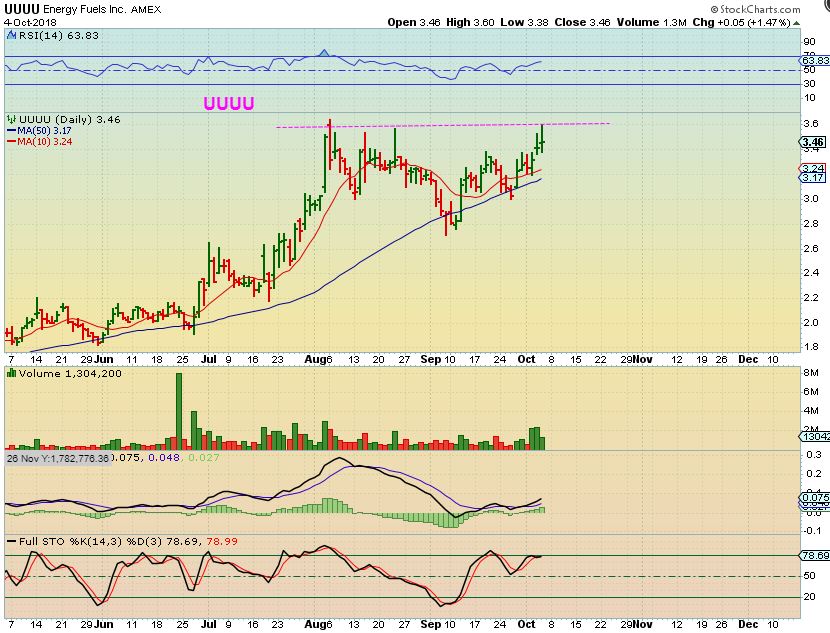
UUUU – Another day of stalling, it is still acting correctly, be patient if you own it. If you dont, it really isn’t too late ( Though it MIGHT drop to the 50sma again).
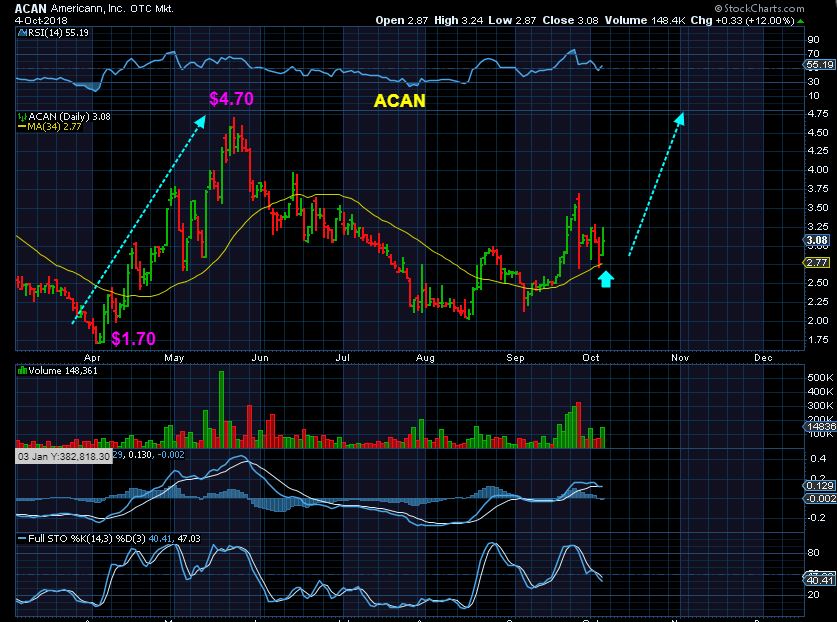
I bought ACAN as a trade yesterday, I like the way it has found support at the 34 sma and reversed higher. Now I’ll wait for follow through, it may or may not quite be ready to run. The last run from $1.70 – $4.70 was almost 200% gains, but it was choppy and hard to hold.