September 1st weekend report
Please allow me to mention again that the weekend reports are BIG PICTURE VIEWS. They are mostly weekly charts and therefore their view can often take a bit more time to play out. In the daily reports, market action is quicker, so Daily Reports are more or less tailored to current market action, and are a bit more trade-able.
.
I have been saying that we have mixed markets for a while, and now you will really see what I mean. I want to start with the daily chart for the SPX, and then visit the weekly charts of the General Markets.
.
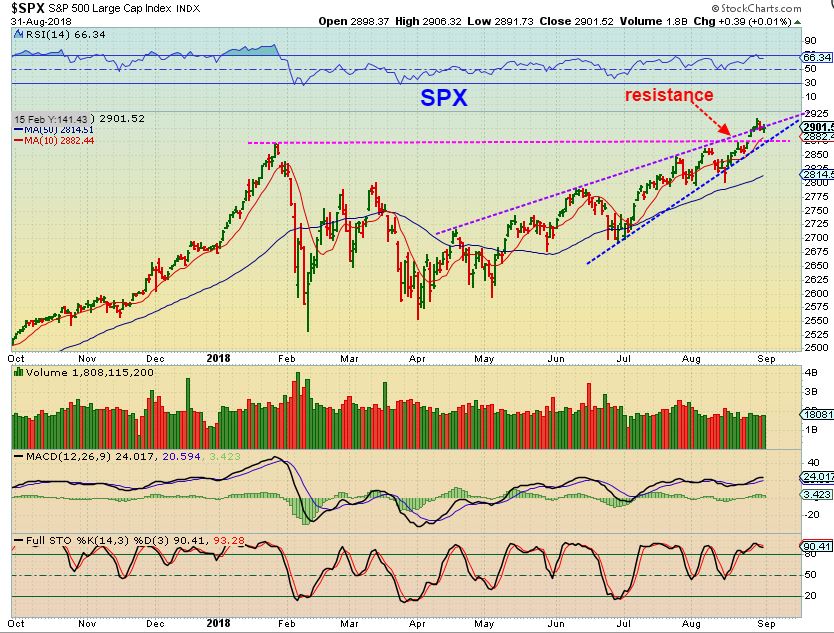
SPX DAILY: I have been posting 2 resistance lines. The Magenta Line: One at all time highs of Jan, and also (Purple) a rising trend line that looks to be a bearish rising wedge. This area is also in a place where ‘time’ is coming due for an ICL ( The last was in Feb), so I expected that resistance could lead to a deeper pull back. The SPX did pause there, but broke higher after a small pull back. Now to the weekly chart..
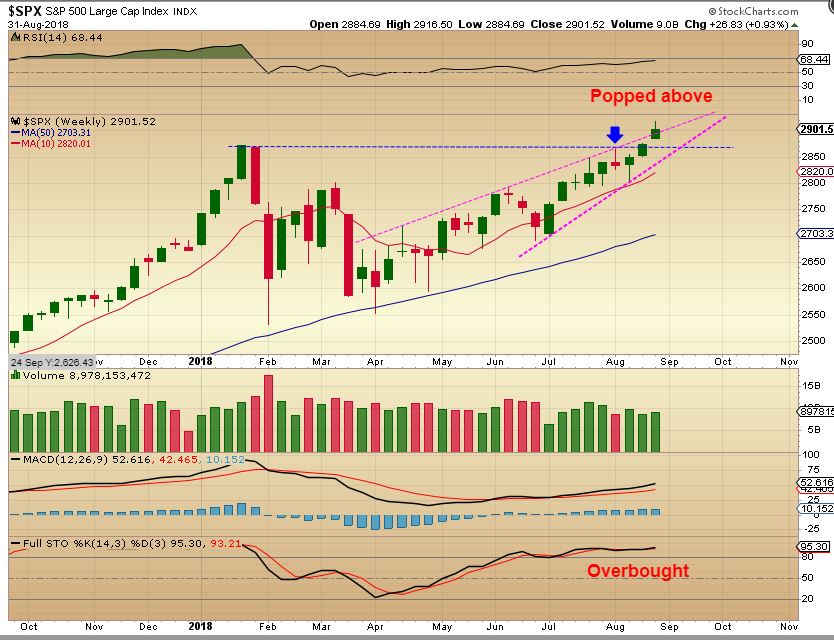
SPX WEEKLY – Possible spinning top candle ( again). As mentioned, this area is also in a place where we are due for an ICL, so I expected 2 resistance lines to lead to a deeper pull back. Last week the SPX gapped higher. Is this a false break out or real? It looks bullish, but it is also overbought and we have a gapped up reversal candle.
NOTE: If this gaps down Tuesday, it could be a topping candle on a weekly basis.
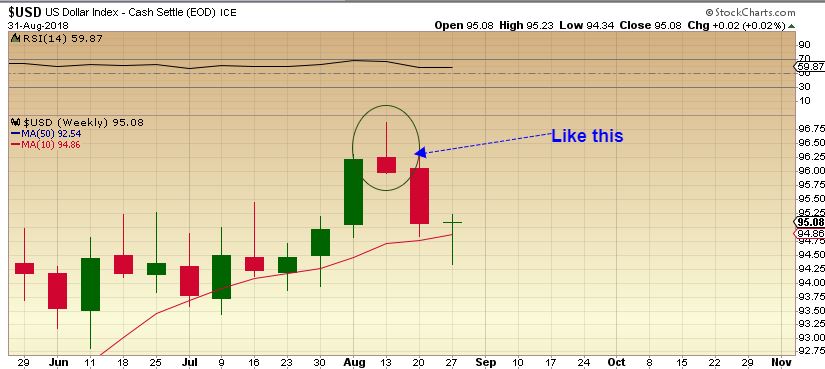
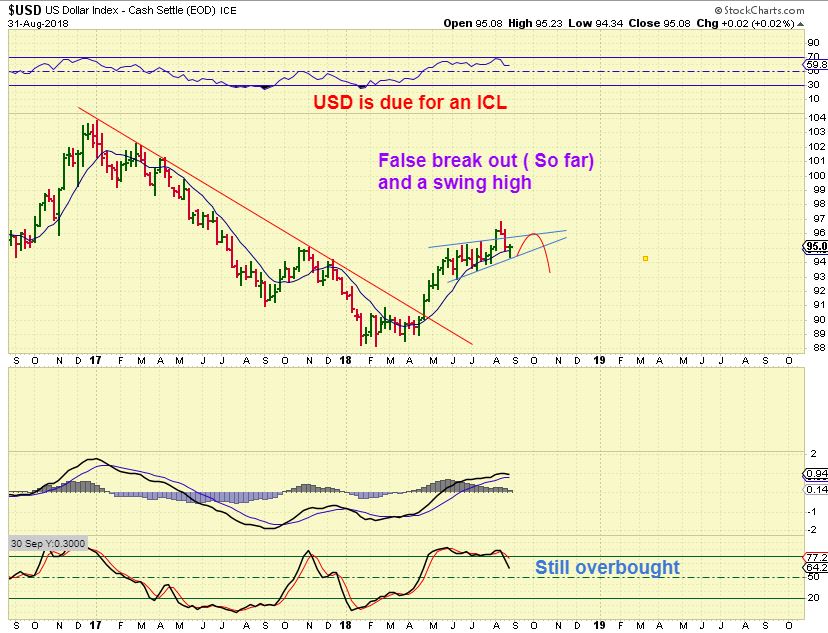
EXAMPLE: THE USD WEEKLY SPINNING TOP – TOPPED WITH THAT CANDLE
SPX WEEKLY – I pointed out the ICLs in a prior report, and showed that 2017 did not seem to have normal visible ICLs. That bothered me, so I wanted to look at this closer.
When I did, I noticed that the brief sideways dips in 2017 that broke the 10ma DO SHOW UP on the stochastics as mid point drops. See the chart, so they should be visible. Continued…
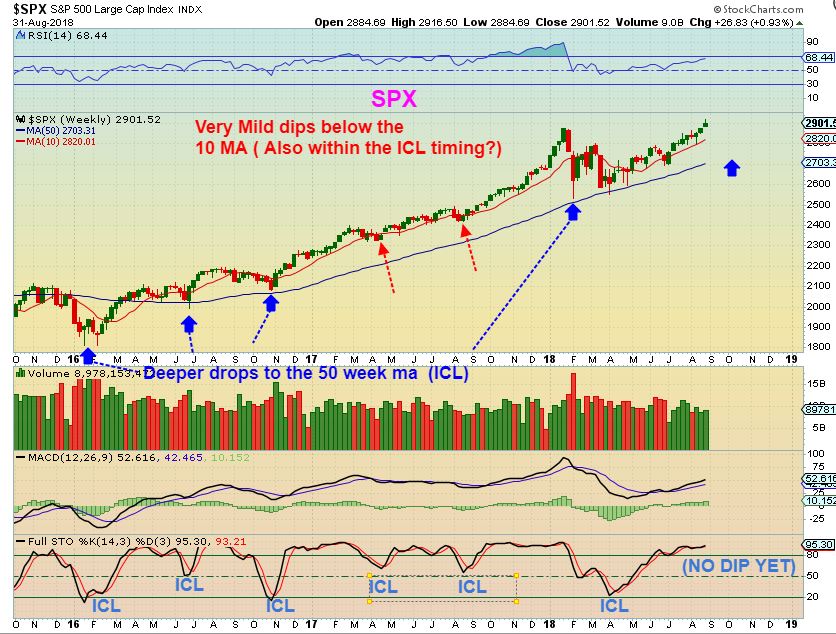
SPX WEEKLY – …same chart Continued. So
1. Every time an ICL came due, we DID at least see a dip in the stochastics on the SPX WEEKLY
2. We haven’t seen one here yet
3. We ought to conclude that we are still due for that ICL.
4. I have to expect a pullback, but if you are long, you can still use that trailing stop ( We’ve discussed TQQQ, TNA, Etc).
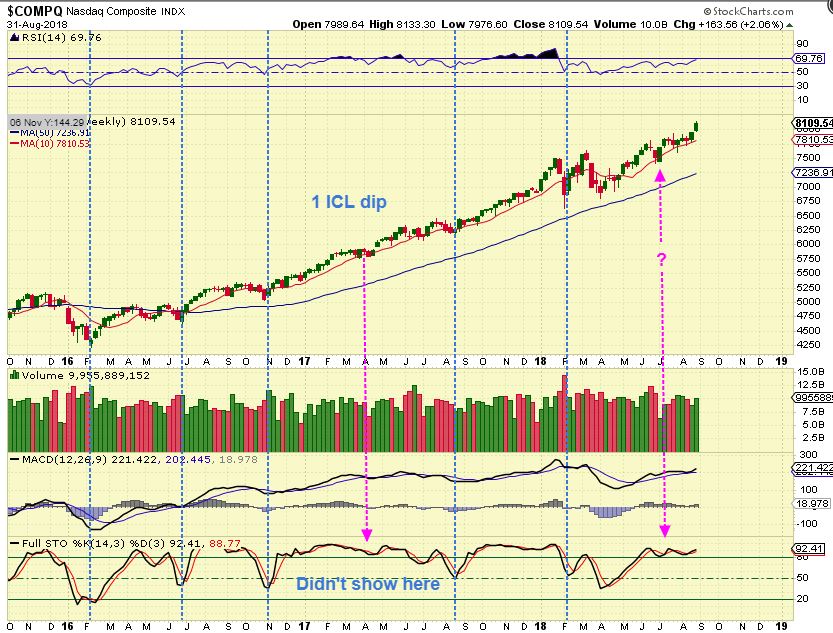
NASDAQ – Notice how the Tech Sector looks a bit different. The NASDAQ actually broke to new highs as early as MAY & JUNE and then dropped in down in July. Then it continued higher. These market sectors have been mixed for quite a while, and the NASDAQ closed a bit stronger last week too. So we have somewhat mixed markets, and…
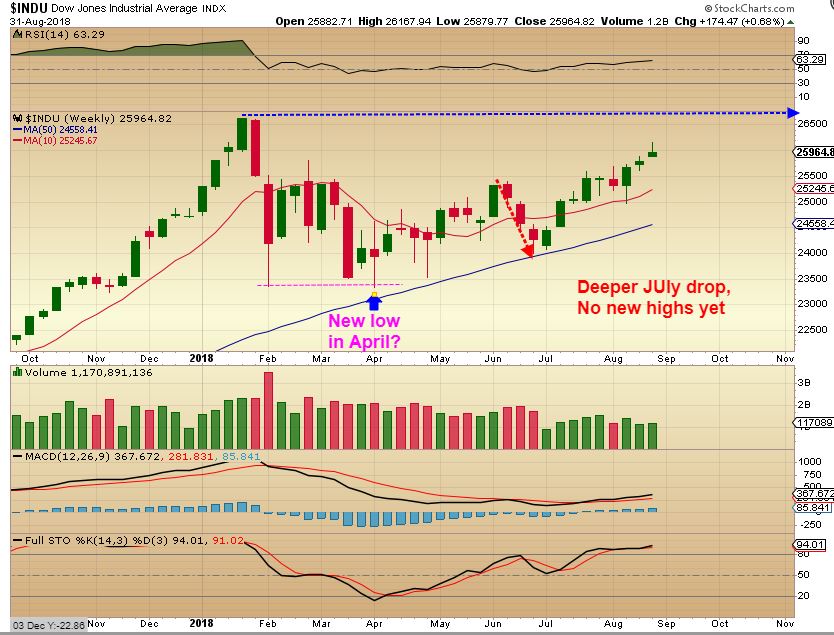
DJIA WEEKLY – What a difference here.
1. The Dow has not even made new highs yet.
2. It had a deeper drop in April to the point that it broke Feb lows ever so briefly.
3. It had a steep drop in July.
4. It also has a bit of a spinning top candle last week, so could pull back from here.
.
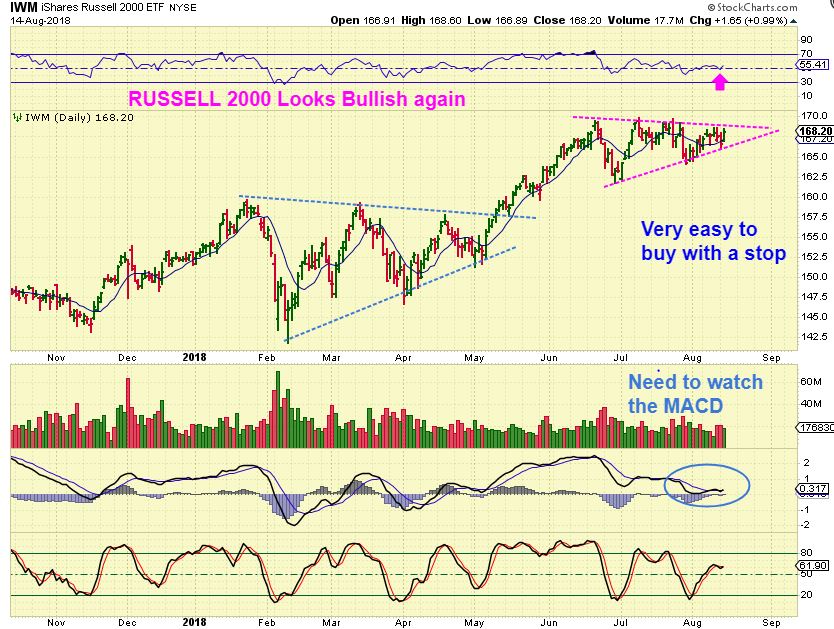
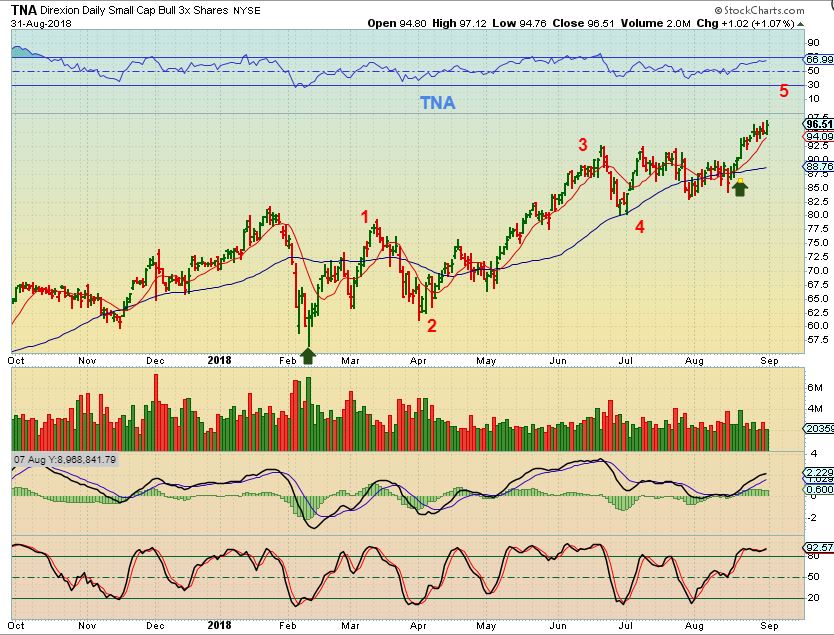
And then we have the RUT ( IWM, TNA) Set up. It has been very bullish, and was set up as a low risk buy with a stop again recently, as shown here.
,
TNA – Since the FEB ICL, it may actually have put in a 1-2-3-4-5 move, with the 5 peak currently unknown.
Price reversed higher off of the 10sma Friday, so my stop would rise below there being cautiously optimistic that this could even push higher. We do not know where ‘5’ will end, but the other sectors still look due for an ICL type drop at any time.
.
A TRADE IN LABU WAS MENTIONED
.
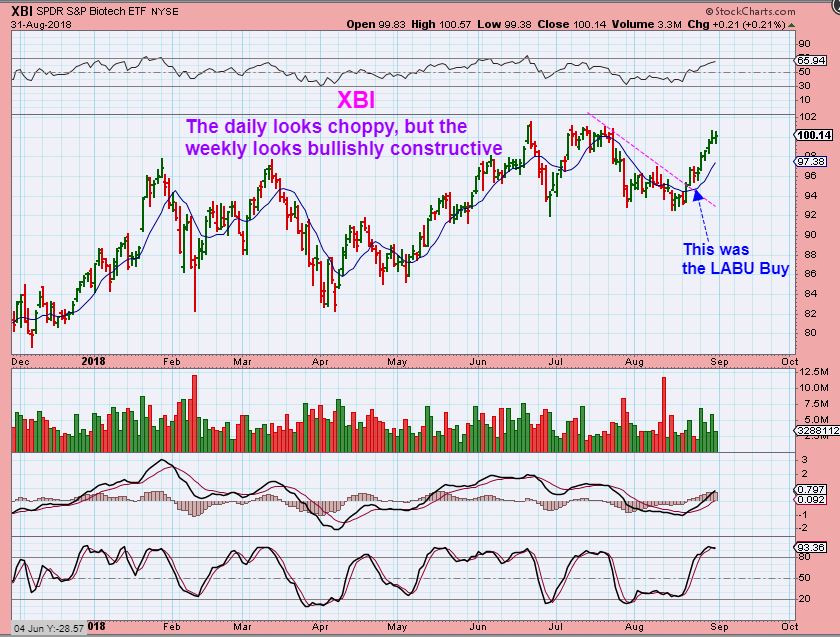
XBI DAILY – LABU seems to follow XBI, so I have been using this. The break out has been straight up. This looks good…
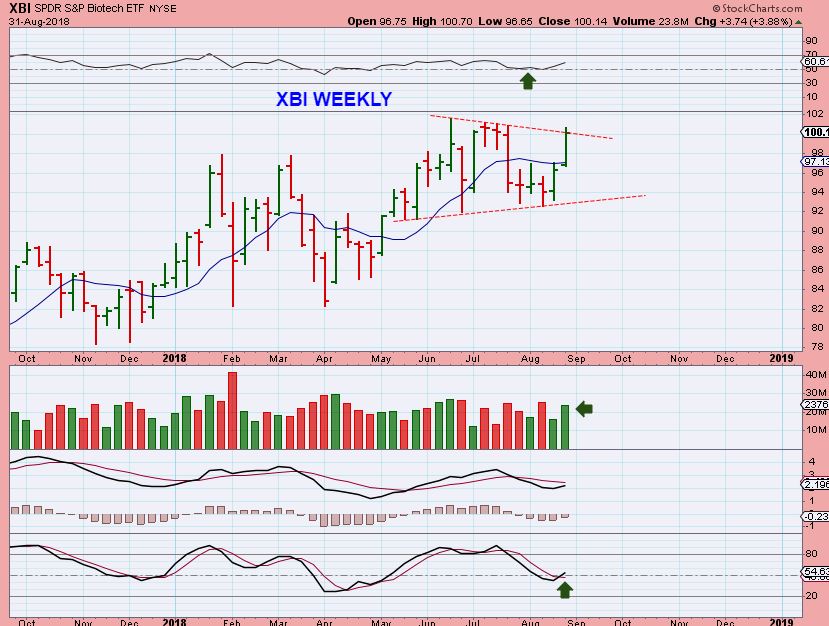
XBI WEEKLY – And this looks like it wants to break out higher, to new highs. If LABU is based on this, this looks very good…
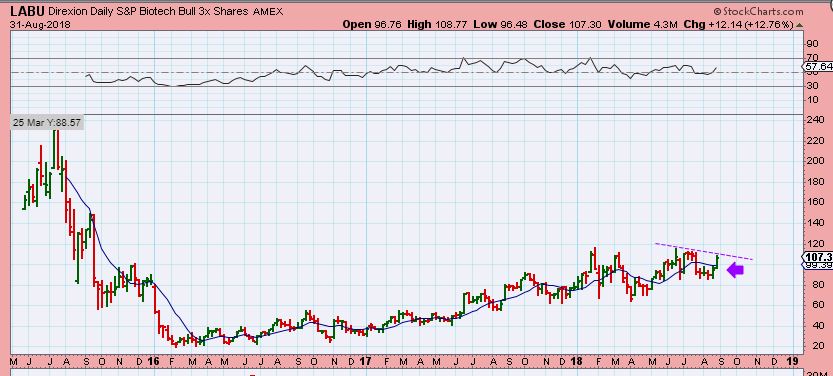
LABU WEEKLY – AND LABU should break out too. My only concern…
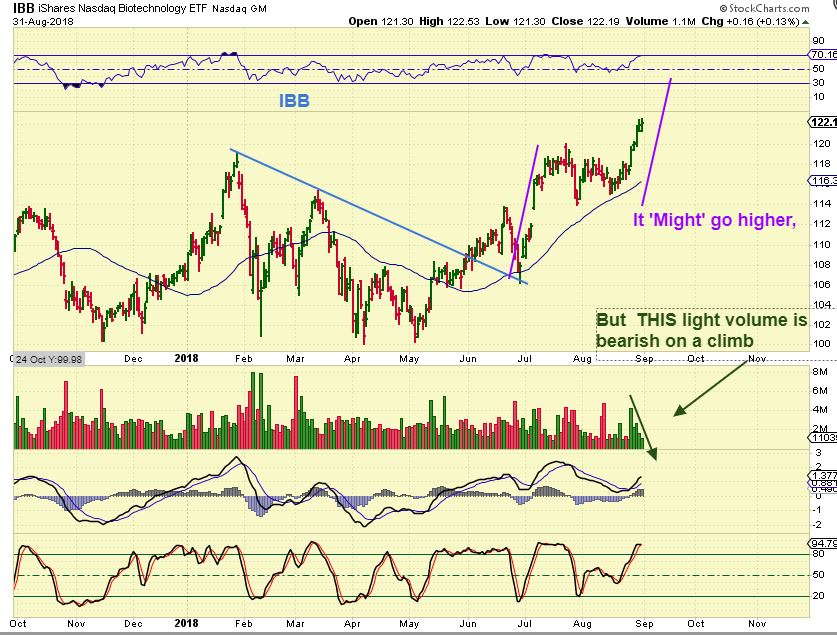
IBB – Slightly conflicting view. IBB broke to new highs and has been very bullish too. It even still has a higher price target from here, but when I see volume do this on a climb? To me it is running out of buyers and in danger of rolling over. Look at the volume on the March rally, for example. This volume drop concerns me a bit. XBI & LABU look as though they want to break to new highs, but IBB is tired. Maybe they just pause or get choppy first?
.
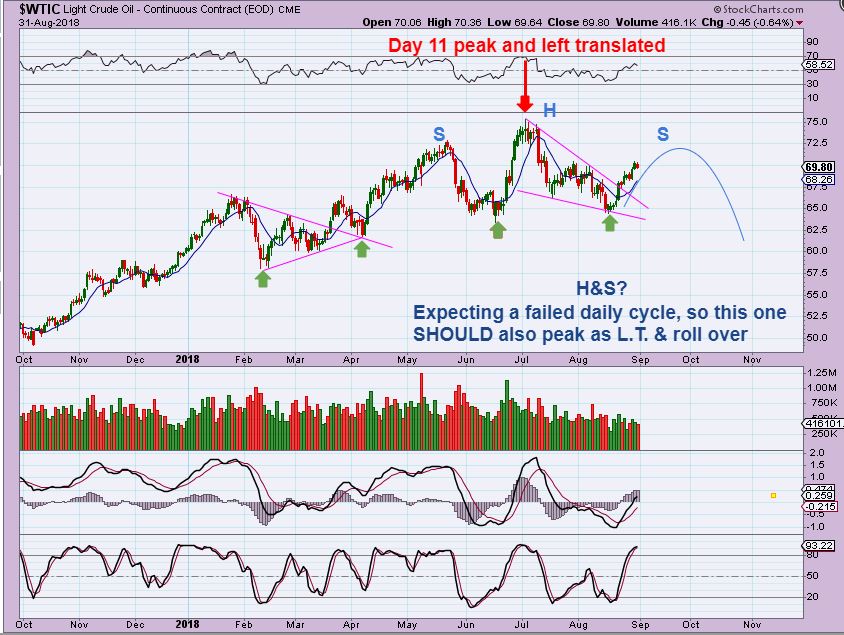
WTIC DAILY – Oil should form as L.T. ( the daily cycles can be long though), and roll over. I can picture a H&S possibly forming. The last daily cycle rocketed higher- but peaked on day 11 & dropped for weeks as L.T.
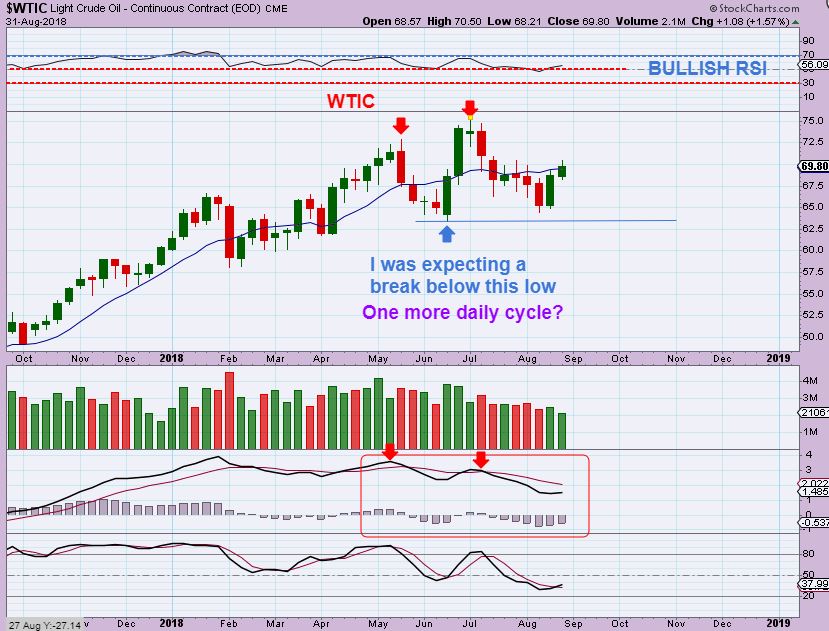
WTIC WEEKLY – Oil is not oversold, another daily cycle could break below that low that I was expecting to break, in an ICL drop.
USD DAILY – Was that 1-2-3-4-5? This looks bullish, butthe MACD doesn’t. Also…
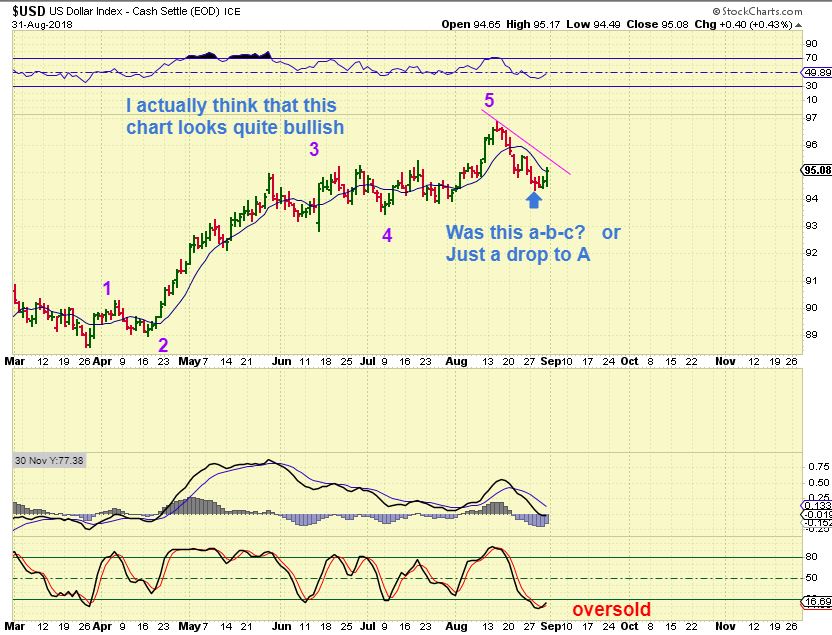
USD – USD Sentiment was extremely bullish at the top (5), and it started to drop into a dcl. This looks like a dcl, and Sentiment is now fairly normal, so this can bounce, but it should form as L.T.
USD WEEKLY- We may see something like this.
.
PRECIOUS METALS:
.
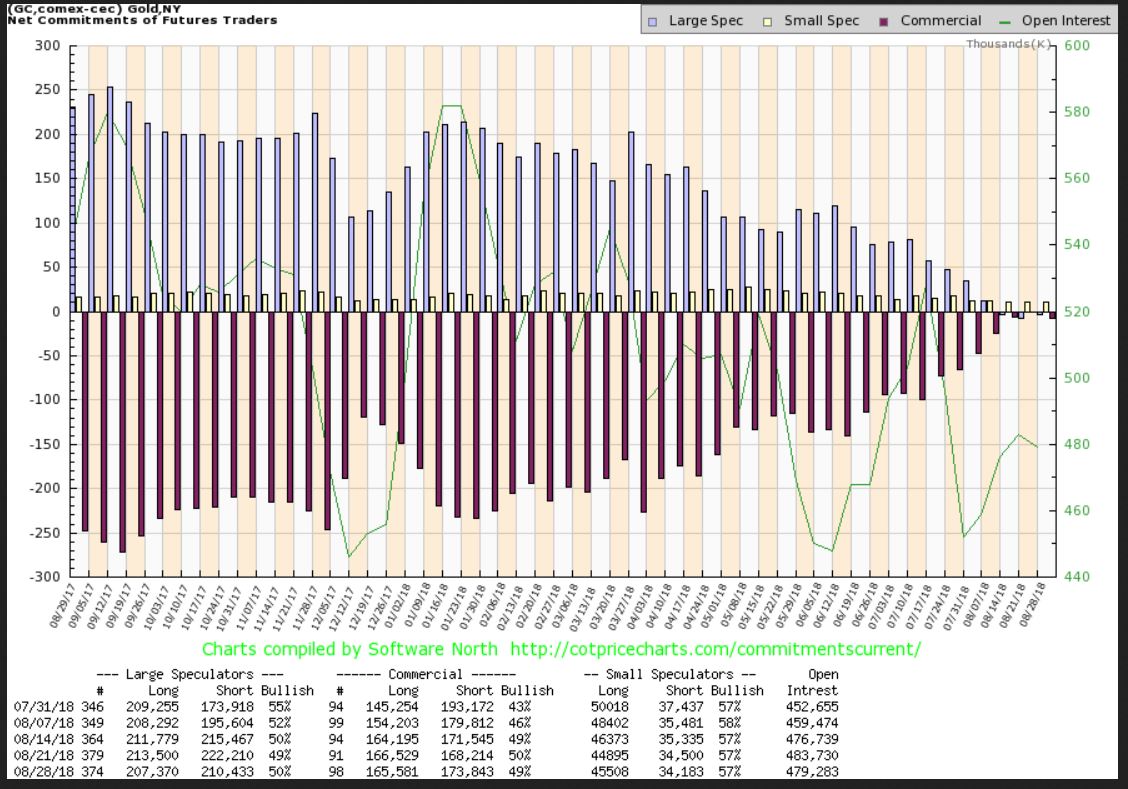
COT GOLD – This is an EXCELLENT COT For an ICL reading. Gold ran up $50 off of the lows and smart money went slightly short again ( Very Normal). It rises with Gold at every ICL.
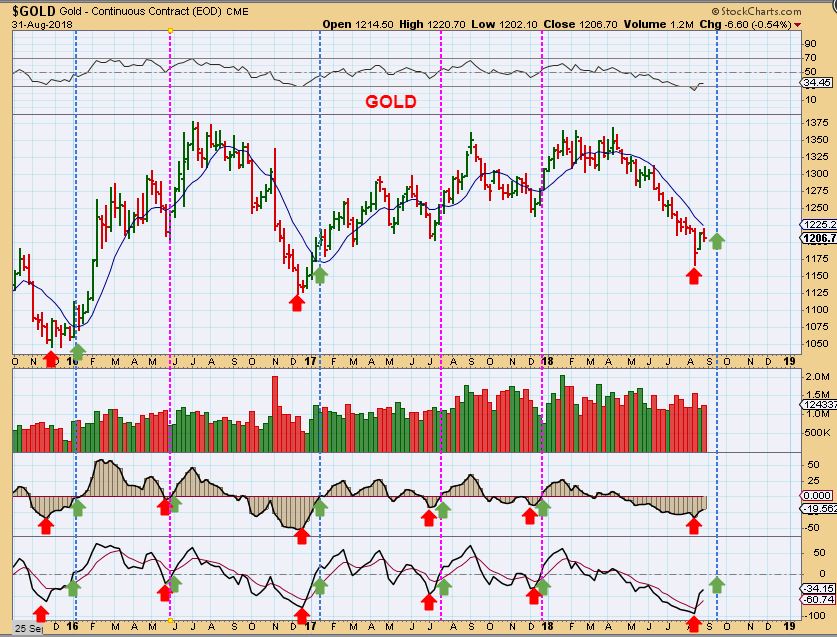
GOLD WEEKLY – GOLD IS ABOUT $40 off of the lows. We have a ‘daily swing low’ & daily buy signal, but the weekly ( For the more conservative) has not triggered yet. It usually would by week 3, but the sell down was deep so the indicators that I’ve used in the past went deep too, like 2015 & 2016. Those did not have V-Bottoms like the others, they paused at the lows & triggered on week 4 or so.
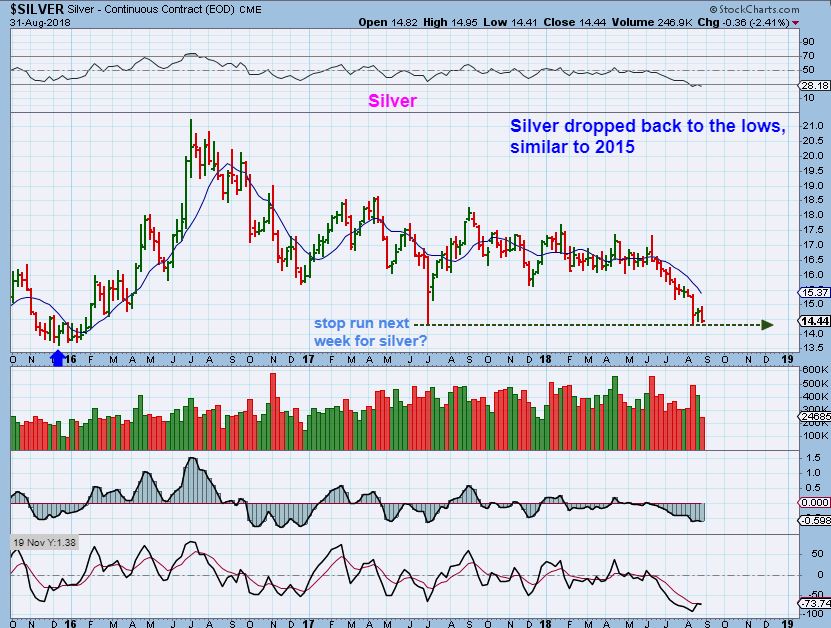
SILVER – Very different from Gold, Silver is at the lows. I like to see SILVER & MINERS lead the way higher, and they are not. 🙁 It is concerning, but I’m not panicking. It is possible that Silver does a quick stop run here. If that were to happen, This could briefly drag Silver Miners down a bit too. Notice…
COT SILVER – How bullish the Silver COT is. Just like Golds Extreme COT 2 weeks ago, Smart money is now actually net Long silver . Very Extreme. 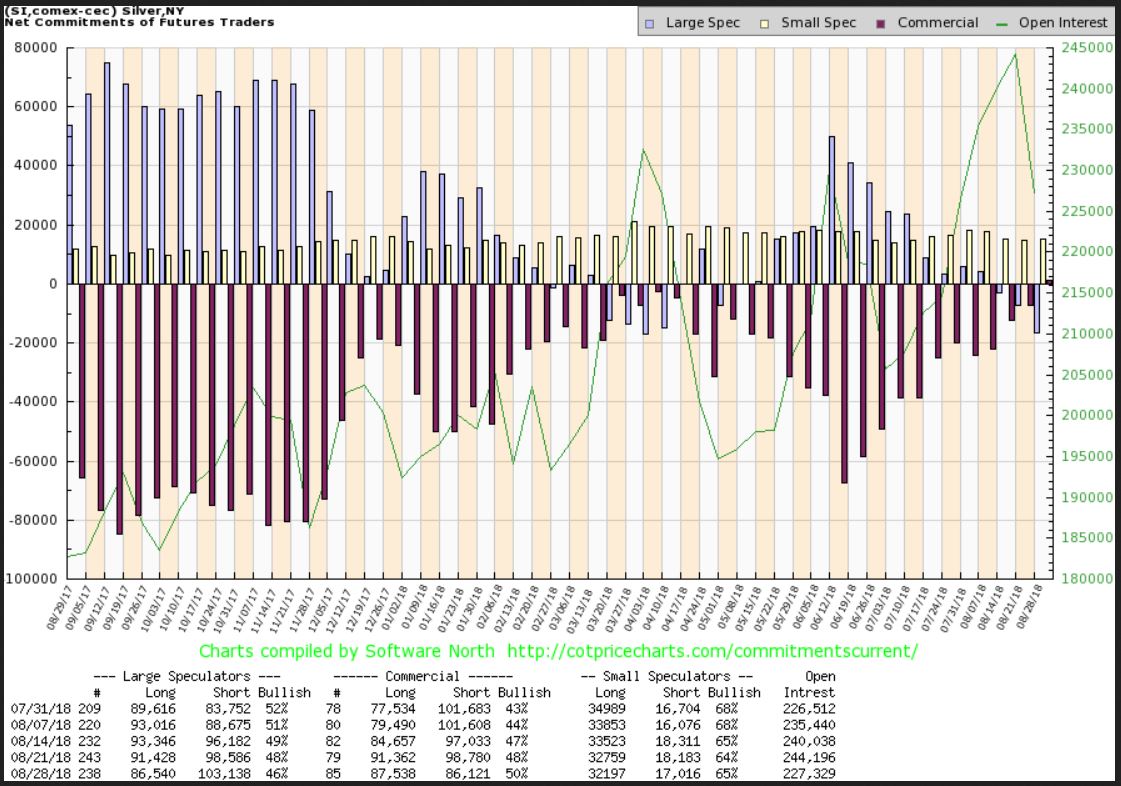
Those C.O.T.s are NOT a timing tool, but they do seem to indicate that GOLD & SILVER are at ICL levels. This is what my analysis shows. Why have we not seen a RAMP UP? Maybe they are waiting on the $USD and a L.T. Daily cycle? The YUAN? Whatever the case, patience is needed in times like this. You and I cannot force the market to do what we want – when we want it. We look at the evidence ( Extreme C.O.T. readings, capitulation, & Timing for example) and must patiently wait. 🙂
.
Now get ready to really cry or really work on patience. SILVER & GDX are not leading the way higher and they are not in sync with Gold yet. I would say that if SILVER does that stop run, Silver Miners could briefly follow too.
.
GDX WEEKLY – Look at the 2015 Lows and the ‘slight new lows’. Miners bounced around in what is known as a “Complex Consolidation’ Pattern in 2015. They slightly broke the lows at times. NOW: At this point in our current set up, it looks like we had a FLUSH OUT LOW with Gold, however, Silver is at the lows and could do a quick stop run. That could drag Silver Miners down briefly too. GDX or GDXJ could also violate the lows. GOLD, SILVER, and THE MINERS do not seem to be completely synced up yet…
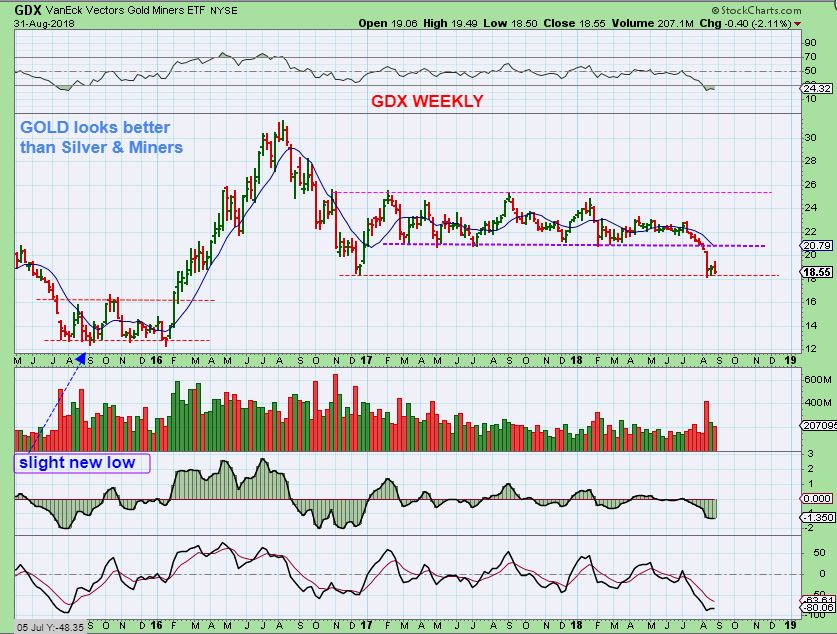
So again, GOLD, SILVER, and THE MINERS do not seem to be completely synced up yet. Next week will tell us more. Will Silver do a quick shake out & Rally, taking Miners higher with them? Will the USD bounce for a few days and cause Miners to slightly break the lows before they flip higher? We just have to wait and see with such a mixed bag. Confidence comes from the idea that the COTs levels are at historically Bullish extremes.
,
Various Miners are still acting independently. Let’s take a look…
.
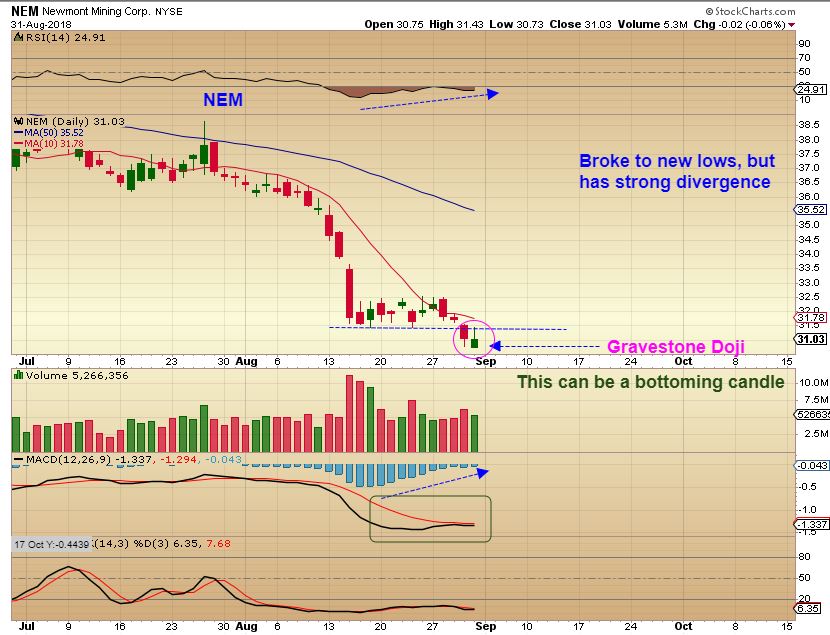
INVERTED HAMMER AT LOWS – We have one on NEM.
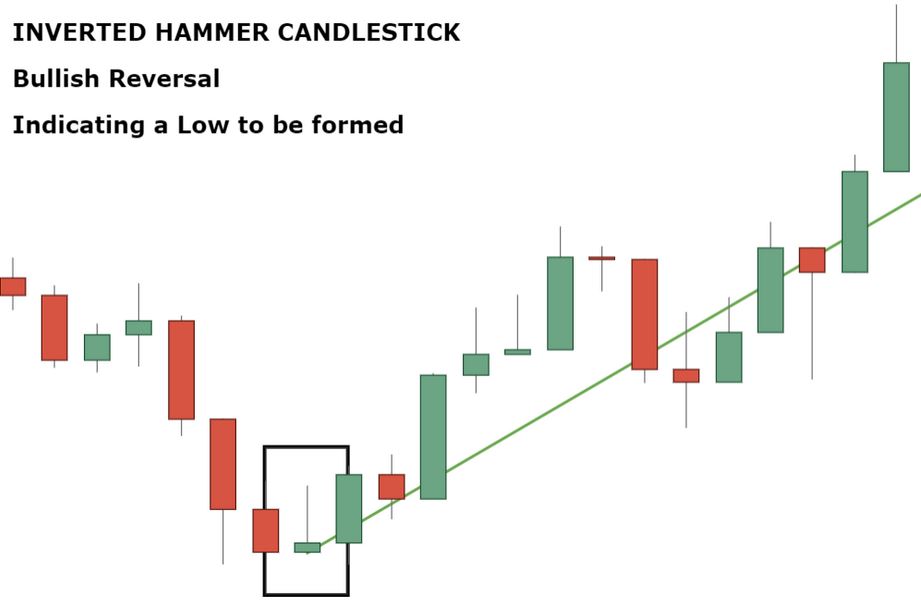
NEM broke to new lows and stalled with an inverted hammer or gravestone Doji Friday. This actually looks like a shake out with that divergence. It actually looks like it wants to recover.
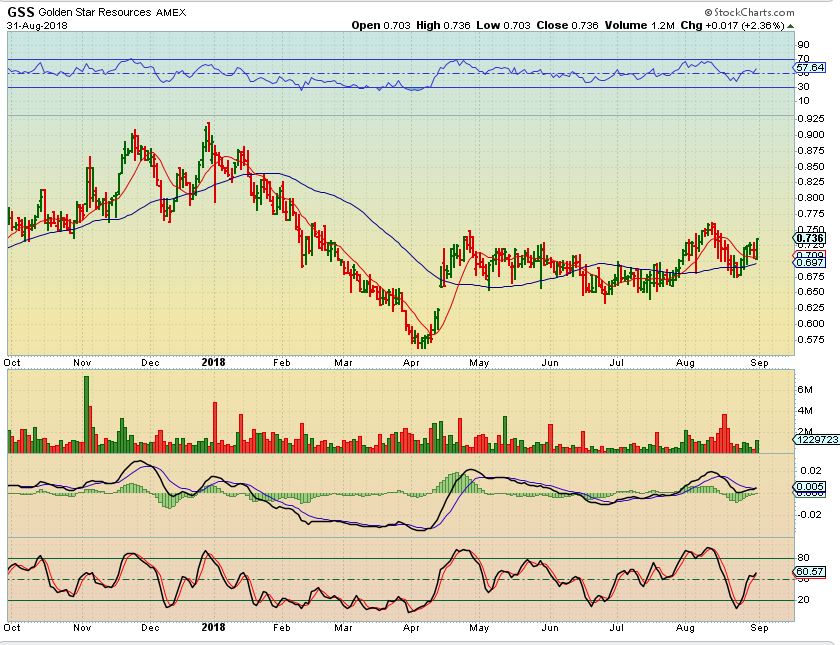
GSS – GSS popped above the 50sma and Popped higher Friday too. This Miner actually looks good so far
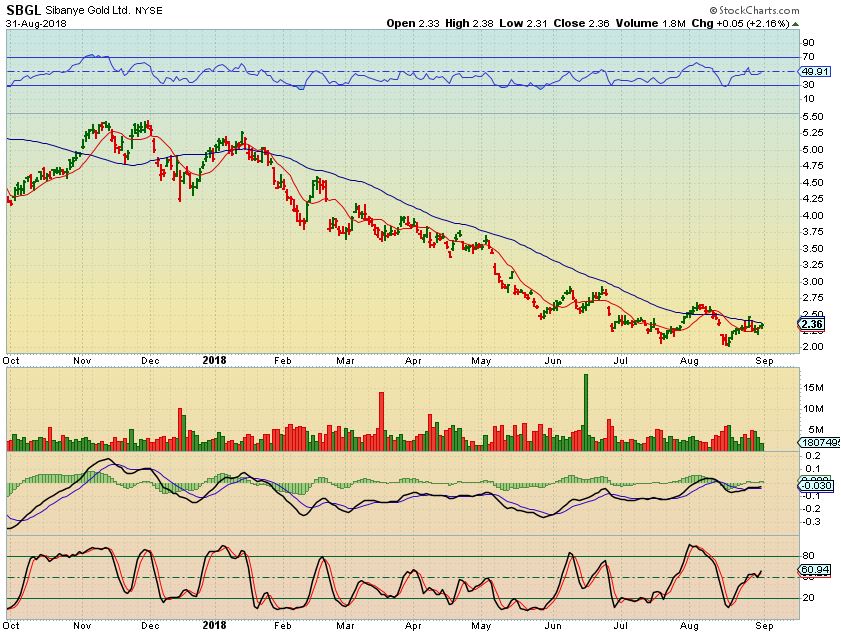
SBGL – The MACD on SBGL is rising steadily as it pushes on the 50sma, but it isn’t really a buy yet. If it crosses that 50sma, that would be bullish, and …
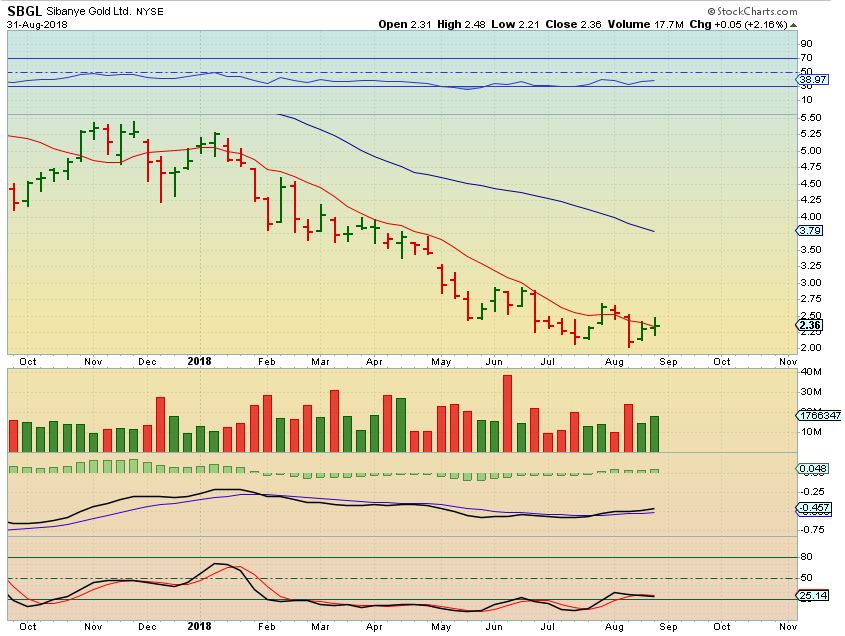
SBGL WEEKLY – The weekly MACD & VOLUME also look good.
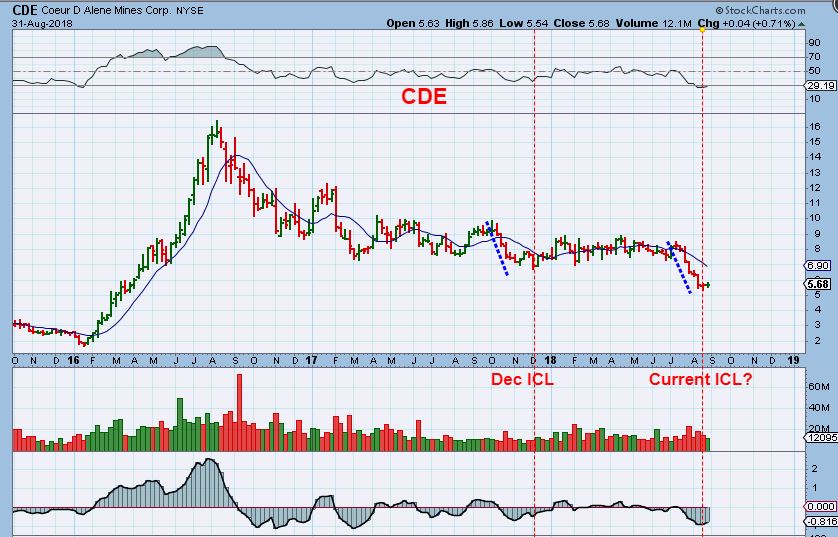
CDE – CDE has dropped to a measured target, but I dont like Silver on the edge of the lows. That means that I don’t really like the Silver Miners very much yet. I dont see any sign of strength right now.
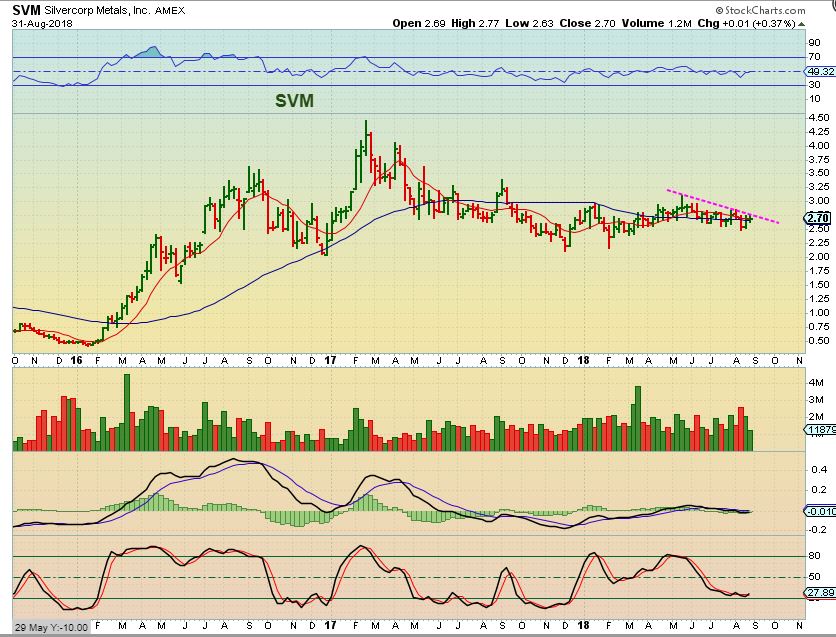
SVM – I do see long term strength in SVM and it almost looks ready to break out higher, but short term it still isn’t really a buy for me. A break higher would do it.
Conclusion:
Good: GOLD looks to be acting correctly. Good : The COT for both GOLD & SILVER shows Smart Monet at extremes, even when compared to historical levels. Questionable: Silver is at the lows though, and Miners are not leading higher yet, with a few actually still breaking down. RESULT: The above charts show a mixed set up.
.
Someone sent me this in an email. “Poise, patience, and silence are attributes that must be cultivated. These virtues do not come automatically to the stock market trader.” – Jesse Livermore
Todays trader wants immediate gratification, immediate follow thorough, all gains and no draw-down. That is not possible in these markets. Unfortunately, we have to patiently wait for the Markets to make their move.
.
Enjoy your 3 day weekend ( in the U.S., Markets are closed Monday) and we’ll see how things shake out next week.
,
~ALEX
.
NOTES:
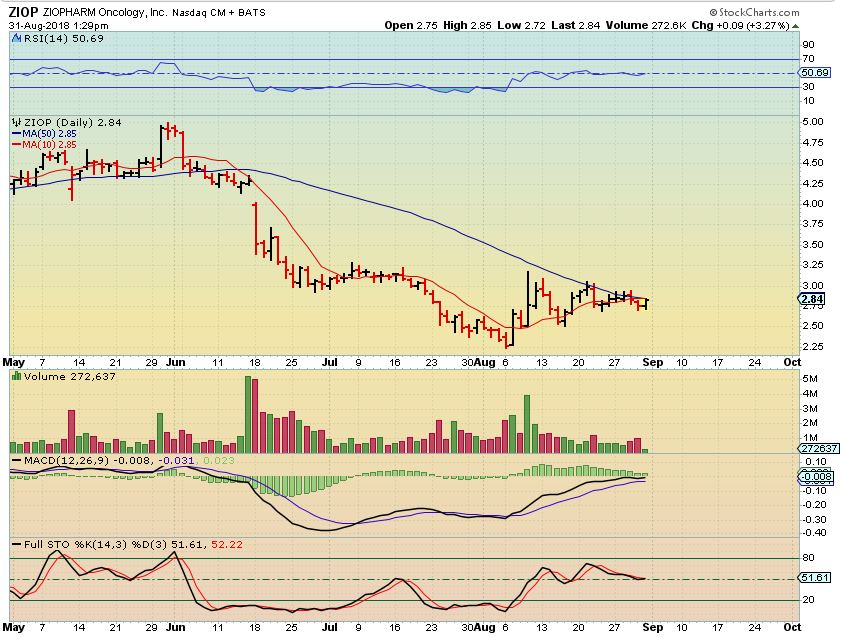
I was watching GALT, ZIOP, ( NVAX if it pulls back to the 50sma) and a few others last week, and ZIOP was pushing on that 50sma. ZIOP popped above this 50sma Friday, and I bought it. It closed under $3.00, so I feel that it is a low risk entry with a stop under $2.80 or even $2.70. I think that it can run a lot higher with follow through.
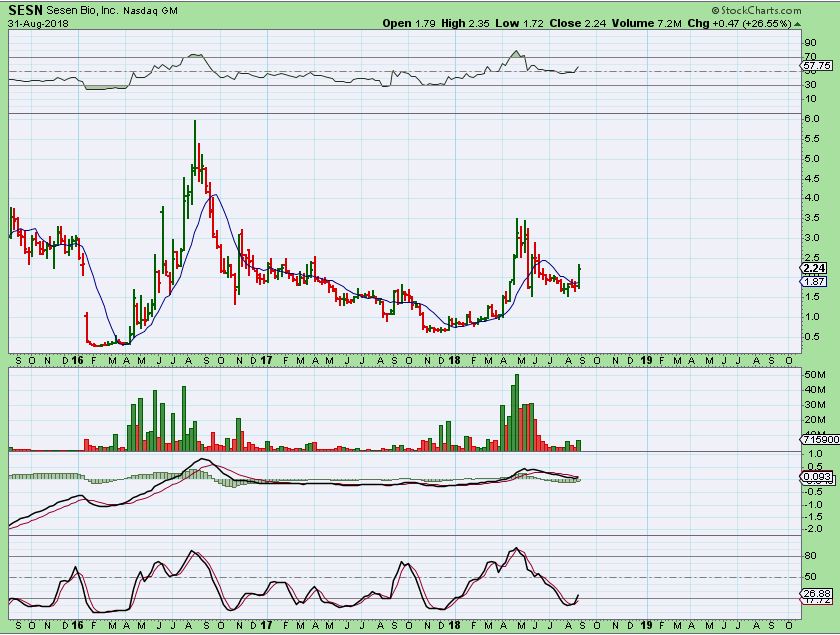
SESN – Chuck emailed me this one, and I like the chart. He actually mentioned SENS & SESN. SENS is JUST breaking above the 50sma now too.
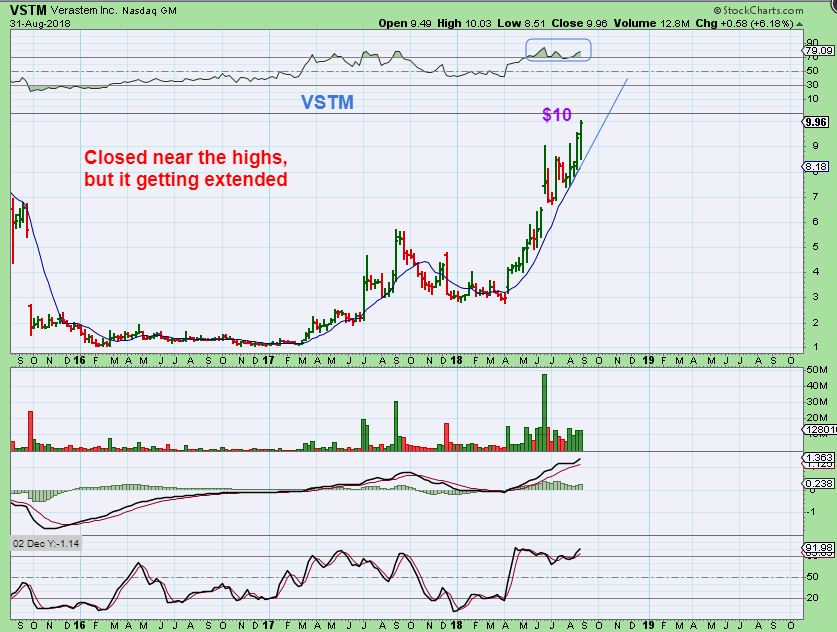
VSTM – VSTM was recommended as a buy at $8 and 2 other times after that. It has had good follow through, however…
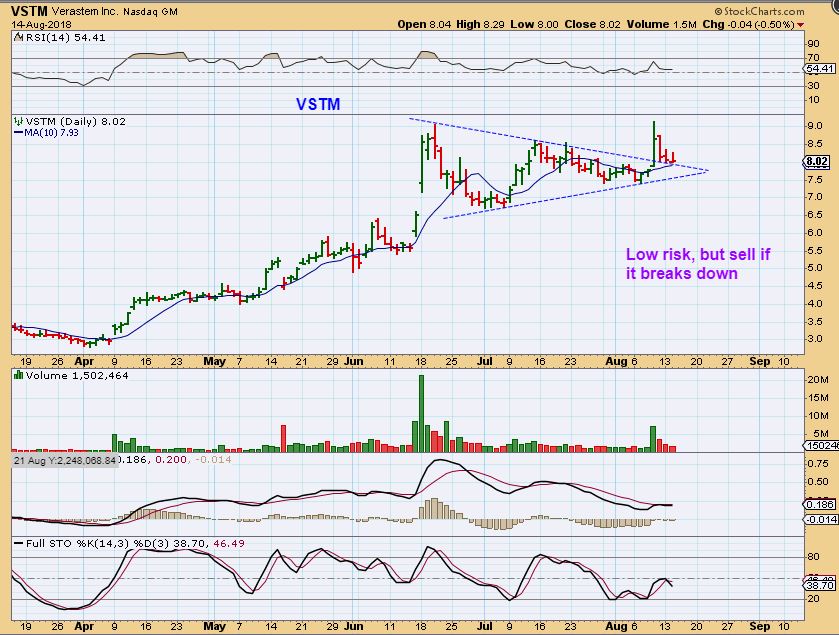
VSTM WEEKLY – The weekly chart does look a tad extended. It CAN keep going, but I would expect a pull back soon, so let’s look at the daily…
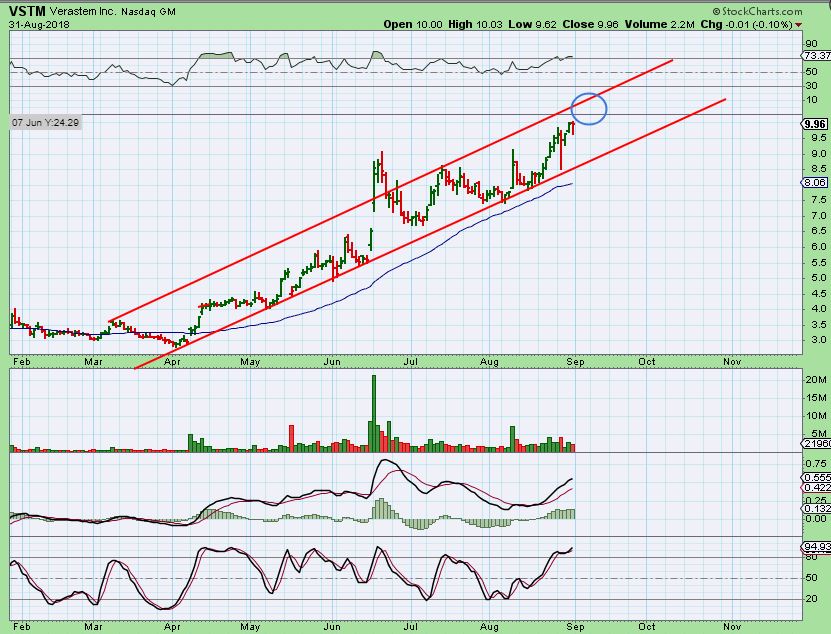
VSTM DAILY – An upper trend line could be the next peak. You could just
1. Add on the dip, or
2. Sell partial at the trend line, or
3. Sell out/ Take profit completely at the trend line and buy the dip again.
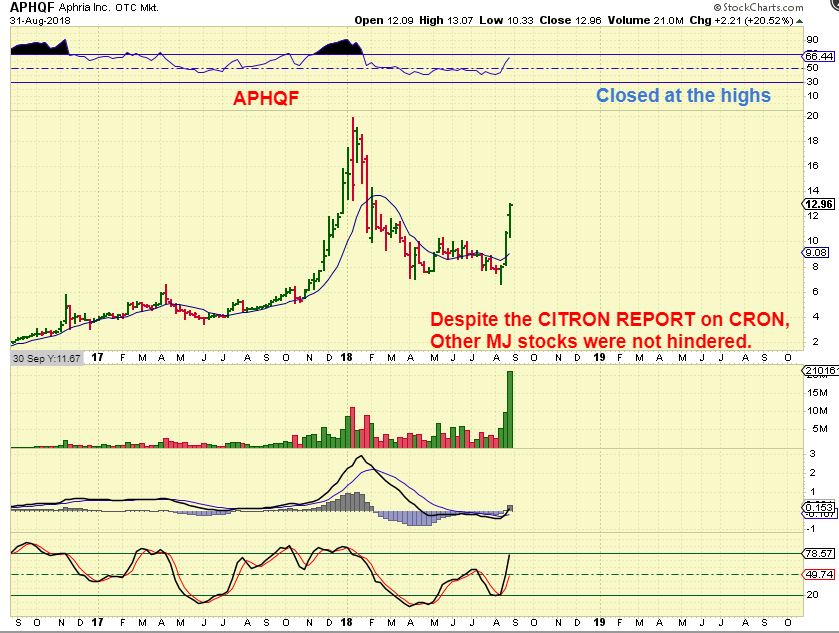
APHQF – Read the chart. I am leary of ‘overly extended MJ stocks because they are easy to target as a short & then release a scare story to start the selling. CGC may be next. I still own APHQF, but it is starting to get extended too. I wanted to ride this to $20, we’ll see.