Sept 29- The Big Picture Continues to Get Clearer
The picture is getting clearer in the precious metals sector, and we have been on the right track. My Midday Friday report pointed out a few things to take note of, and this weekend report will contain a few more noteworthy points of interest. Let’s get into our weekend Big Picture Review.
.
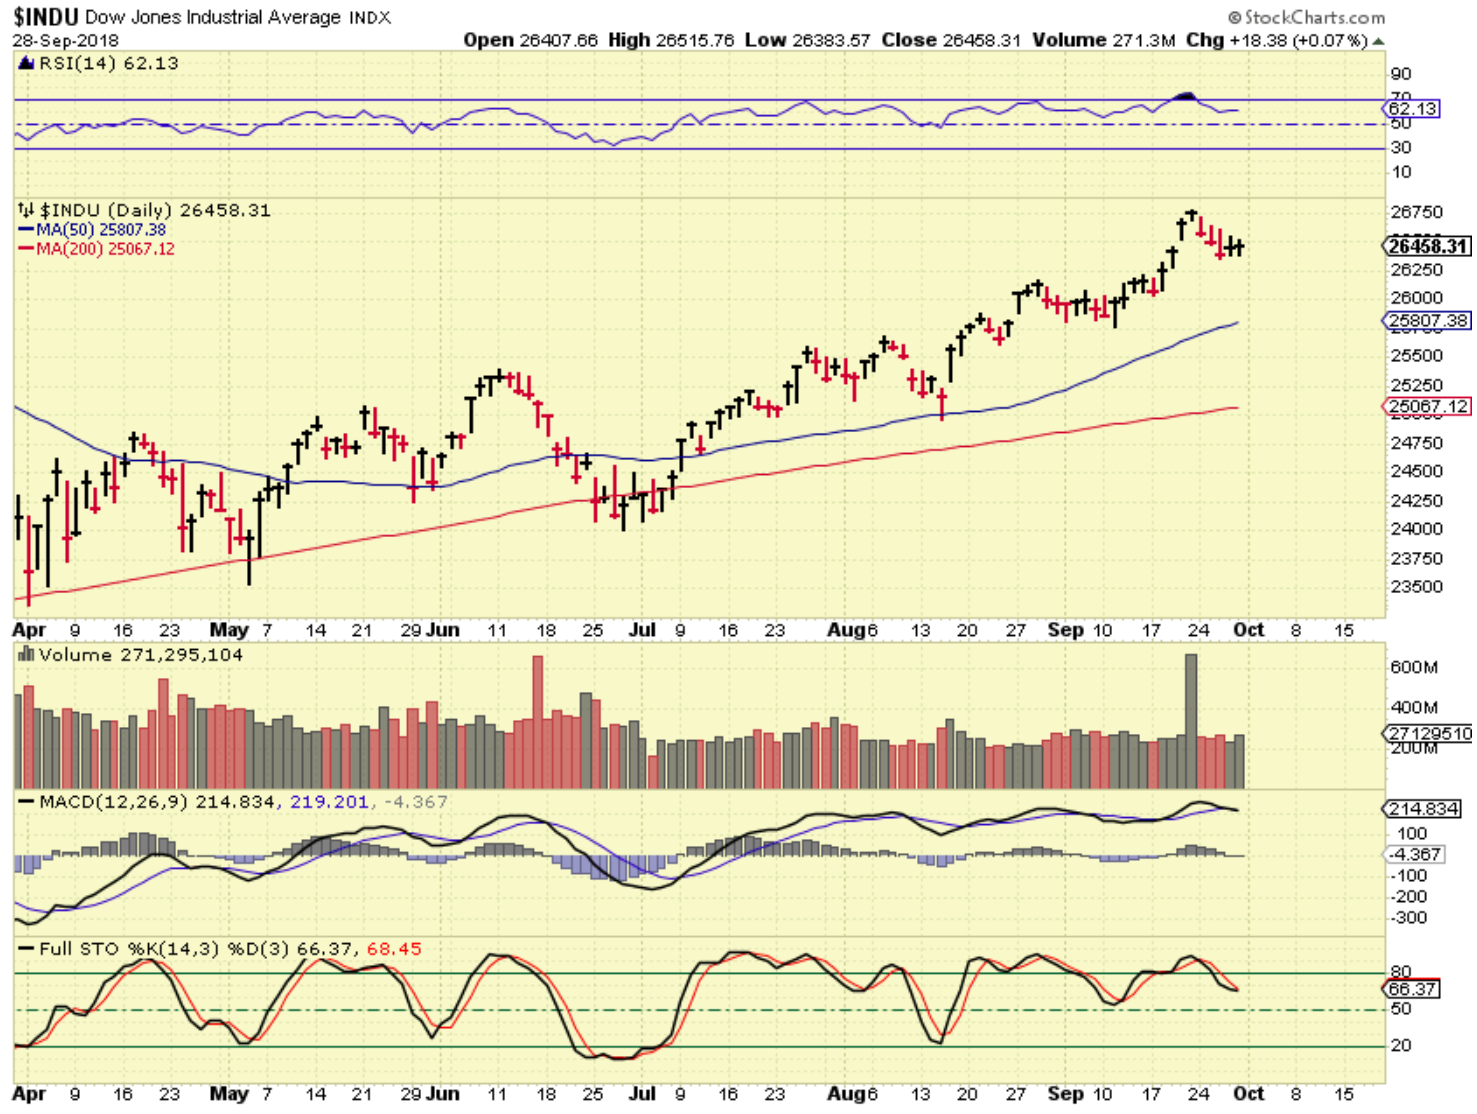
DJIA DAILY – The DOW broke to new highs recently, and as I mentioned, often the general markets break to new high, the Bulls get extremely bullish for a massive follow through rally, and it pulls back. Each break to new highs has been followed by consolidation.
SPX WEEKLY – The SPX is due for a drop into a DCL / ICL. Here I am pointing out the Obvious ICLS that occur just about every 6 months, and then we had some mild ones with small sideways moves in 2017. 2018 had a sever drop at the start of the year, and now we have had a fairly steady climb ( Choppy stairway at times). I would still have to say that we are due for a pull back though. I see strong divergence not confirming the recent break to new highs.
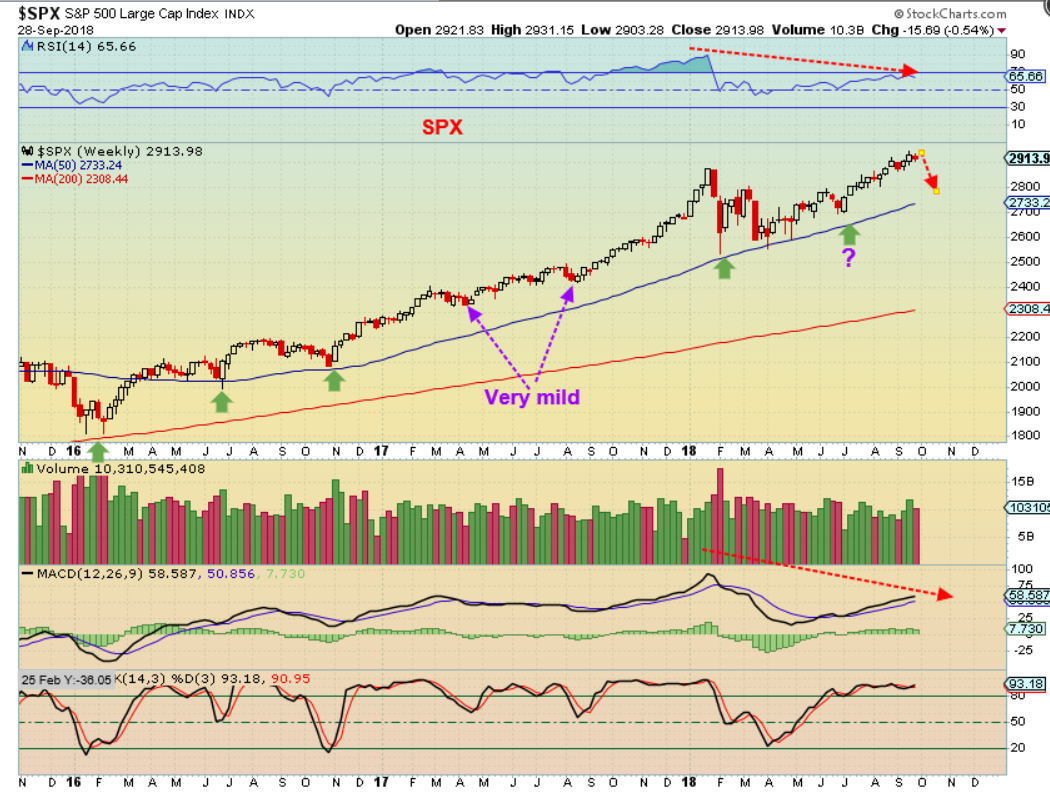
The General Markets are giving what many consider to be ‘warning signs’ of a bigger pull back to come, maybe even a roll over & start of a bear market. The Markets are due for an ICL dip, so as the markets continue higher, it is good to listen to various warning signs at that time & be a bit cautious. I have mentioned things like “this a stock pickers market” and said that I am at times “Cautiously optimistic“. Why? Well, a healthy Bull market will have a good number of stocks making New highs, while others are dragged higher with it due to good earnings, etc. This one has a number of stocks making new highs, while a large number are also making new lows ( This term was labelled Hindenburg Omen) and often will occur before a bear market begins or even a sudden crash. Note: It does NOT always lead to one, but that phenomenon does occur at Bear Markets.
That said, this is why at this point I have merely said 2 ideas about the General Markets, and now want to add a 3rd :
1. This is a stock pickers market and can be choppy ( Stock pickers market because some stocks making new highs like SQ, SAIL, AMZN, etc) , but…
2. Many others are breaking down and a large number are making new lows. Since an ICL is due, I have to recommend being a bit cautious, use stops, etc .
3. Now also noteworthy, and the reason that I am bringing his up pointedly now, is that October has seen Market crashes in the past.
.
WTIC – I expected a deeper dip in Oil, to lower lows as seen in April to July of 2017. Even that one did a drop, rally, drop, rally, drop. SO far Oil currently has moved almost back to former highs , and I noticed that quite a few energy stocks flipped to bullish too. Oil right now rallied out of a dip that I expected to go a bit lower.
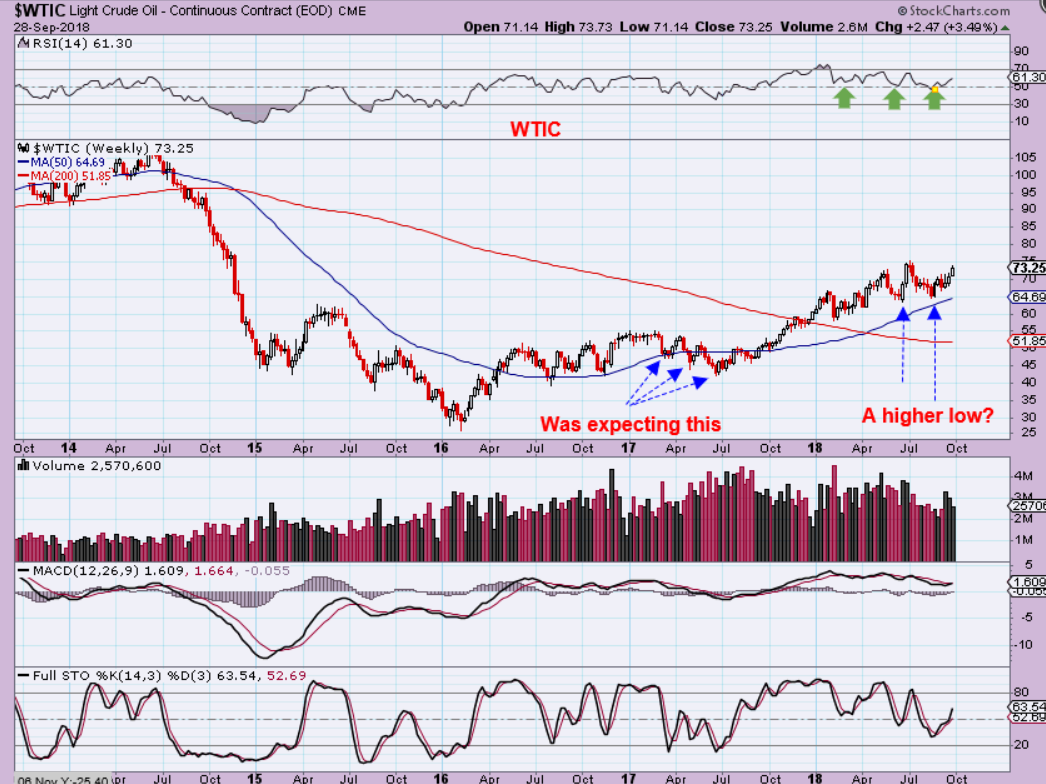
OIL CONCLUSION AT THIS POINT: Is Oils rise due to inflation? Maybe. Will a deeper dip into a more noticeable ICL still take place? Maybe, but as you can see on this chart, at this point Oil is almost nearing new 3 year highs & Energy stocks flipped to looking bullish. I don’t want to fight the markets when they speak. I was not short or long, but some Energy stocks do look like ‘Bullish set ups’, so we trade what we see for now.
.
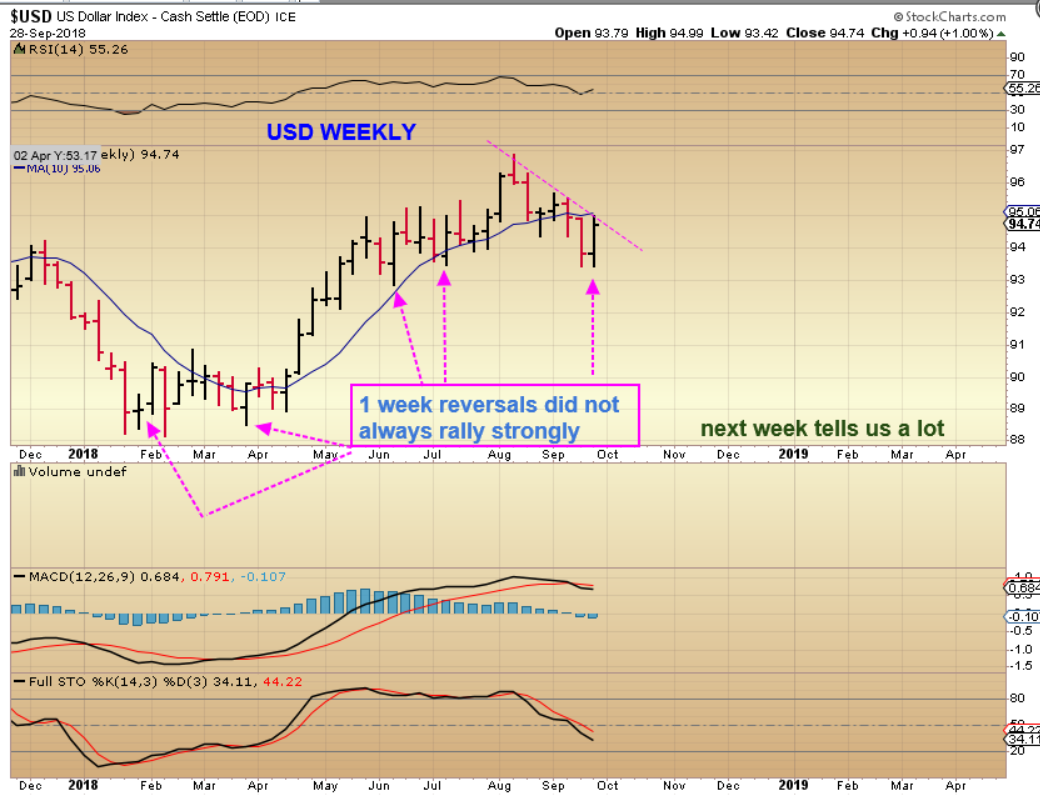
USD WEEKLY – That was a pretty strong flip higher in the USD after the Rate Hike. 1 week earlier, it was following my expectations as bearish and due for a drop into an ICL. Is this now Bullish? Not quite yet, but it was a bullish looking reversal. It is still under the 10 weekly MA, and…
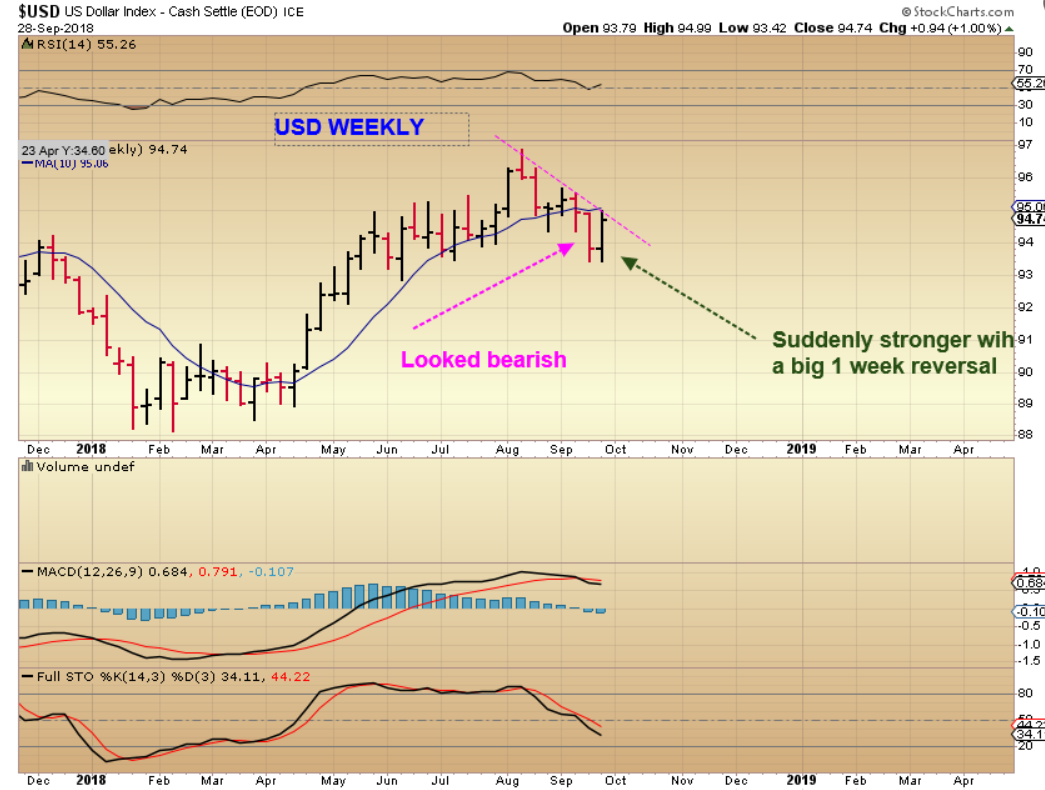
USD WEEKLY – 1 week reversals in the past did not always follow through, so we’ll see.
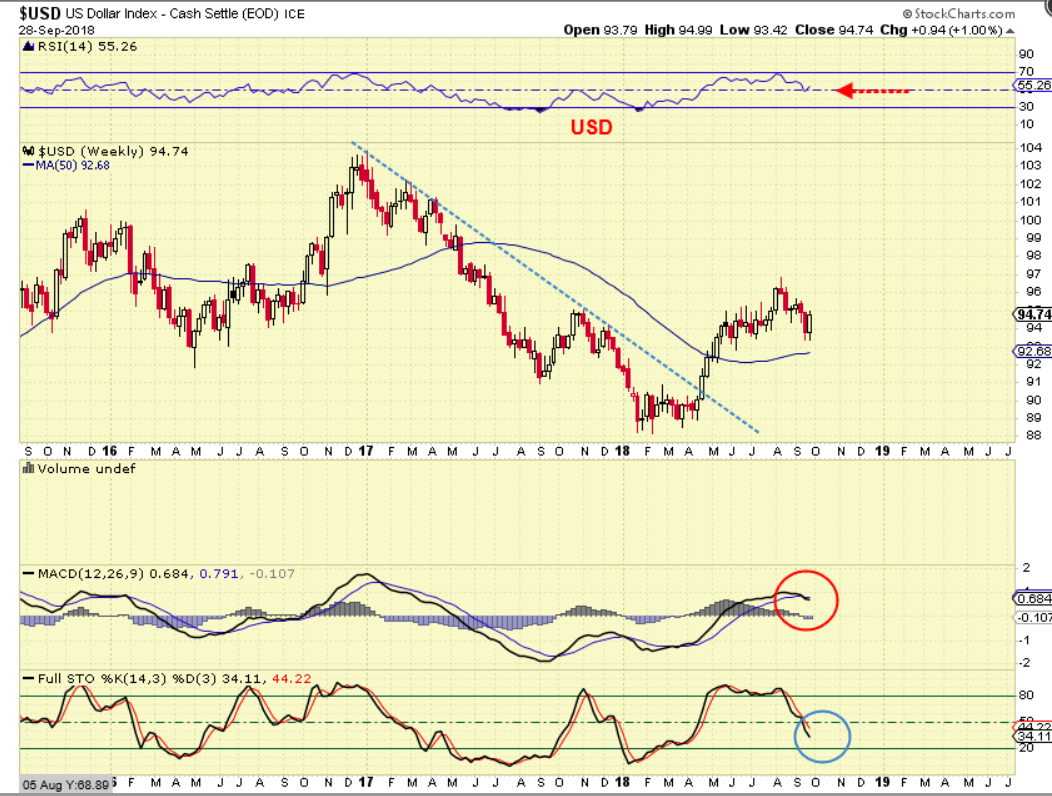
USD WEEKLY Big Pic – MACD may cross down and this still may be a daily cycle that rolls over into a deeper ICL.
.
IS INFLATION CREEPING IN? OIL MOVED HIGHER & METALS SEEM TO BE SETTING UP TO MOVE HIGHER
.
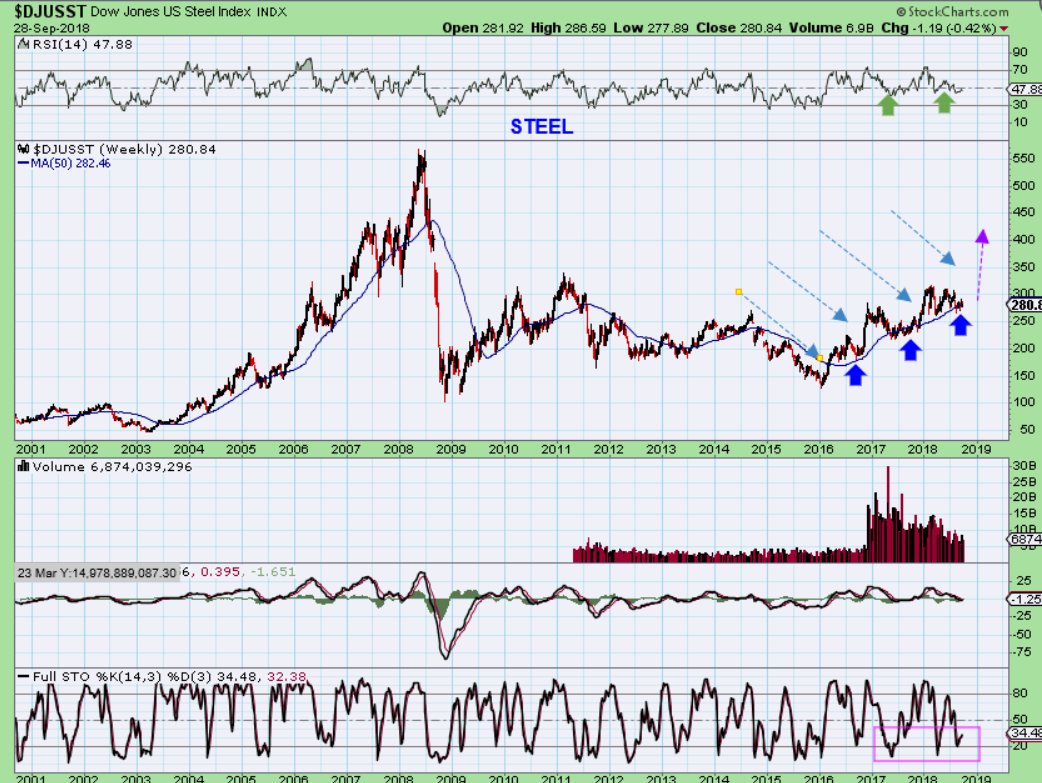
STEEL – Steel & Steel stocks like CLF, X, AKS look bullish, as pointed out in past reports
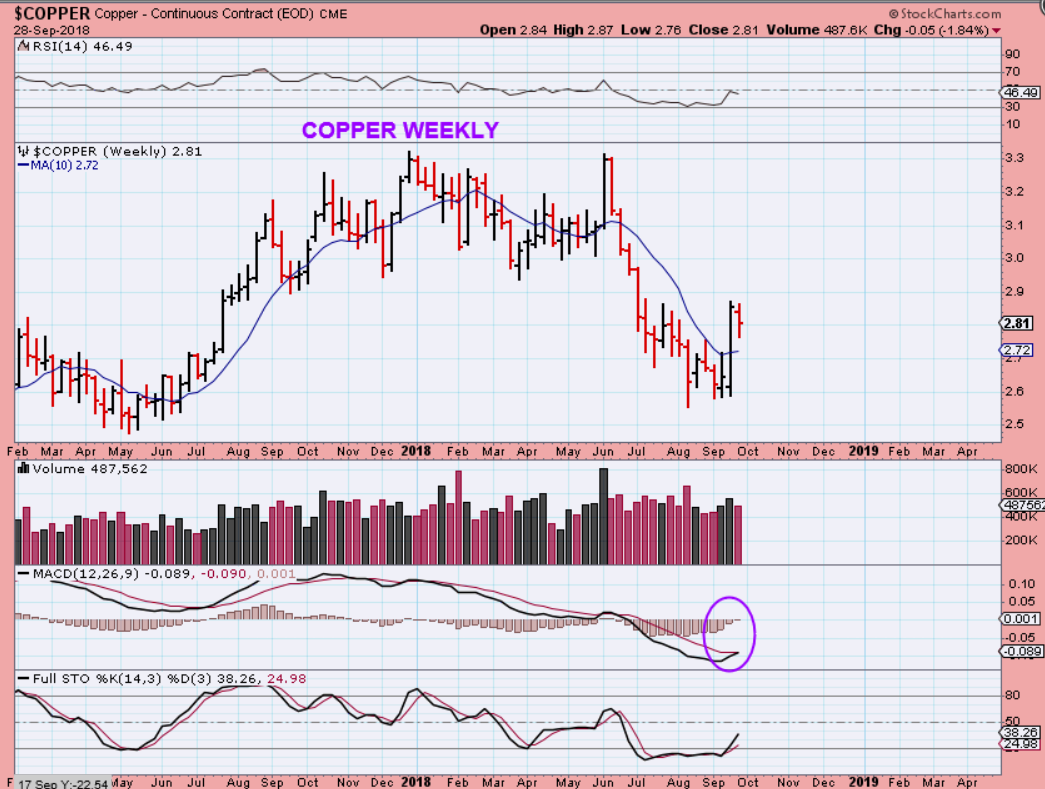
COPPER WEEKLY – Copper seems to have bottomed as it has Popped higher out of an ICL. Notice that Copper spent 4 weeks at the bottom & then the Pop. Maybe Gold will do that?
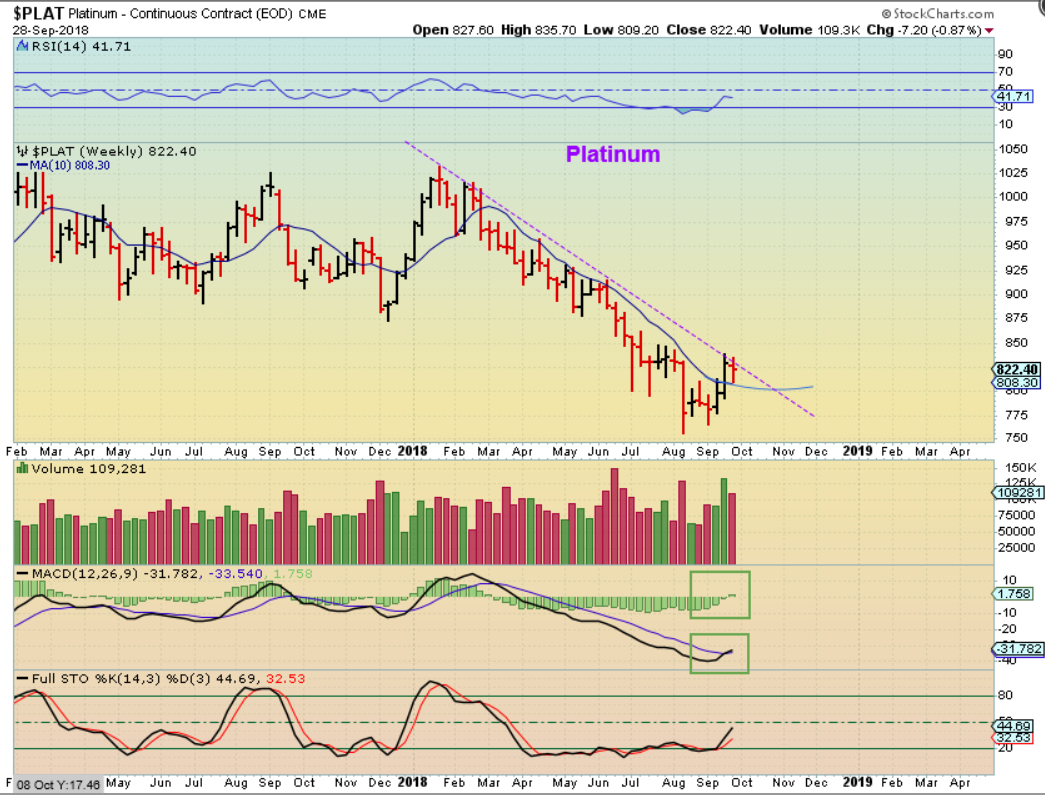
PLATINUM – Platinum is 6 weeks off of its lows.
.
I made the statement after the POST FED GOLD DROP, that things should be a bit clearer after Thursday or Fridays trading. Rather than just ‘take a guess’ because Gold slammed down $10, I wanted to see what happens Thursday & Friday. I then posted a midday report on Friday mentioning that things looked bullish. I was on vacation and in a hurry, so I posted a short bullish report, and this weekend I can explain things a bit more. My plane is delayed and I am writing this report on Saturday Night from the airport in hopes of getting it out Sunday morning. Let’s begin…
.
WHY DO I NOW THINK THAT WHAT HAPPENED TO GOLD POST FED THURSDAY COULD ACTUALLY BE BULLISH?
.
A point made in my update report midday Friday has been copy / pasted below – click to enlarge if necessary.
.
Along with what I mentioned that I was starting to see in that Midday Friday report, we have the following…
.
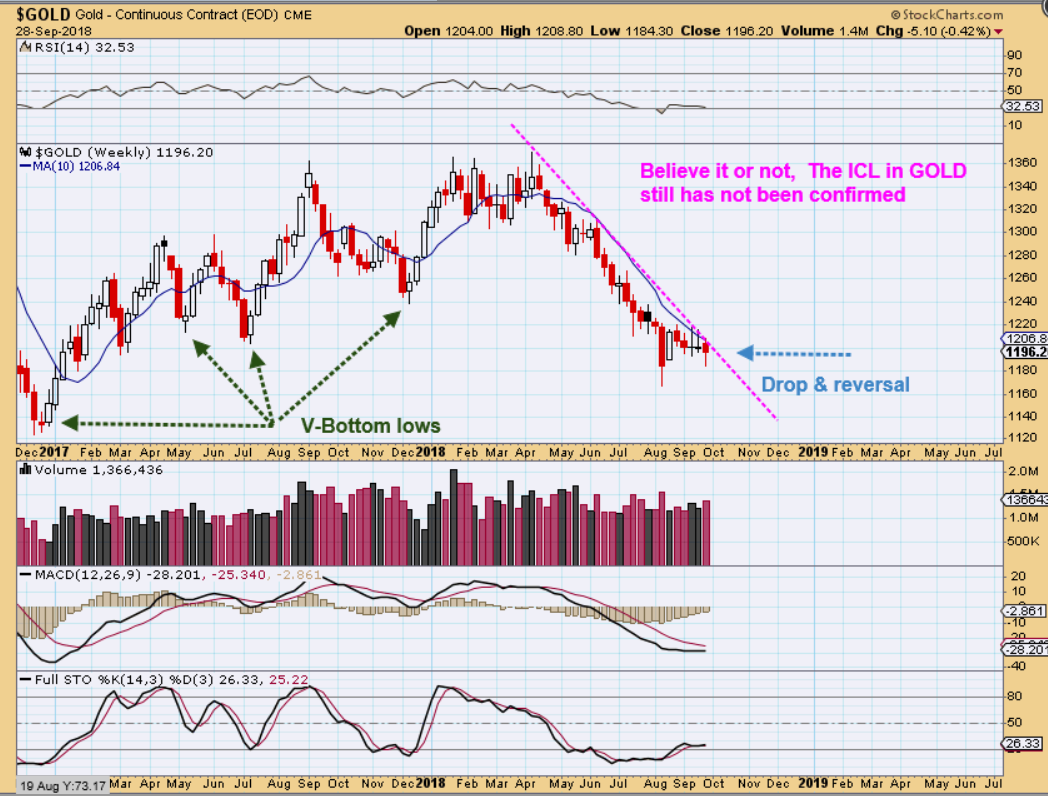
GOLD – Friday saw Gold regain the $10 that it lost on Thursday, so we now have a weekly reversal candle on Gold.
.
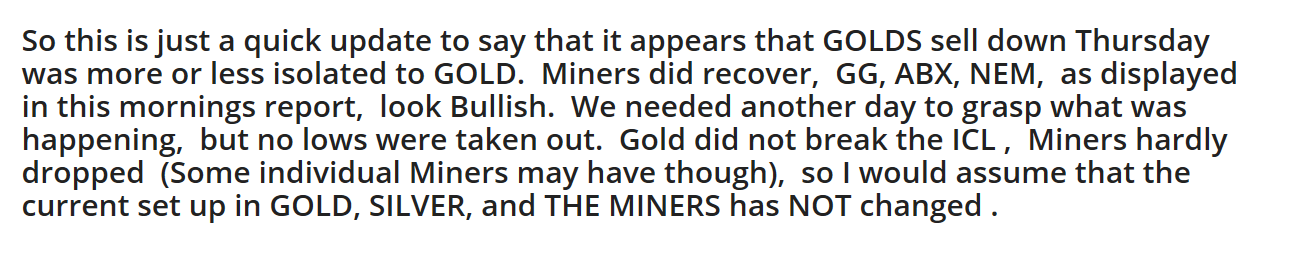
Do you remember when I said that on Thursday as GOLD sold off $10+, GG, NEM, ABX, and other Miners flipped higher & ended the day GREEN? Obviously that is a bullish event, but after even another day of trading, what conclusion does that lead to ?
.
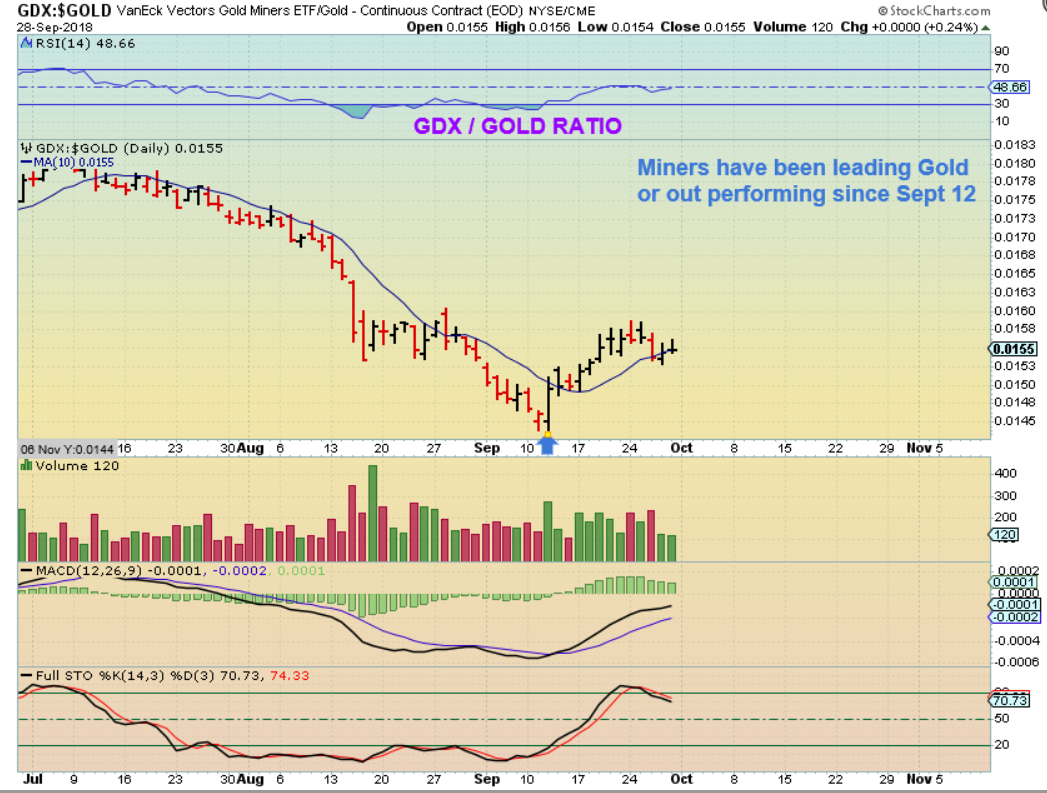
GDX:GOLD – Miners are actually leading Gold and have been for weeks as Gold stalled. Gold dropped $10 Thursday & Miners seemed to be accumulated.
.
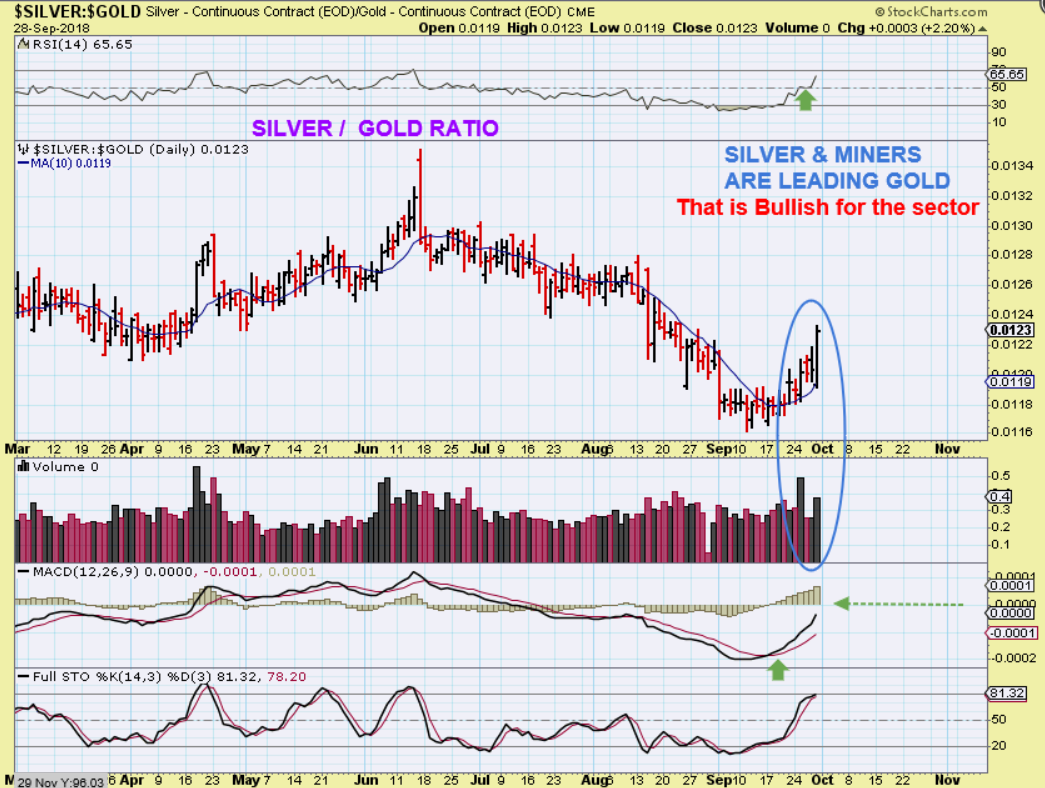
SILVER IS ALSO OUTPERFORMING GOLD – Look at the surge Friday in the Silver / Gold ratio. Thus we have Silver & Miners leading Gold. That is really what we are looking for or hoping for and that gives a more bullish outlook.
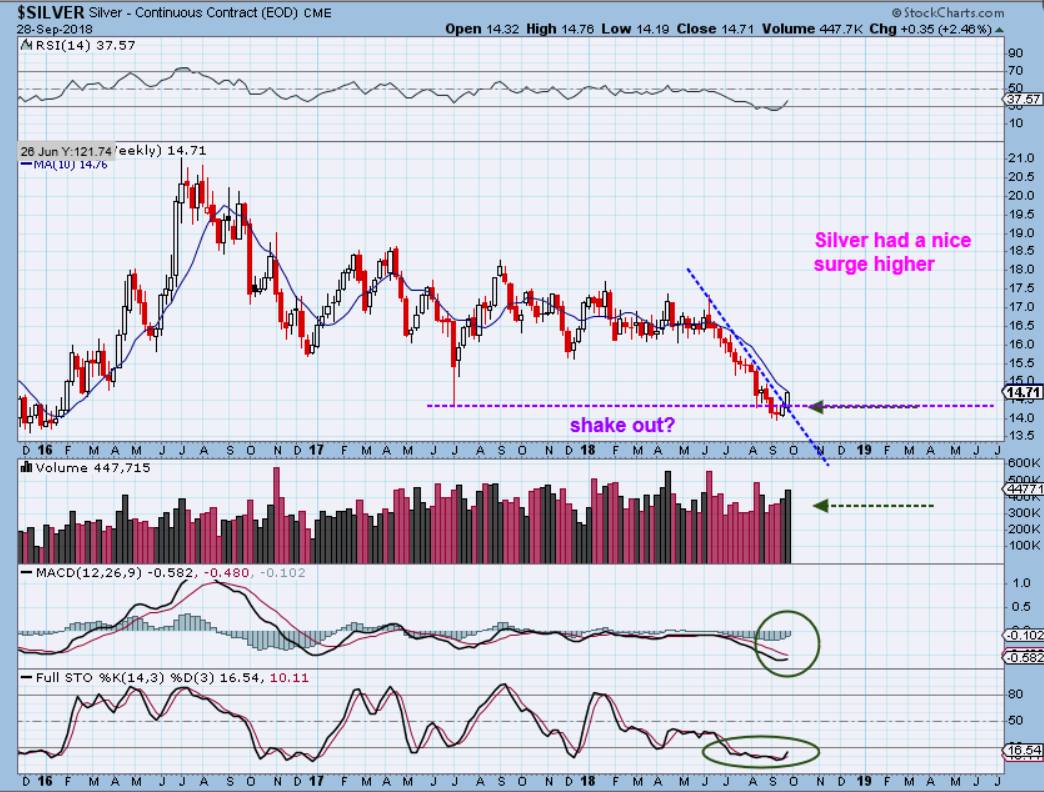
SILVER – And look at the SLVER WEEKLY CHART. That looks like a shake out & recovery. Notice : THAT IS A SILVER RECOVERY ON FED WEEK, so how can we conclude that the FOMC MTG & RATE HIKE was bearish precious Metals? We can’t if Silver burst higher with volume on the weekly chart, and we now have a shake out.
GDX DAILY – Before the FOMC MTG, I mentioned that if Miners dropped, I was looking to see if we would get this after the FOMC
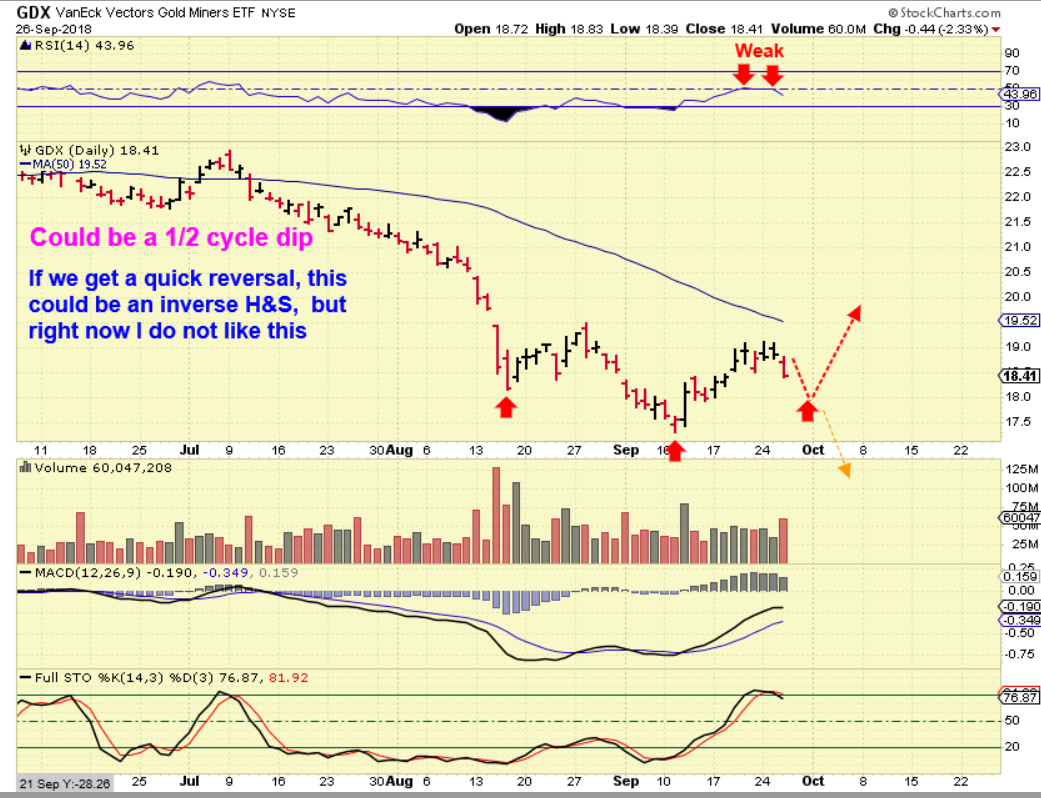
GDX DAILY – So far we have exactly what I was anticipating.
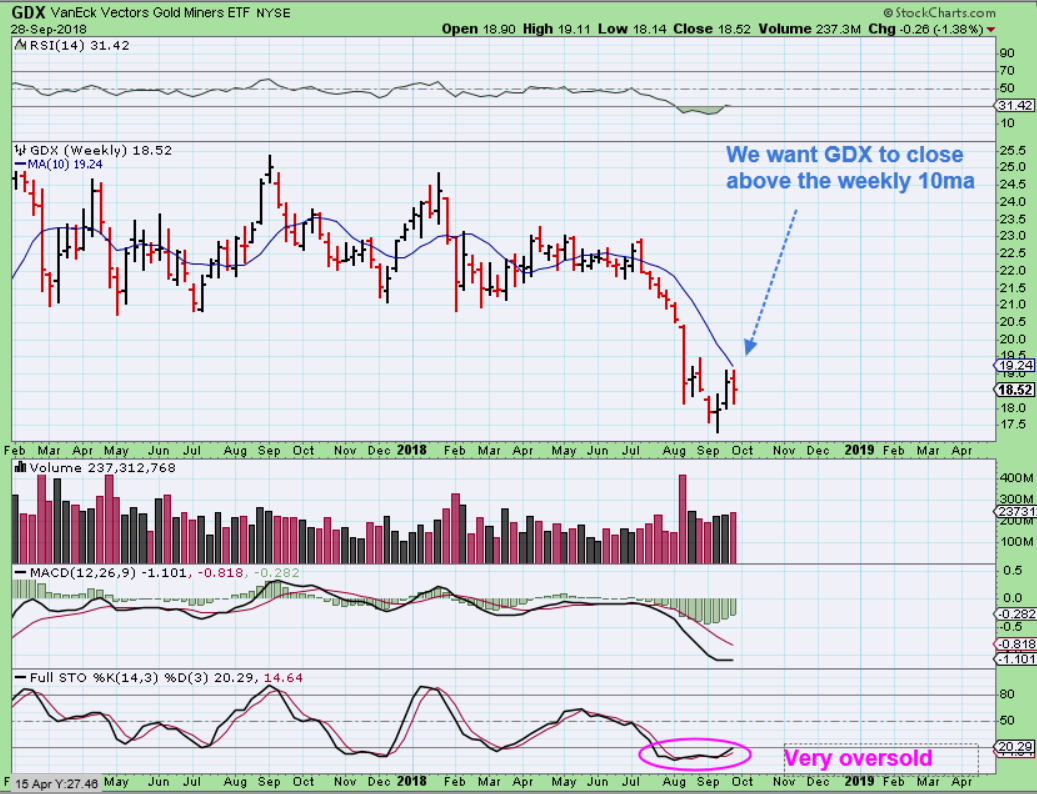
GDX WEEKLY #1 – Week 3 , we want to see a push above the 10 weekly ma, but notice that this is still very oversold.
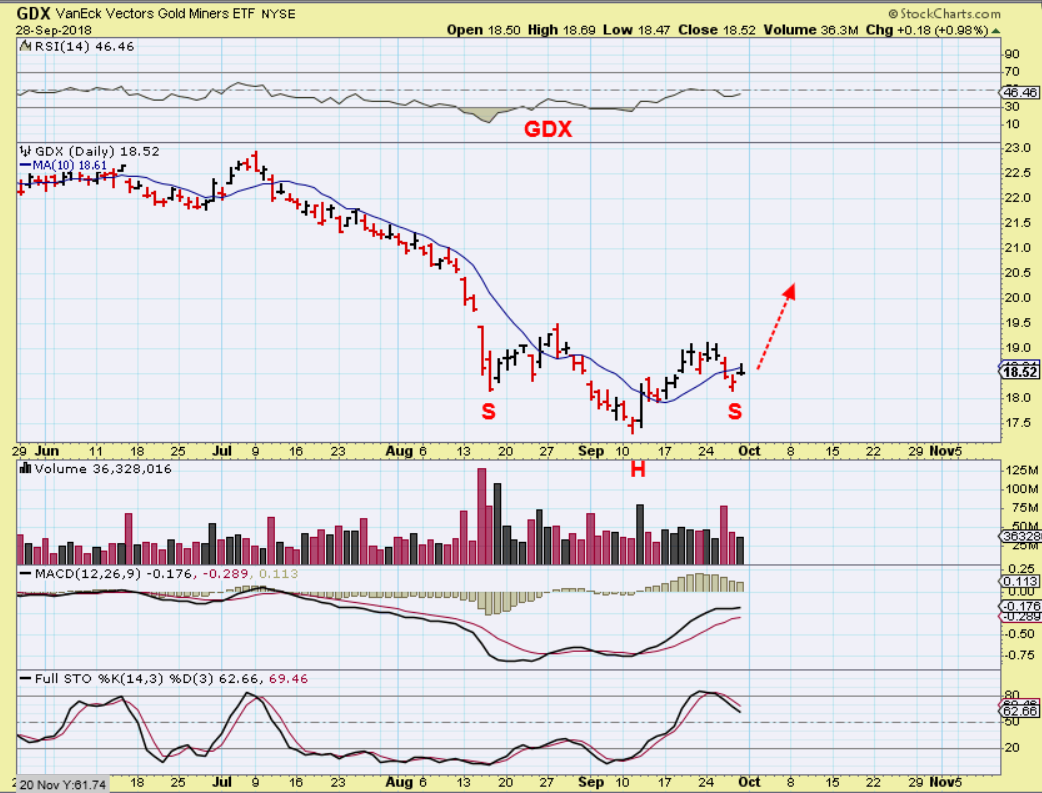
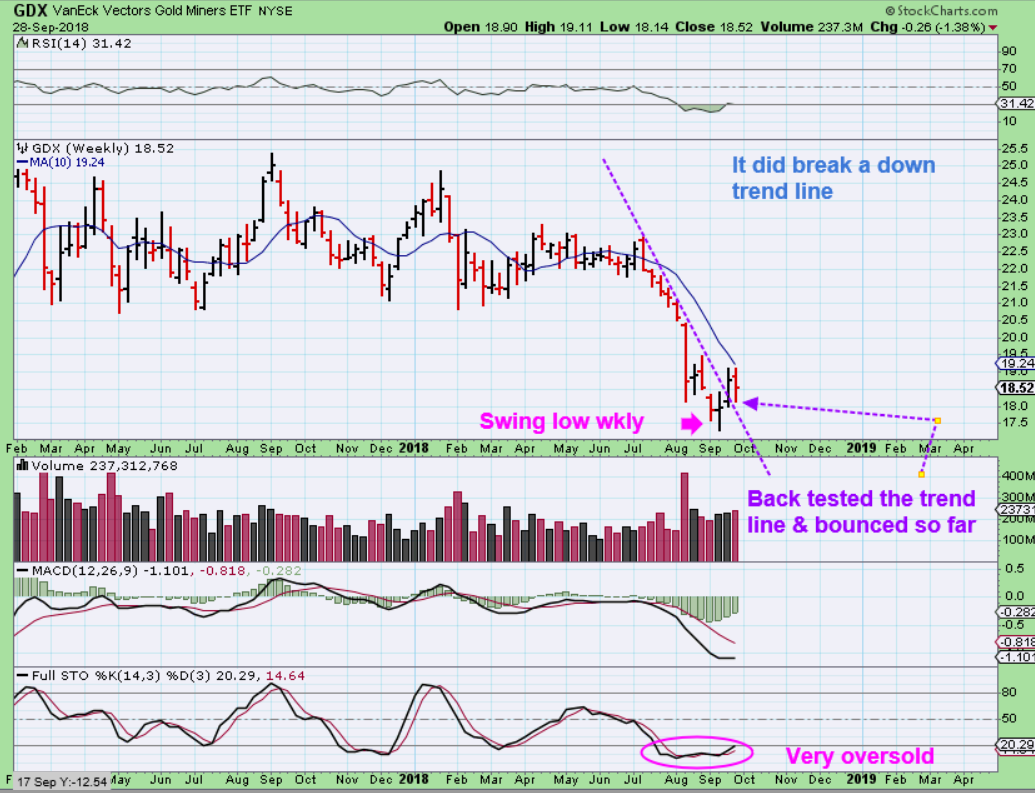
GDX #2 – The Bullish way to look at GDX WEEKLY. We DO have a trend line break & a swing in place on a weekly.
Note: The GDX chart remains oversold on a weekly basis.
.
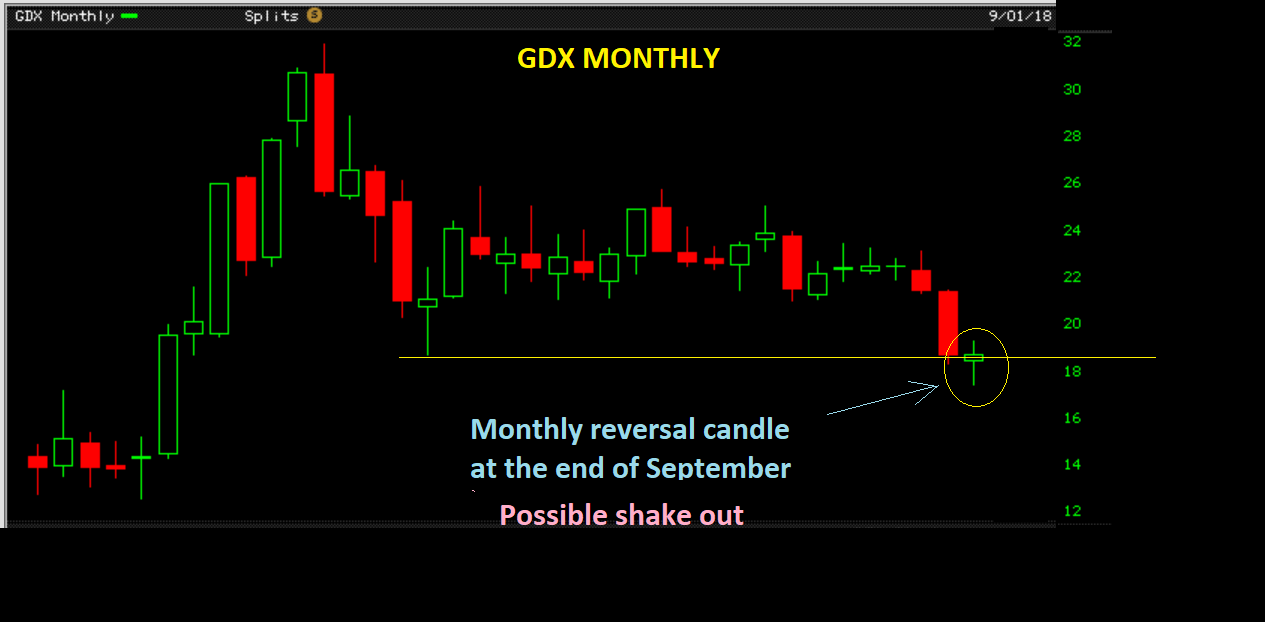
END OF SEPTEMBER
.
Now we have a GDX MONTHLY chart and this could become a shake out on a large scale. For those waiting for a rally in Miners, these are all excellent Big Picture Reversal Candles.
To sum this up, it is always tough at the lows (ICLs), and any choppiness makes traders anxious that the lows will give way. Then, when we don’t get a V-Bottom, it is even harder for some emotionally. The initial analysis for Golds ICL stands and it is the same with Silver and The Miners. Lows have not been taken out and now with shake outs & recoveries in Silver & GDX, I’d say that in some ways it has even improved, though it has taken additional ‘time’ to play out.
1. The Monthly GDX chart is a reversal of a shake out.
2. Silver did a shake out.
3. Silver & The Miners we are in a bottoming process that now shows Silver & Miners are leading Gold.
4. This is a bullish development as seen in the SILVER / GOLD RATIO and GDX / GOLD RATIO.
5. Sooner or later, Miners are going to rally and gains in this sector are usually very good %-Wise , once the ball gets rolling. I will find bullish chart set ups in the Mining sector as they develop. I am looking for Low risk entries where the upside is promising and downside is minimal. The future does look brighter for the Precious Metals Sector.
.
Enjoy the rest of you weekend, and thanks for being here at Chartfreak!
.
~ALEX
.
In this section, as a review, I just wanted to post a couple of the interesting or Bullish chart set ups that I put in a recent report last week, or mentioned in the comments section. THERE ARE OTHERS IN PAST REPORTS THAT REMAIN VALID.
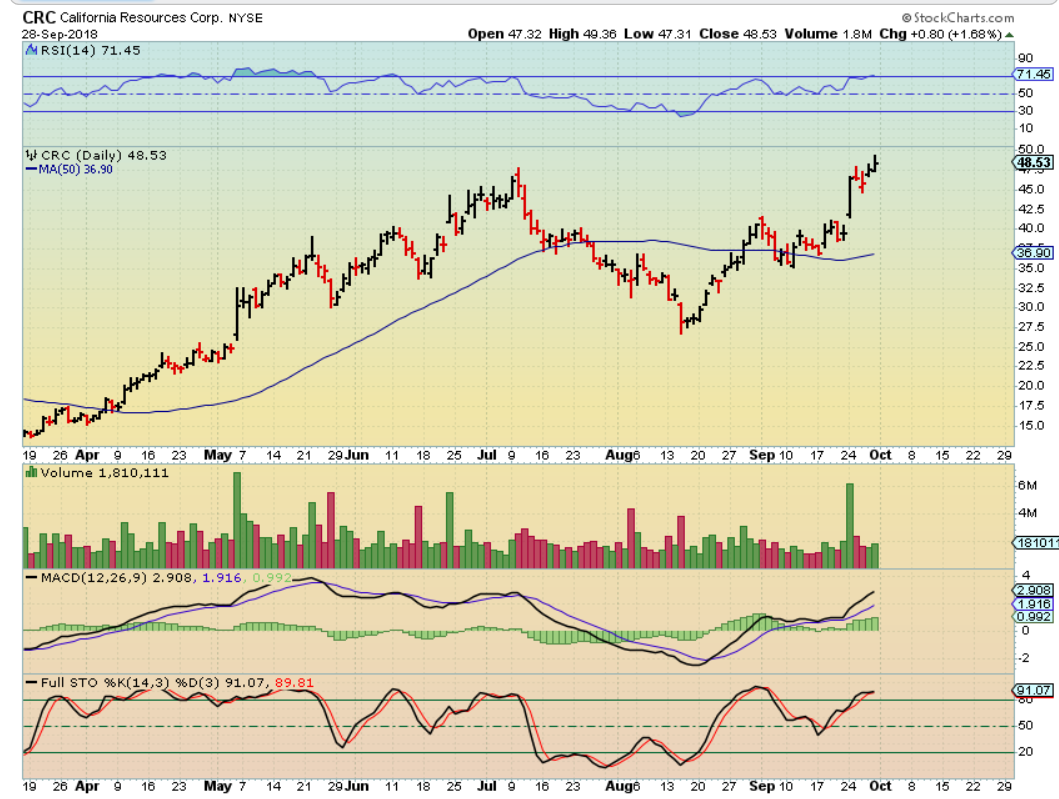
CRC – I Posted a number of BUYS in metals / Commodities and this was a low risk set up on the 50sma at $35 area . I mentioned that it could run to $60 with this set up…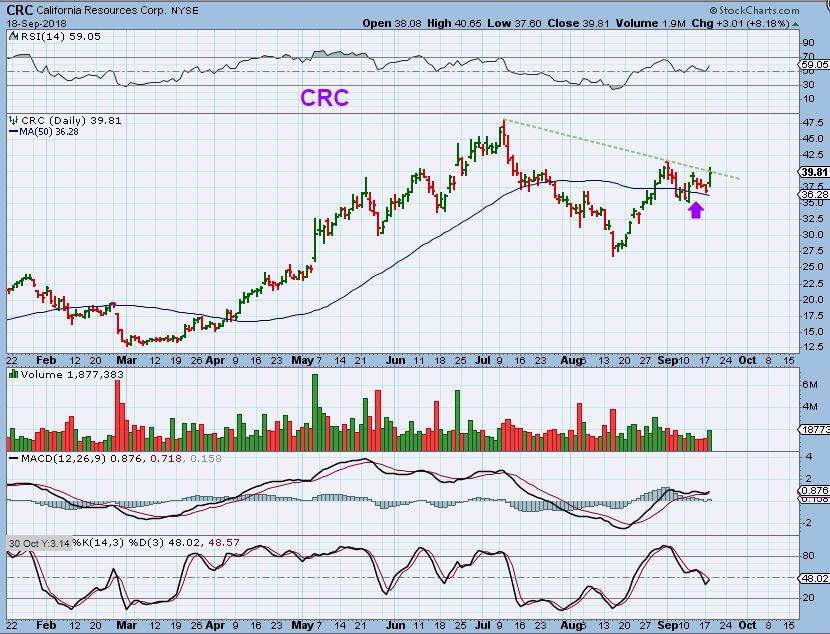
CRC- We see that it is almost at $50 already and it had a nice strong volume pop days after I recommended it.
.
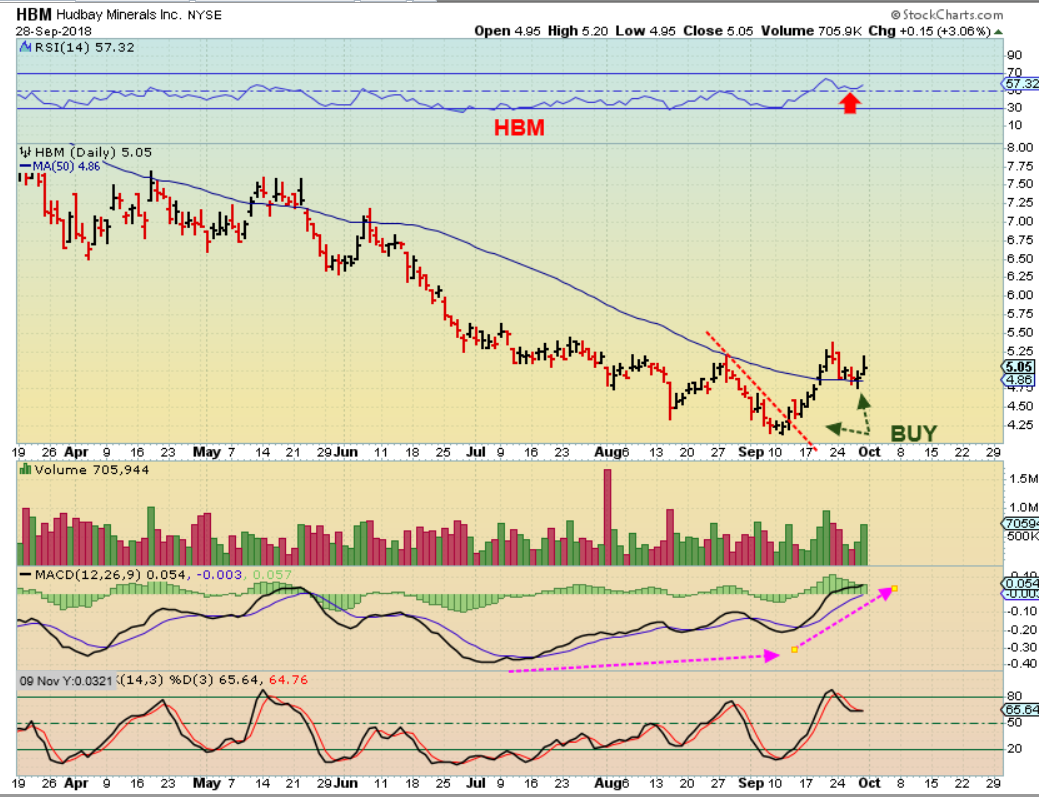
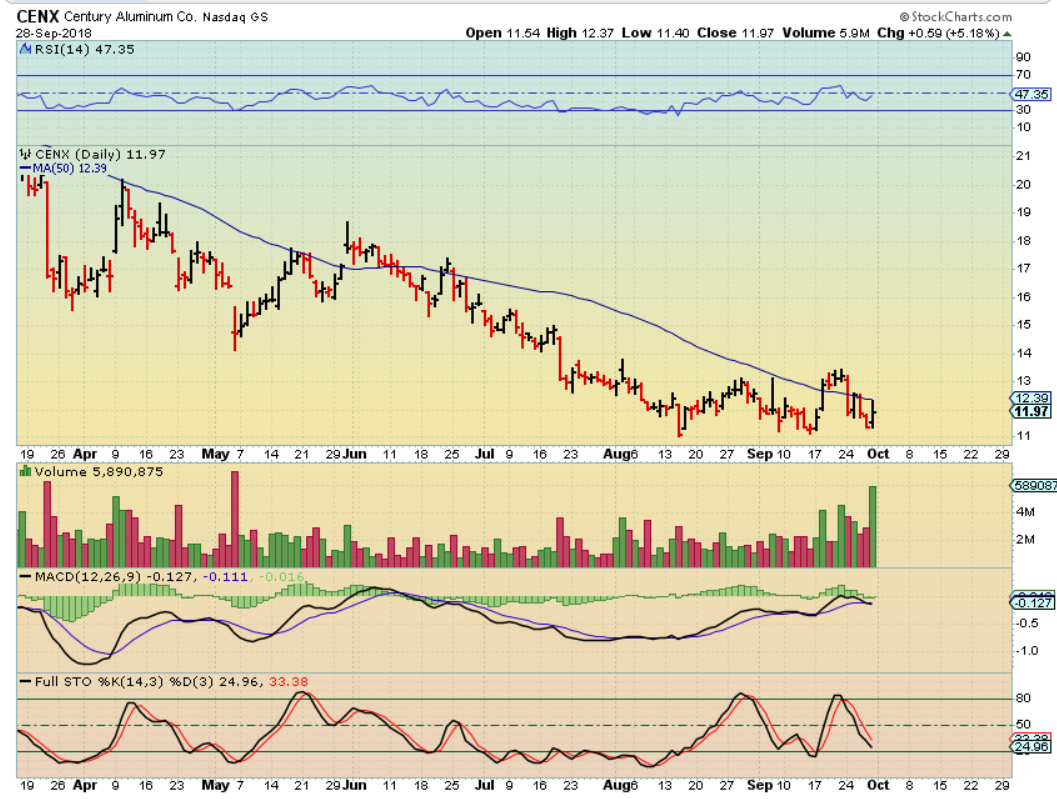
DON’T FORGET ABOUT HBM, X, AKS, TGB, CENX, AA, etc. X, CENX, & TGB Look ready to go very soon, and …
HBM – This is another Buy Point, since it has successfully back tested the 50sma & the RSI held too. Look at that strong MACD move.
CENX – I look for bases with a high volume pop like this, pushing on the 50sma. It is a choppy base so far, but with the metals sector moving higher, This is a buy right here with a stop under recent lows.
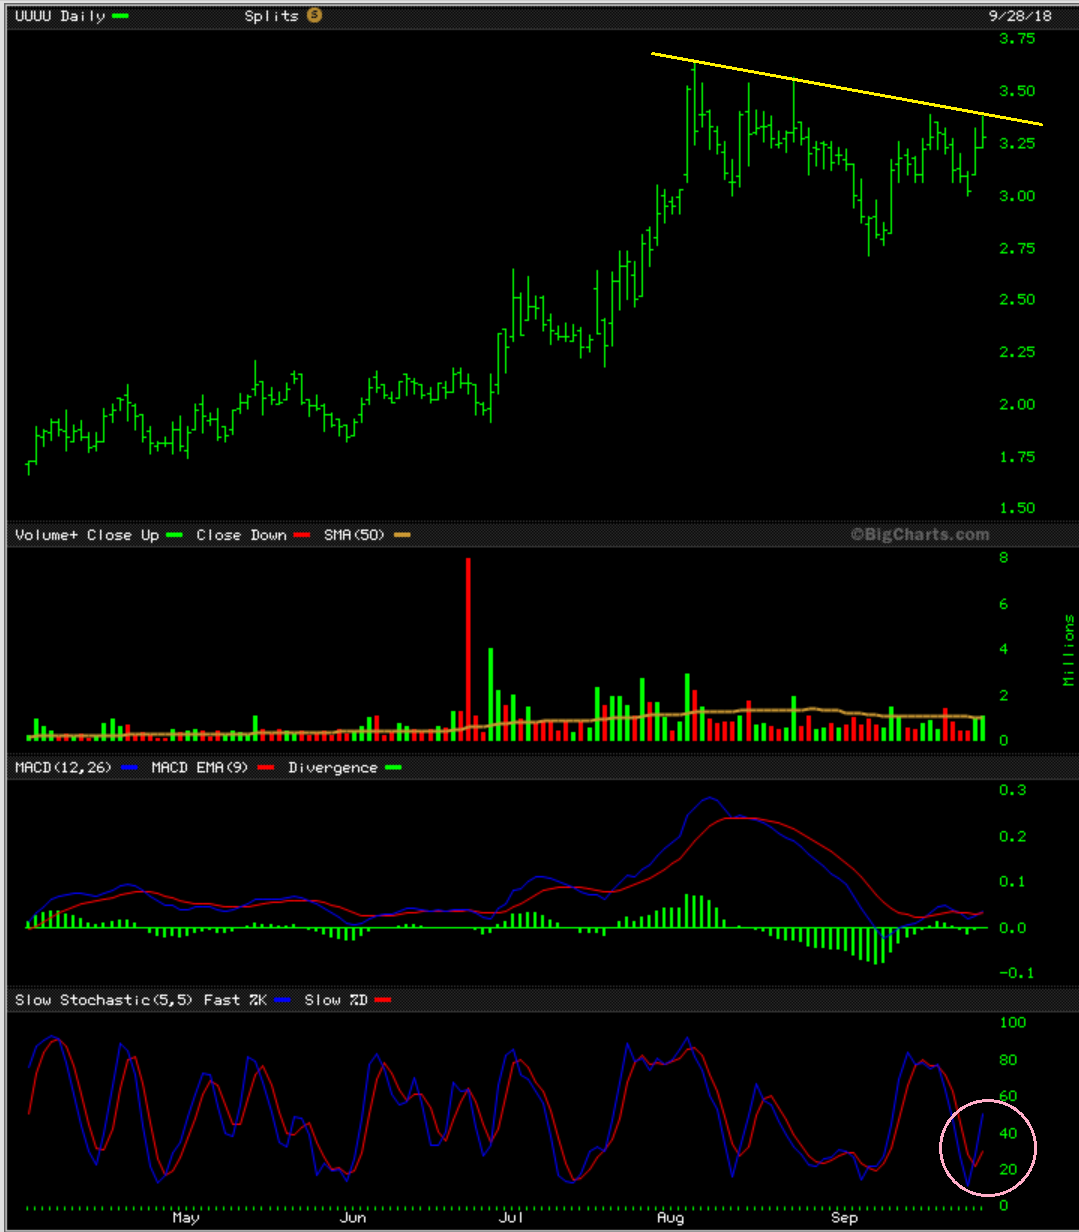
UUUU Sept 27 big picture and I still own it
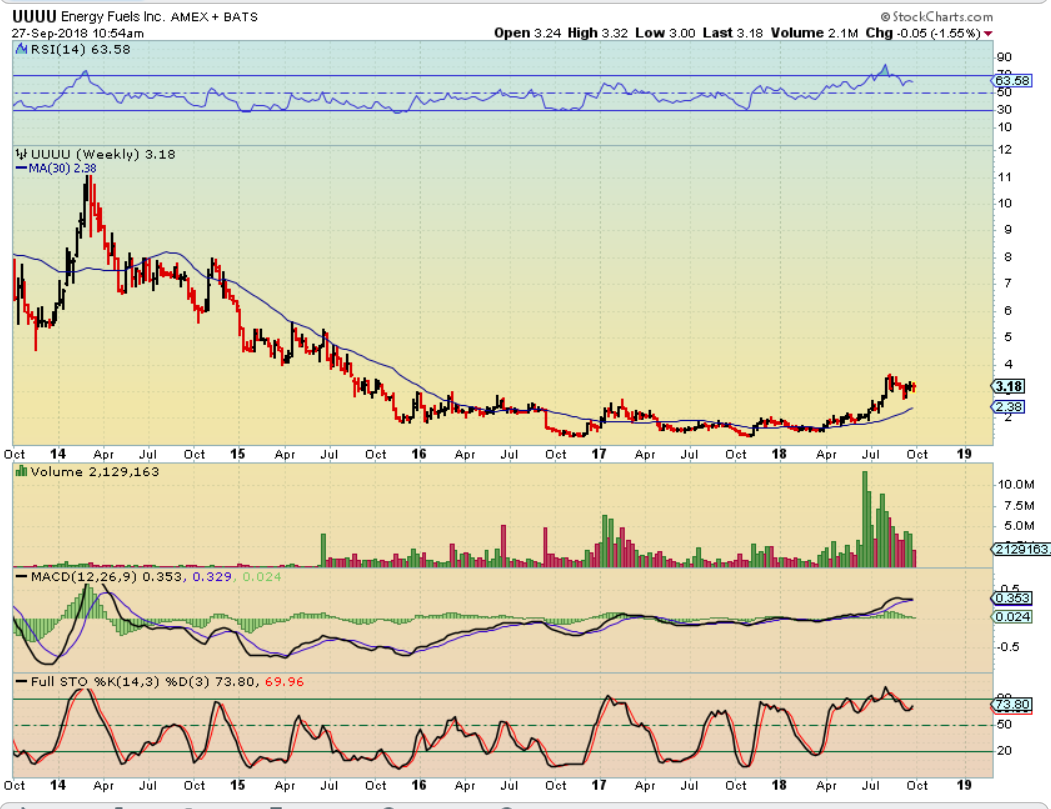
UUUU- Still on track ( I own it) – It almost broke out on Friday, but sold off into the close. One could wait for a break out if they want to avoid the possible further consolidation.
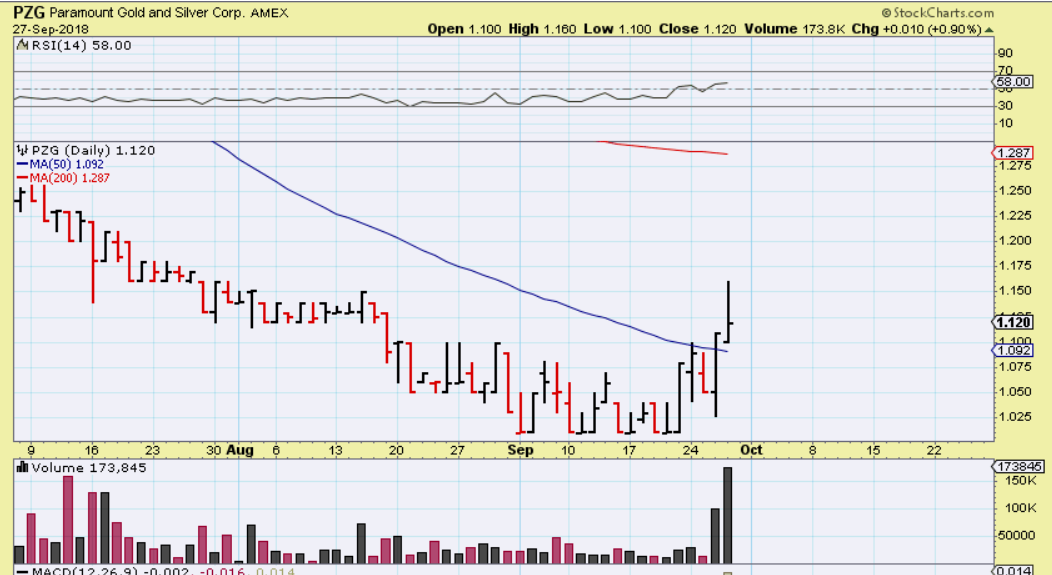
PZG – This Gold Miner had moved off of the lows with relatively strong volume for this one and broke above the 50sma. On Friday it dropped back down to $1.06 on only 29,000 volume, so this may be perfect for a watch list. That does put it back under the 50sma, but that 2 day pop may be signaling better things to come. It did run from $1 to $3 in that Jan – Aug run of 2016. Note: I do not LOVE this one , because of the lower volume, but in a bull run move, $1 to $2 would be nice gains.
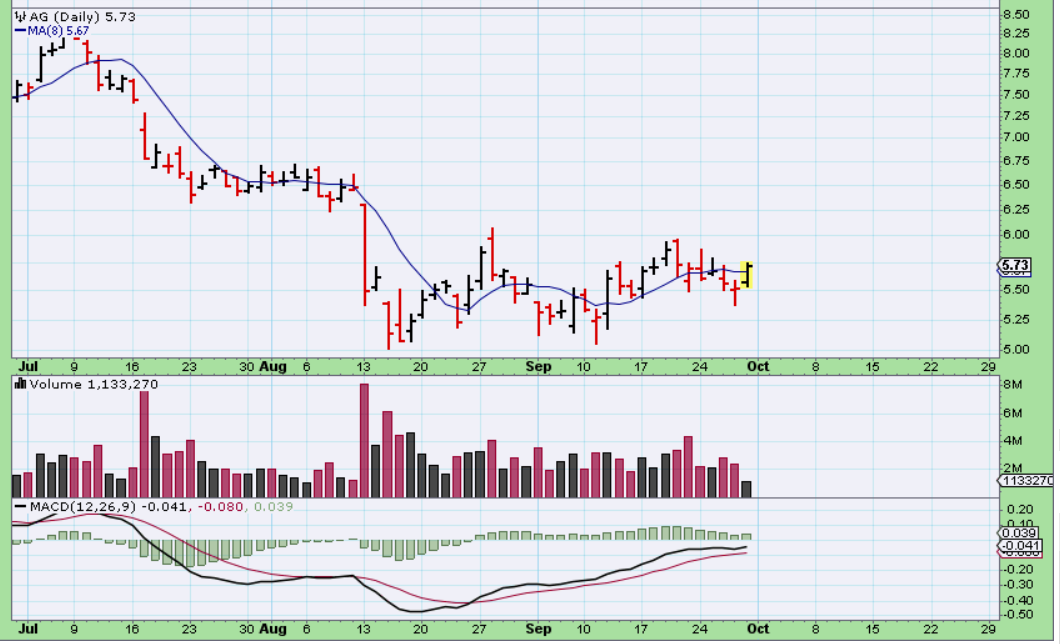
AG – I mentioned this last week and AG is now at $5.68. It looks like a pretty nice base. Some would wait for a break out, others buy the base with a stop under lows. This may remain choppy or it may be ready to break out, but this does look like a good Silver Company at the lows. So it may be good for a watch list for that break higher or for others it would just be a ‘buy & hold’ with a loose stop under $5 or a tight stop under Thursdays lows. .
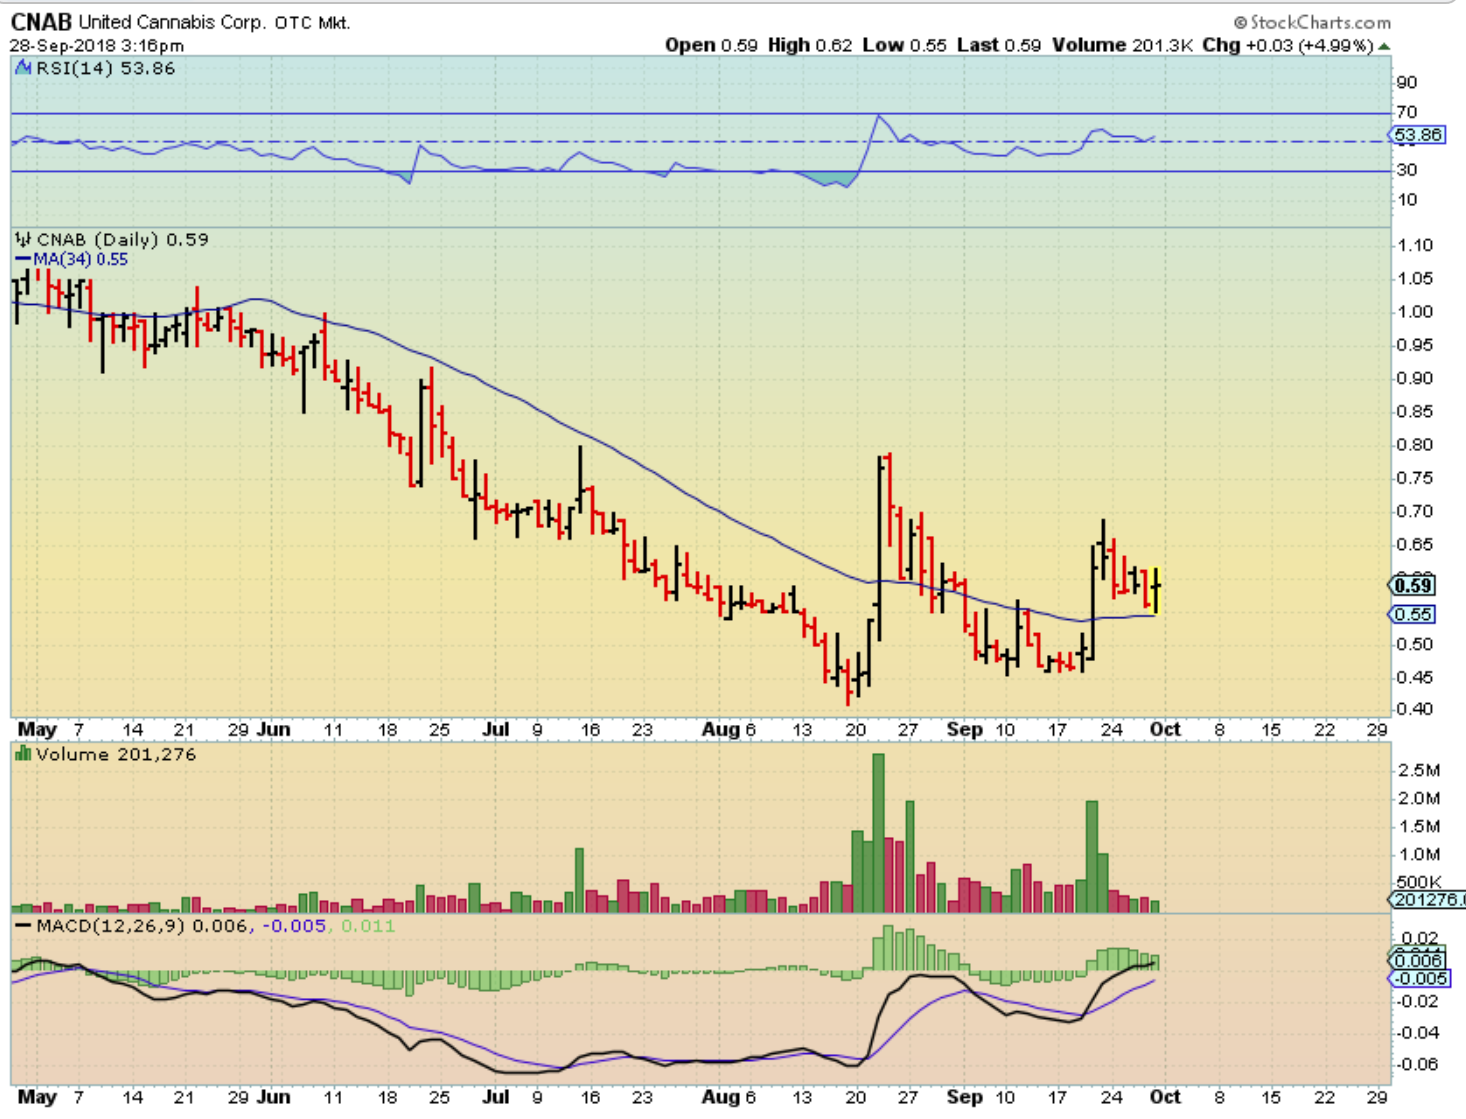
CNAB is an MJ stock that looks to be Popping, consolidating, Popping and consolidation. Often these large POPS happen before a larger POP & RUN, and it now has a higher low with the last Pop. Watch list? The sector is producing huge gains for many.
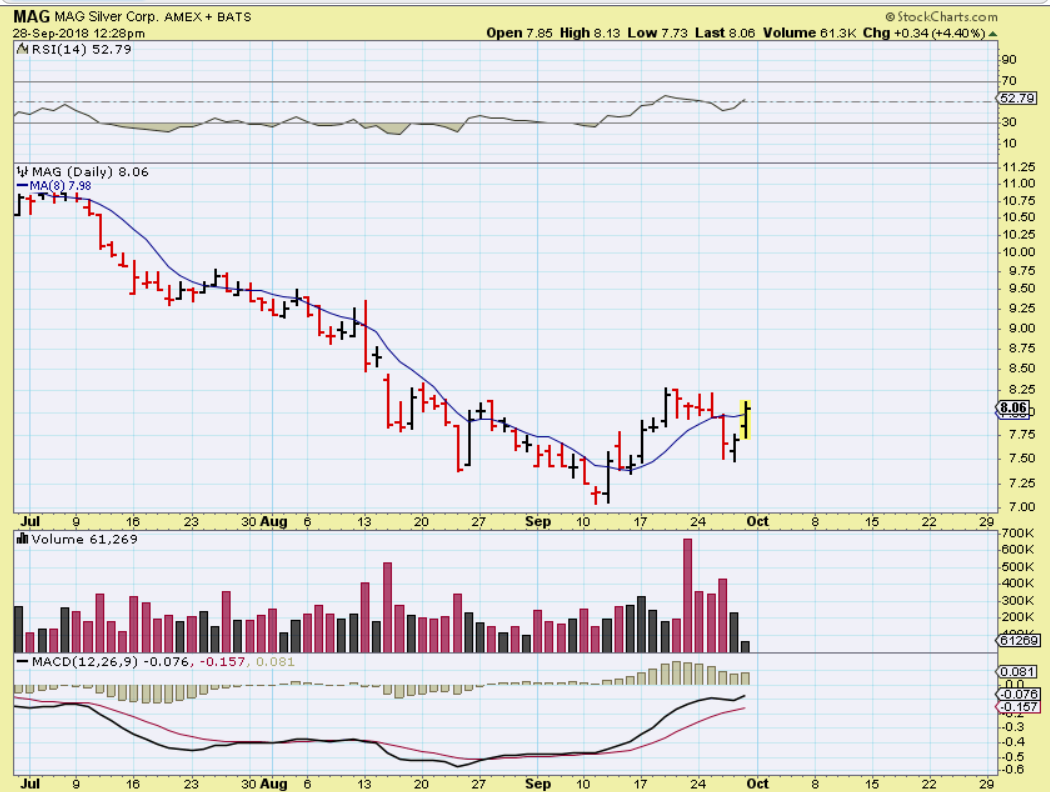
MAG – I pointed this one out in the last report ( Fridays Midday report). It closed higher at $8.11. Silver looks bullish , so now Silver stocks may begin to perk up.
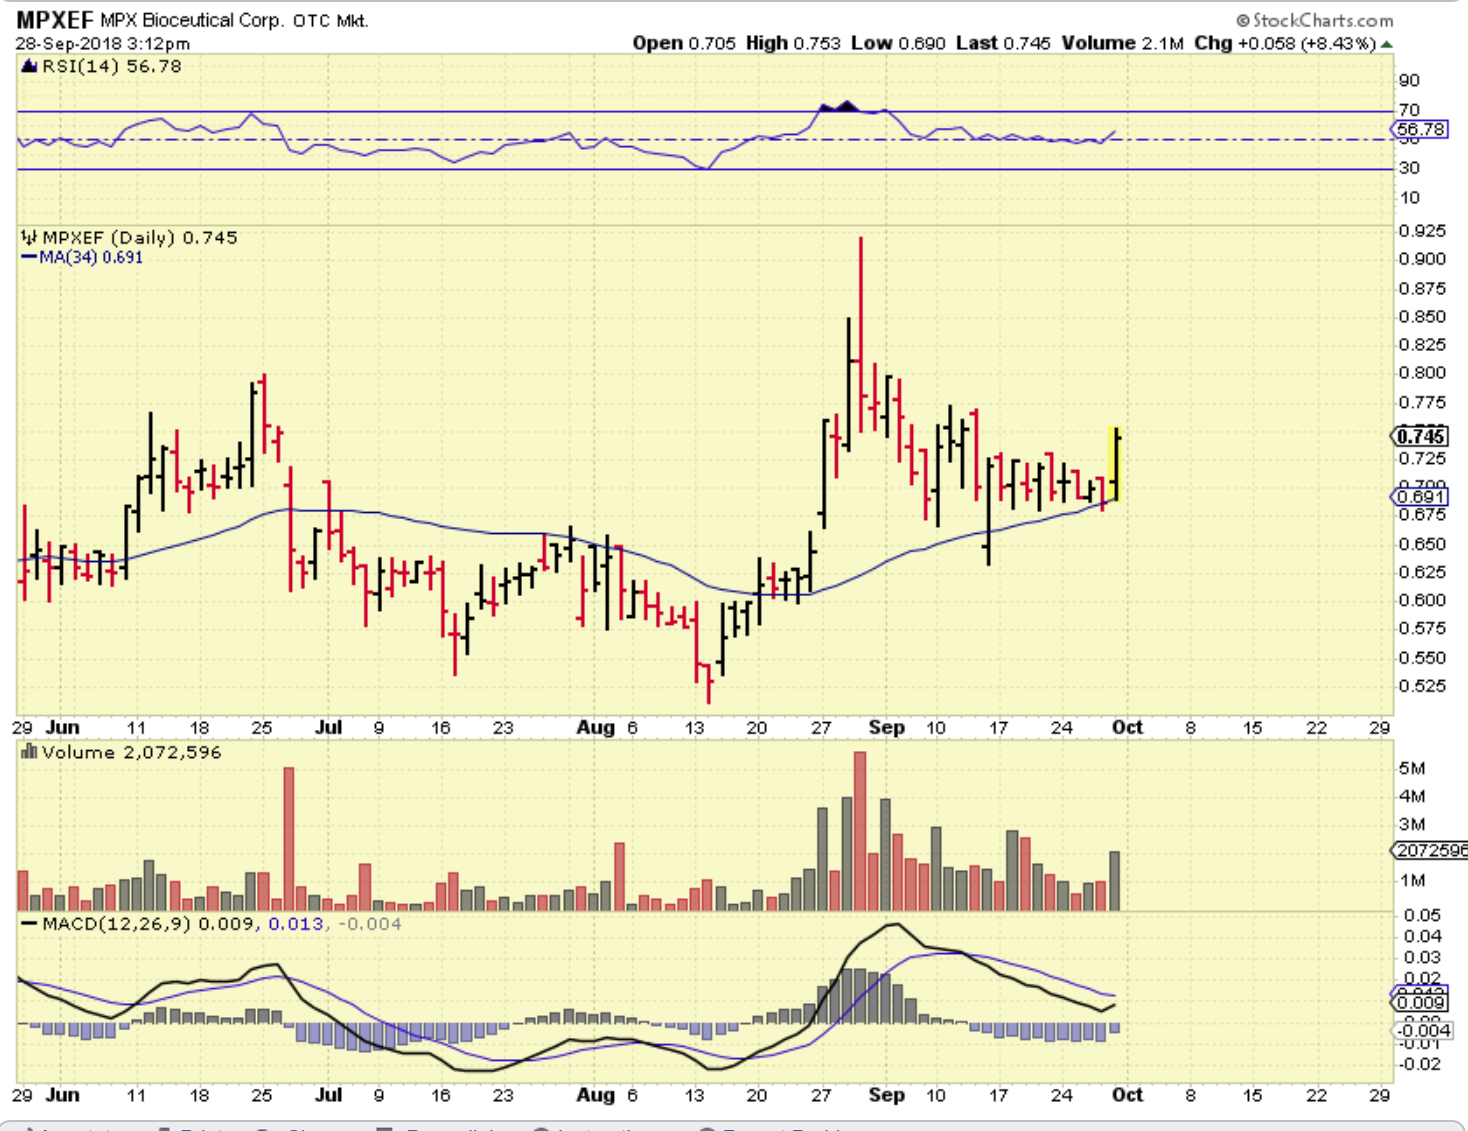
MPXEF – I bought this on Friday as it started to break out from this consolidation, after finding support on the 34 sma. I posted this in the comments section. It went on to close up 12 % and volume was very good.
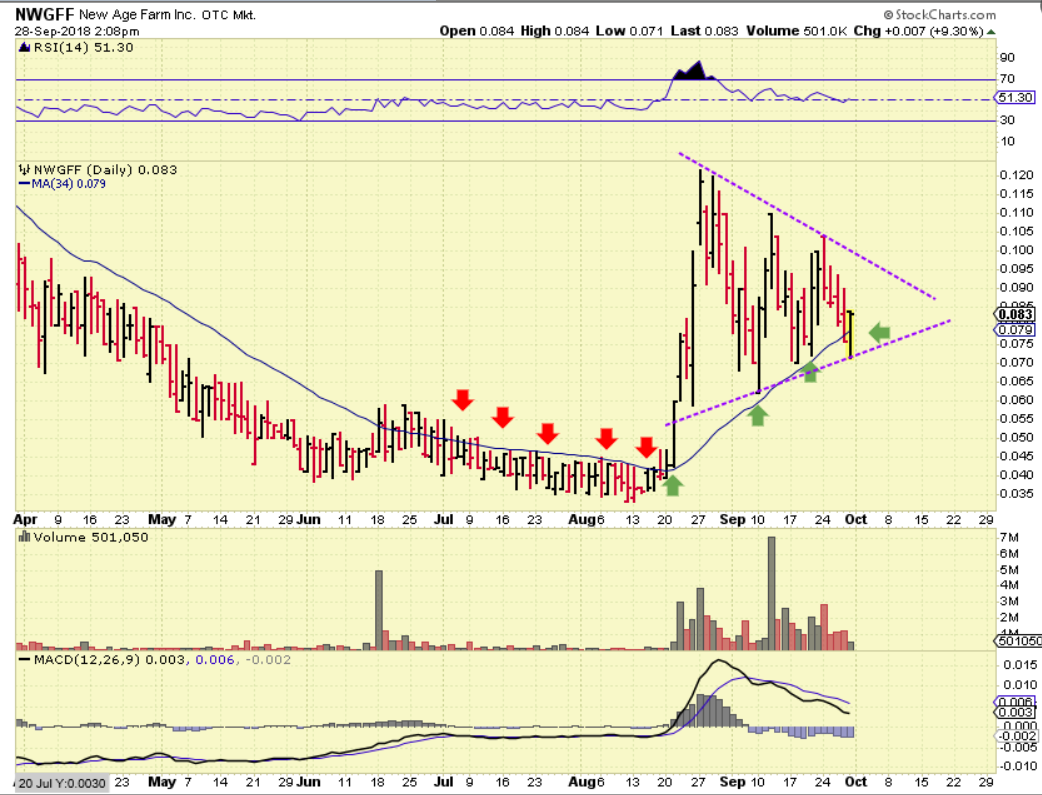
NWGFF – This is forming a triangle consolidation. It may need to finish the Apex, it may break out, but either way it could put in a large %-gain run. That first run was roughly 3 cents to 12 cents. 300% in a week.
Some here do trade all of the MJ stocks, but others have not or will only trade listed MJ stocks or the ETF MJ. A pull back in some of these listed stocks could help. I have a feeling that many more stock picks will be popping up in Metals, Precious Metals, and possibly the Energy Sector too.
So if the Medical Marijuana,Biotech and General Markets continue to produce,as well as the commodities, there may be something for everyone to get excited about, and the end of the year could prove to be quite rewarding.

