HORRIFYING! … Or…???
You are likely hearing the same thing that I am…
.
– “There is something incredibly wrong here, Miners have sold off before, but never like this!”
– “We have NEVER seen a drop like this in Miners, GDX will be in the single digits next week!”
– ” This is much worse that 2008″
.
It is even possible that this kind of fear and panic can affect how you feel about what you see. Yes, the sell off in the Precious Metals is steep, and it is the talk of the town. This week the drop in Miners has been extreme, as you will see, but is it really the worst drop ever? Does it automatically make Miners destined for the grave? I want to address this in light of these statements above first, and then I will still cover the General Markets, so let’s begin…
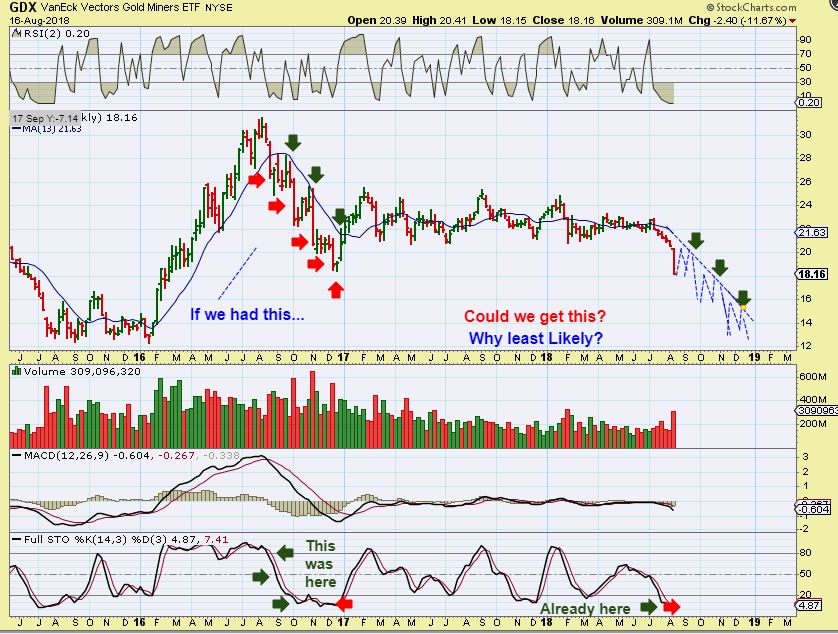
GDX – GDX closed down 2.37%, and the last couple of days have been crash mode, no doubt about it. I mentioned in yesterdays report that the volume looks like capitulation. This is a very sharp drop, however…
Now let me show you something that you may find interesting. It might even blow your mind …
(This is an extremely long Friday report, for an extremely sharp drop)
Did you notice that GDX was perfectly fine last week, with a normal sell off into an ICL. Then, the last 4 days of trading has freaked people out. This is a often called capitulation flush, and has caused widespread panic.
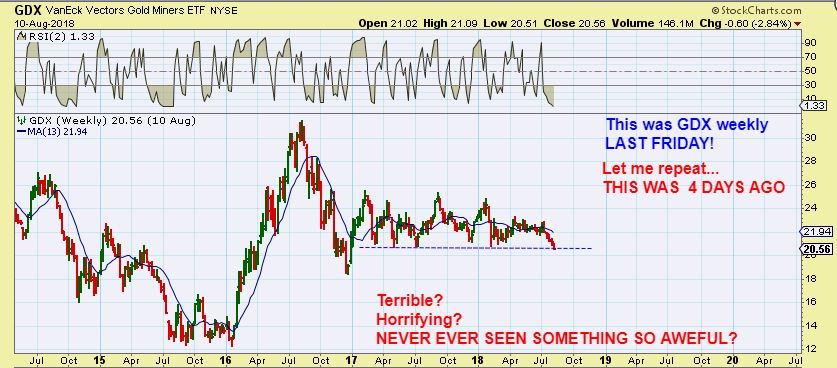
GDX WEEKLY – Again Friends, this was GDX only 4 days ago. Yes, I thought we would get a simple stop run at that point last week, maybe to slightly below $20, but it dropped with a flush of panic selling to below $19 in 4 days… (Read the chart)
.
This has been one of the trickier ICL drops that I have seen, mostly because it flushed so rapidly, it went from ‘holding up ok’, with Miners even rising on earnings last week, to a FLASH CRASH this week. Let me show you something…
.
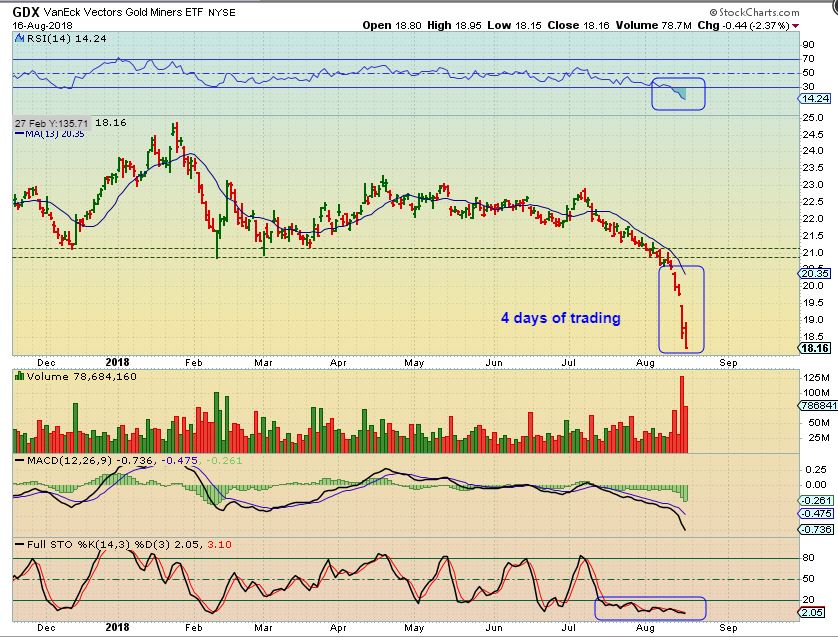
GDX WEEKLY – This 4 day crash is a big 1 week drop, I agree, but now I am hearing that ” This is so different, we have never seen this kind of sell off !!” I actually see 1 week drops like this on this chart in several places, do you?
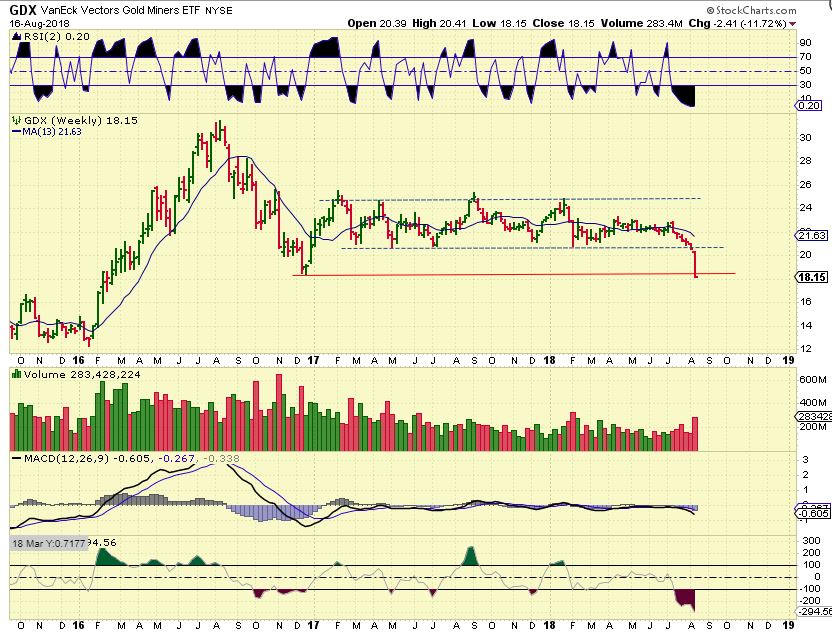
SAME CHART: I admit that I expected a normal shake out, we got more, and we got it in 4 days. We seem to be in capitulation flush, or panic selling. It should exhaust, but it could drop further. Extremes do get extreme. SIDENOTE: I would think that everyone should be stopped out of their Miners by now? My emails tell me otherwise. People tell me that they are adding JNUG on each morning bounce this week? I expect a rally ( or bounce at least) but Yikes, I did NOT recommend that. You should set tight stops immediately, right? If this dropped like the endd of 2016, that could be dangerous. Now let me discuss this further…
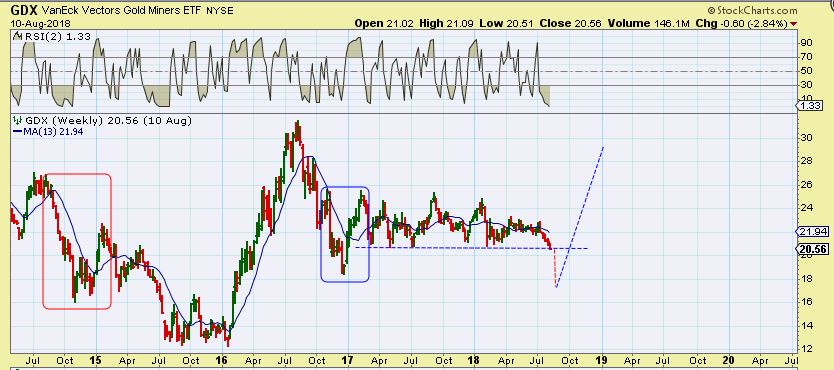
SAME CHART AGAIN: I still expect a strong short covering rally, this sharp drop could just end line February 2017 or Feb 2018, but CAN THIS drop further? We can’t say no, because now they may want to run the Dec 2016 ICL lows further. You have to just protect yourself, and you can always get back in later , especially if we have a 2016 type rally…
– You can always get back in later if it does this drop & recovery as drawn here, and it can. I actually still feel that we will rally sharply with Massive shorts in place by Specs now, but some emails & comments are scaring me, saying they have been buying JNUG on morning bounces or Miners and doing so without stops? That is way too dangerous and against the safe way of waiting for a confirmed swing low now, or ‘ Always use & honor stops’.
.
Now let me show you something else…
.
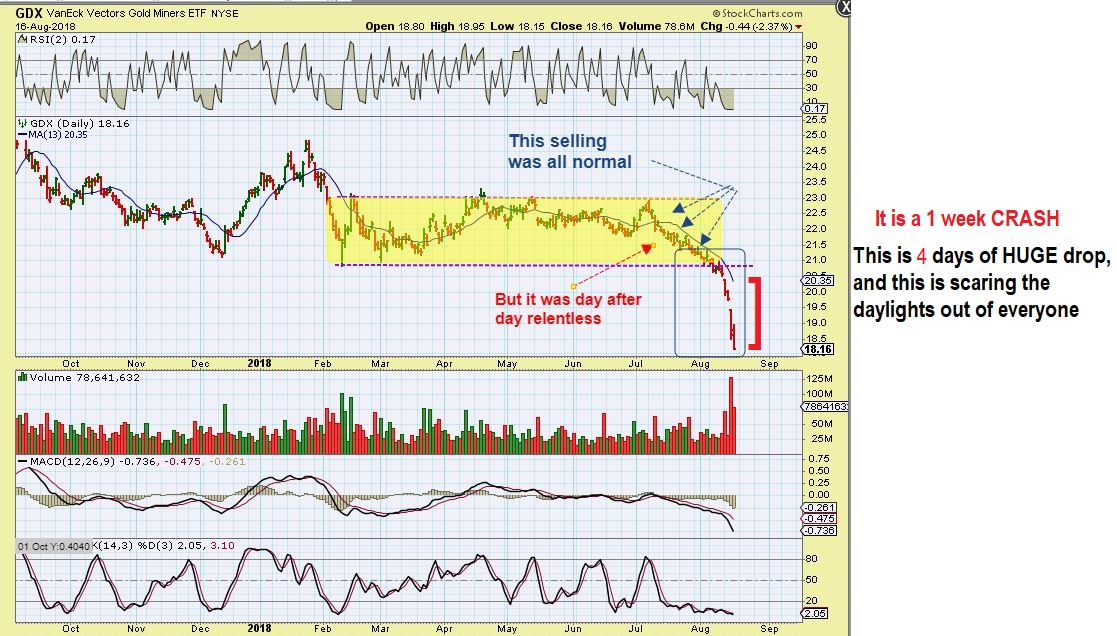
SO IF THIS WAS NORMAL SELLING UP TO LAST FRIDAY, what does that say? It says that the last 4 days have done the mental damage…
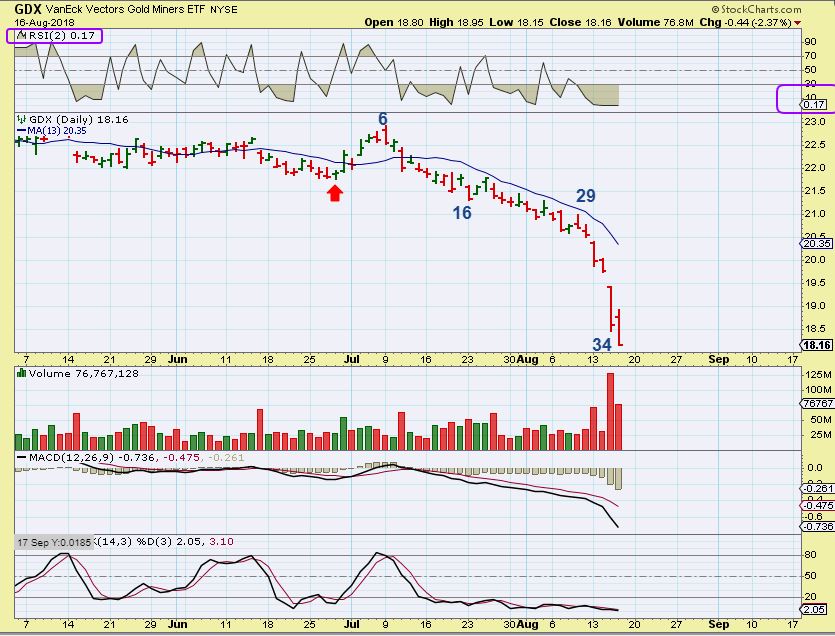
GDX DAILY 1 – The selling has been normal UNTIL THIS WEEK. We have actually only had 4 days of dropping off of a cliff. Read the chart.
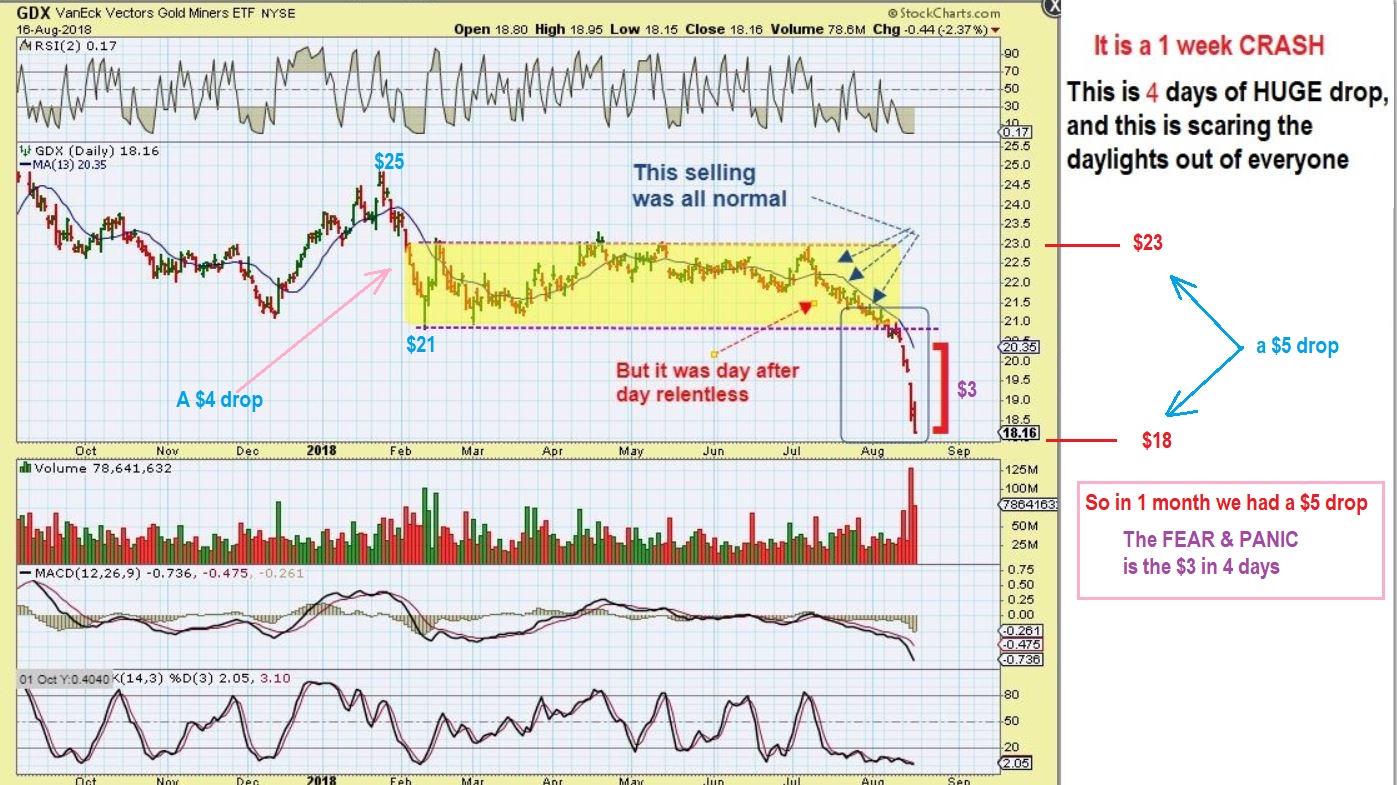
GDX DAILY 2 – The selling was a rather normal drop into an ICL until this week, but we just saw a $3 drop in 4 days alone. So we’ve dropped $5 total so far into this ICL. Didn’t we see GDX drop $4 in February too? So this is not that abnormal. Please read the chart.
.
– “There is something incredibly wrong here, Miners have sold off before, but never like this!”
.
GDX – This sell off into an ICL looks small so far compared to others at this point, doesn’t it? NOTICE: We just dropped from $22 to $18 ($5) in 2 months. We have NEVER seen a drop this bad? I have seen $26- $16, $23 to $12, and worse into an ICL. Read the chart.
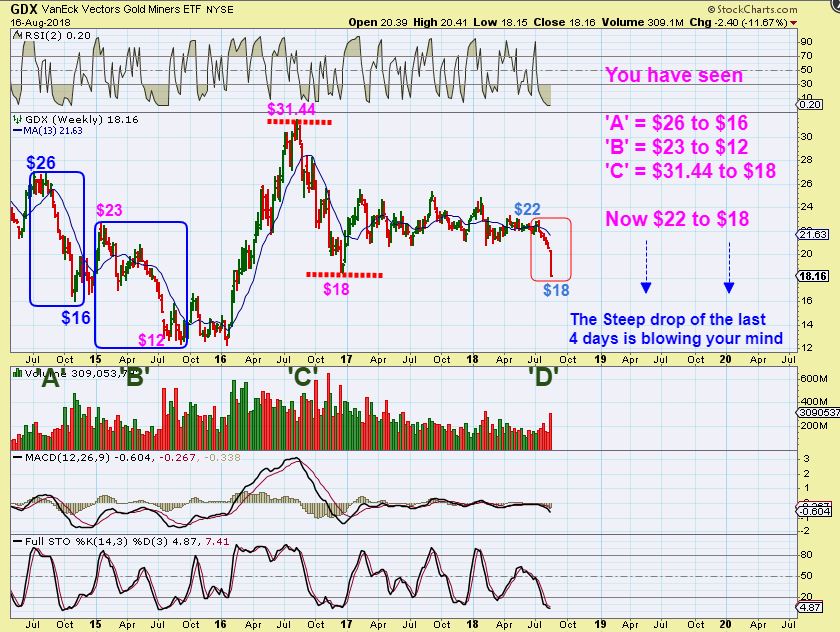
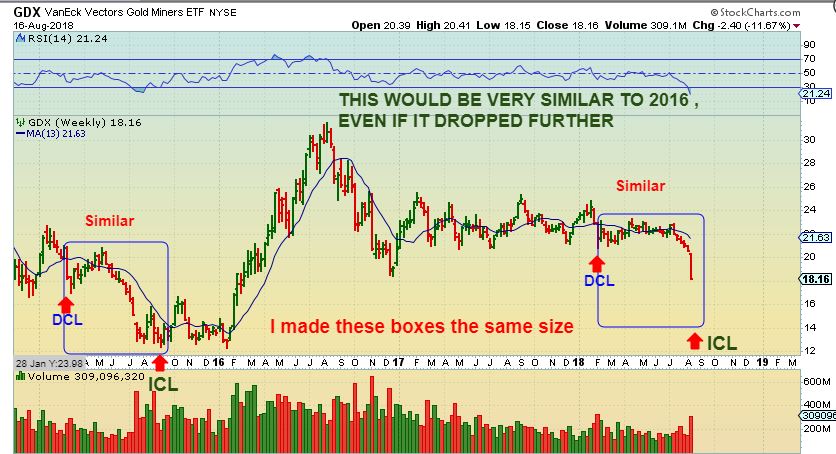
I HATE TO SAY IT, BUT THE SELL OFF IN BOX 1 – TO THE SUMMER 2015 LOWS, WAS DEEPER. I made these boxes exactly the same size. But this chart proves that we have seen worse selling, it is just that the last 4 days has been scary.
GOLDS sell off has been non-stop and a lot more ugly than Miners. Miners are now playing catch up this week, dropping all at one. I will say this: If we Don’t recover a lot of ground on the coming rally / Bounce, then this could become bear market type action again. Notice that drop after the rally in 2016. It went s, bounce, slam, bounce, slam, but it was NOT a long bear market drop. It just felt like a bear market drop. I will discuss this further at the end of the report. As of right now, this drop in Miners is not the worst we have seen, but it is a 4 day unexpected flush.
And, if you keep buying JNUG on intraday bounces with no stops or even Miners without stops in a flush drop? It probably feels like someone is using your stomach as a trampoline. WAITING FOR A CONFIRMED SWING LOW, N+AND BUYING WITH A STOP IS SAFER.
.
GENERAL MARKETS
.
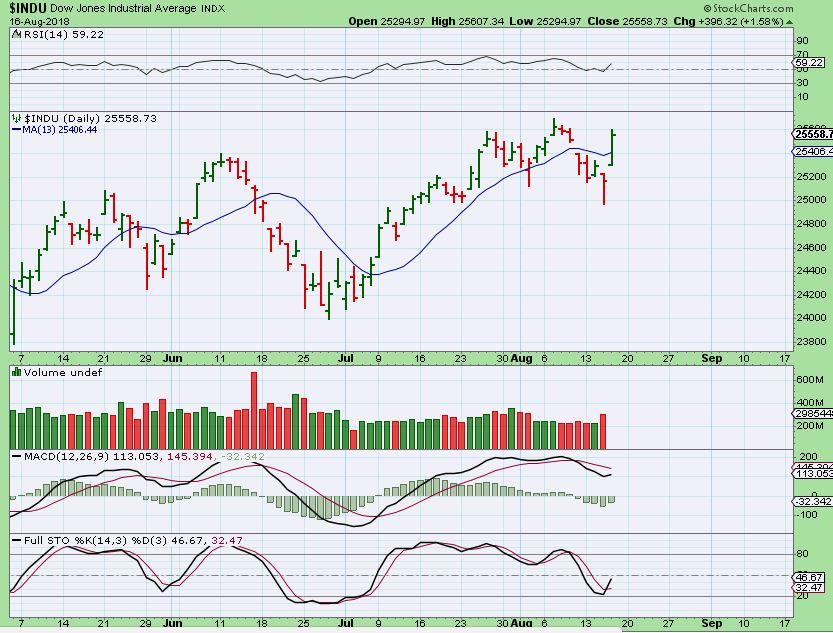
DJIA – This was the weaker section compared to SPX & NASDAQ, but this is a nice Pop. The thing that really made it look good is the weekly chart. It popped strongly and closed well above the 10sma, so That almost looks like the DCL that I have been expecting. Let’s look at SPX & NASDAQ.
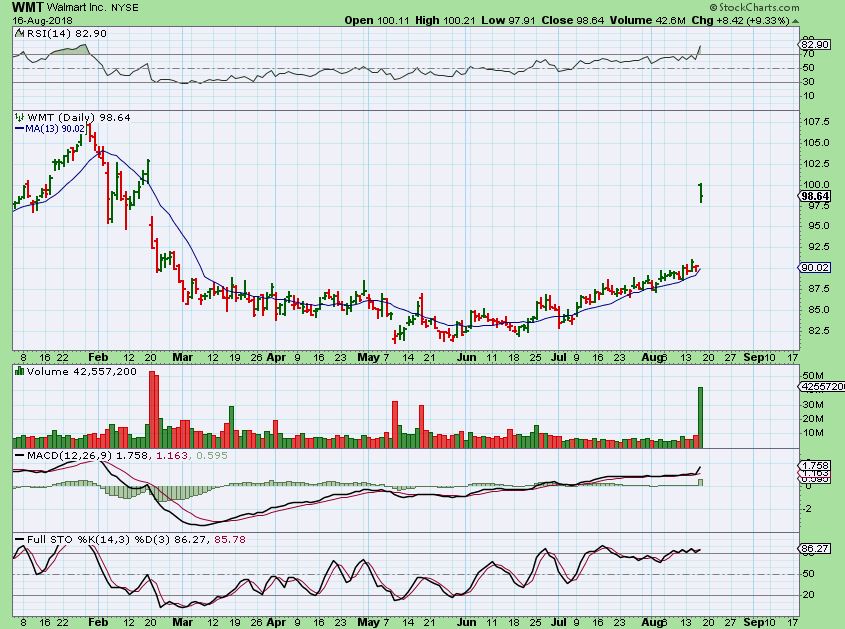
WMT -Was Walmart what propped up DJIA?
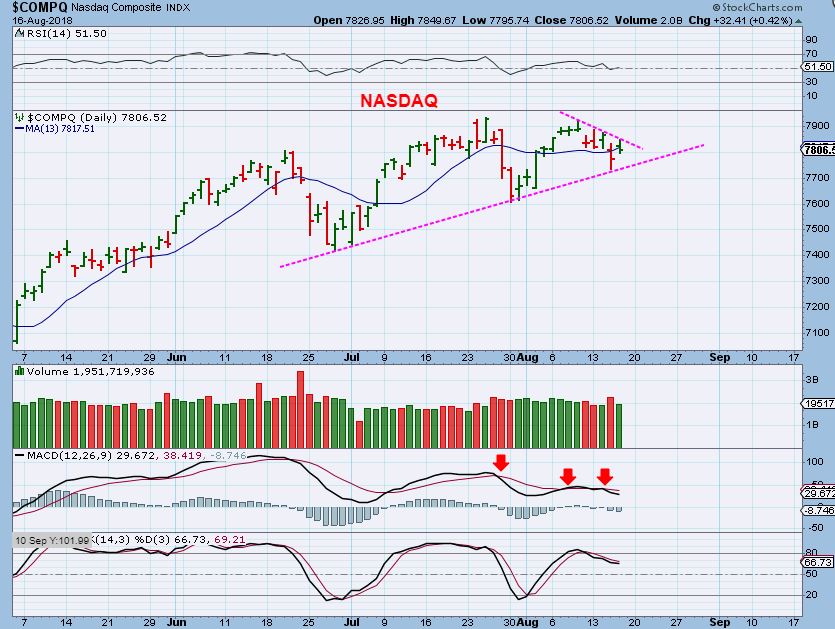
NASDAQ – I was away from my computer all Thursday, so it’s hard to know what was going on. I got an email about the “Rally” and could I post some TECH PICKS. This is weak. Look at MU, AMAT, NVDA, and a few other tech stocks and it is a mixed bag, but a lot of weakness suddenly. I don’t see a big rally here, like the DJIA. What if the DJIA is signaling a DCL? If you want to be long the General Markets, You could buy this with a stop under the magenta line. I was expecting a dcl, but at this point, I really don’t feel that this looks like one as much as DJIA. What about the SPX?
SPX – A DAY 33 low, this Might be a dcl. I see that it Gapped open & ran up, but then sold off into the close. It was still up and above the 10sma, so this might tag that upper line again.
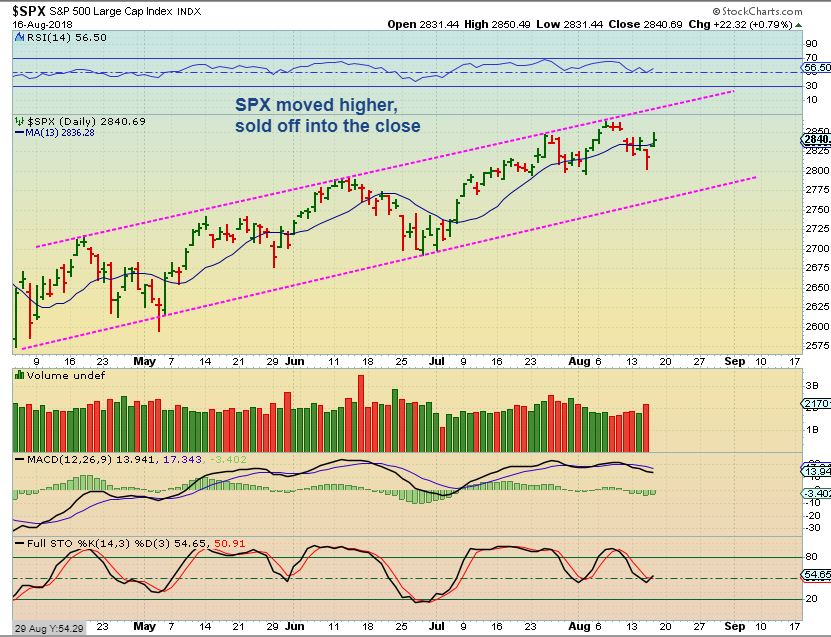
So the General markets remain a bit Mixed and choppy, with the DJIA suddenly looking better than the SPX & NASDAQ, and the NASDAQ looking lack luster at this point.
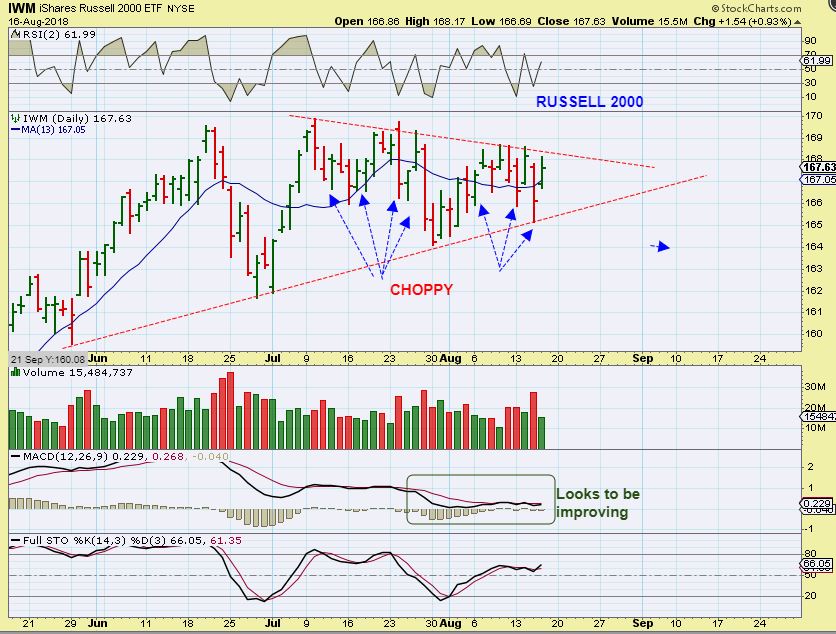
IWM or Russell 2000- This has been choppy, but this looks like a constructive consolidation. I’d Watch it daily for a possible break out higher.
.
It is Friday, the last trading day of the week (and Option Expiration), so let’s just discuss GDX one more time.
.
GDX WEEKLY – Heading into the final daily cycles lows (ICL ) of July 2015, GDX dropped from a daily cycle peak of roughly $21 to a low of $12. An $8 drop. It also started slow with small daily selling similar to now. It ended with a crescendo – a Capitulation slam. At that time, I remember EVERYONE screaming that Gold HAD to drop to $1000 or even $800. Fear was everywhere. The 2016 Rally erased all memory of that time period.
Also looking at the above chart, We currently have a $5 drop, and a large 1 week slam. The fear of this 1 week drop has people hating Miners, as predicted. So far, it just looks like a sharp 1 week sell off. CAN THIS GO LOWER? Yes, but it is due for a bounce or short covering rally. At this point, I would have expected that everyone is stopped out & waiting for a reversal before re-entering. ( I am hearing that some bought JNUG all week & Miners with no stops).
.
We can’t say that GDX will not drop any further, conditions are extreme, however…
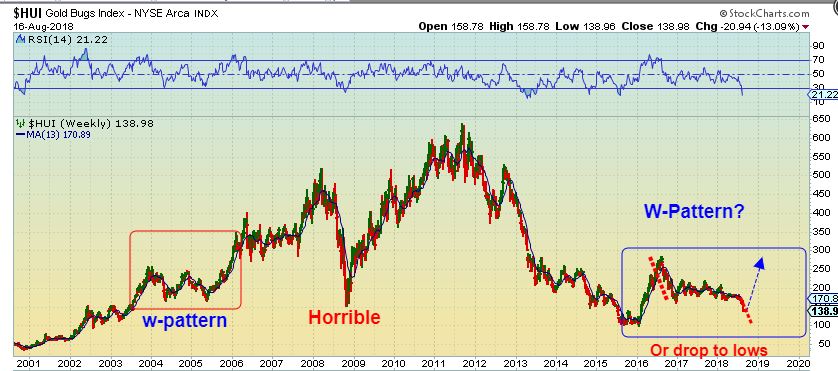
Current conditions are extreme and favor a change soon. We are at a point where The COT is extreme , Speculative Shorts are MASSIVE and will have to cover, Everyone is bearish, and a short cover rally could spark a rally and snap this back up quickly as drawn. That is still a possibility. IS THIS ‘W’ PATTERN POSSIBLE?
This is an old chart, but it was HUI in the BULL MARKET of 2004. “W” PATTERN sell off. Look at those sharp sharp weekly drops into the May ICL. This was very steep, very scary & horrific, but it was a bull market correction.
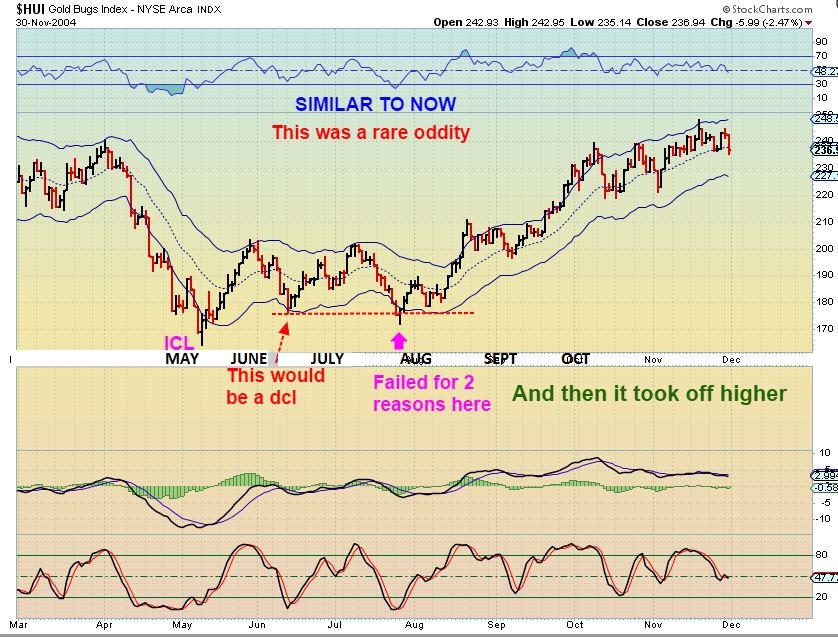
We could Bounce & do a W-Pattern rally like 2004 – We could do a drop as shown and test the lows, which would be absolutely unexpected.. NEVER BUY WITHOUT STOPS
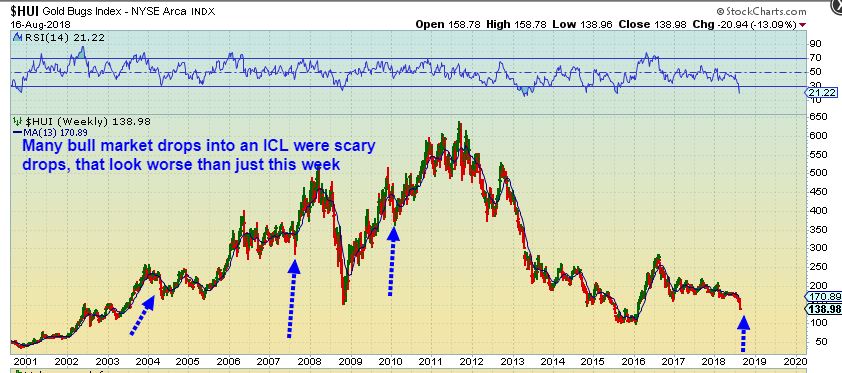
MANY ICL DROPS BY MINERS WERE SHARP, AND IT REMAINED BULLISH, SO WE NEED TO SEE HOW CURRENT CONDITIONS PLAY OUT. Things look Extreme with the shorts, COT, Sentiment, RSI2 trigger, etc. We should get a bounce soon, and we can watch that, but if you own anything? ALWAYS USE STOPS, you can always get back in.
AFTER GDX broke down, my recommendation has been ” To be safe, DO NOT BUY UNTIL WE GET A CONFIRMED ICL.” I’m getting emails that people are buying JNUG on the morning bounces, and not selling yet. A trader would use a stop, buying & holding now is DANGEROUS or UNPREDICTABLE.
.
The W-Pattern GDX CHART again : Look at the 2 squares with Slam Down Lows. The Red One is a long bear market drop, way worse than this drop. Even that drop did rally, and then roll over. We should rally soon, in my opinion. The Blue one is SLAM into an ICL and instant reversal Recovery Rally. I have seen that before too, and we want to see how a move out of the lows takes place. GDX RSI2 is calling for a bounce soon, and we can examine that bounce when it happens. What will I be looking for?…
.
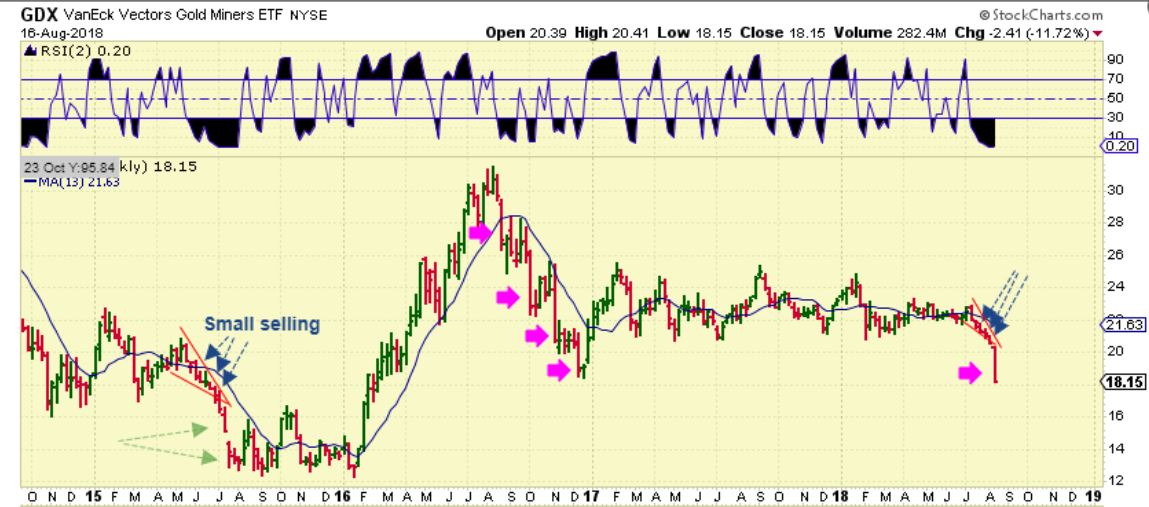
GDX – Notice that the sell off in 2016 was only bouncing to the 13 week MA. I will be watching that…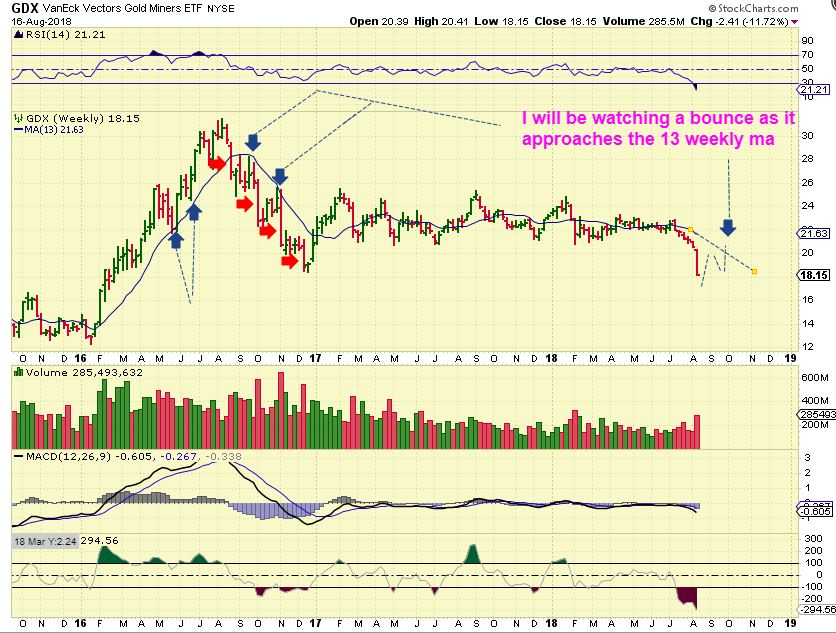
GDX – I will look for bounces at the 13ma. ANYTHING CAN HAPPEN, but I really do NOT expect that we get another drop like 2016 from here. Why? Because that was coming from the Top of a massive rally (2016) . We were very overbought on the stochastics in 2016 when that drop started in August 2016 (See chart), but now we are already over sold. I would think that this drop would exhaust soon. The COT, Sentiment, RSI2 , etc. etc. etc .
.
So at this point, what should you do?
.
To be safe, wait for a swing low confirmed
.
I still have to imagine that most have used reasonable stops and have been taken out of many Miners if not all of your Miners with this selling ( Or took a hedge to soften losses). IF NOT, this last 4 days alone has been an eye opener. MAGENTA ARROWS show prior similar drops & Bounces.
.
This past 4 days has made die hard Gold bulls, die hard. We need to protect funds, and one can always get back in at a confirmed ICL. Friday is Options Expiration, and maybe that will clear the way for some short covering. If you have been stopped out of positions, it is best to wait for a swing low, and do not try to catch bounces with leverage in a capitulation type flush, unless you are an experienced trader & that is your intraday style.
.
Have a good weekend!
.
~ALEX
.
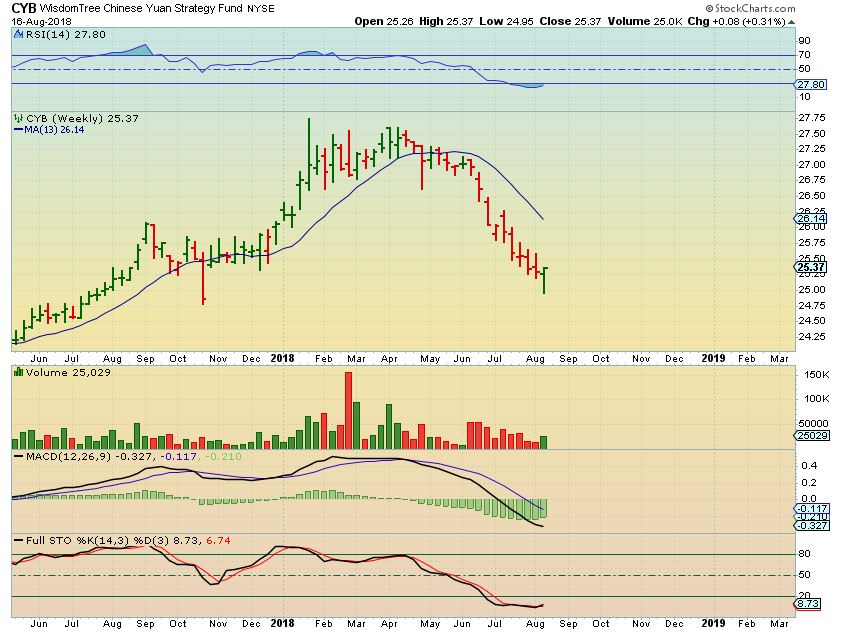
If the YUAN & GOLD are pegged, these are a good sign too
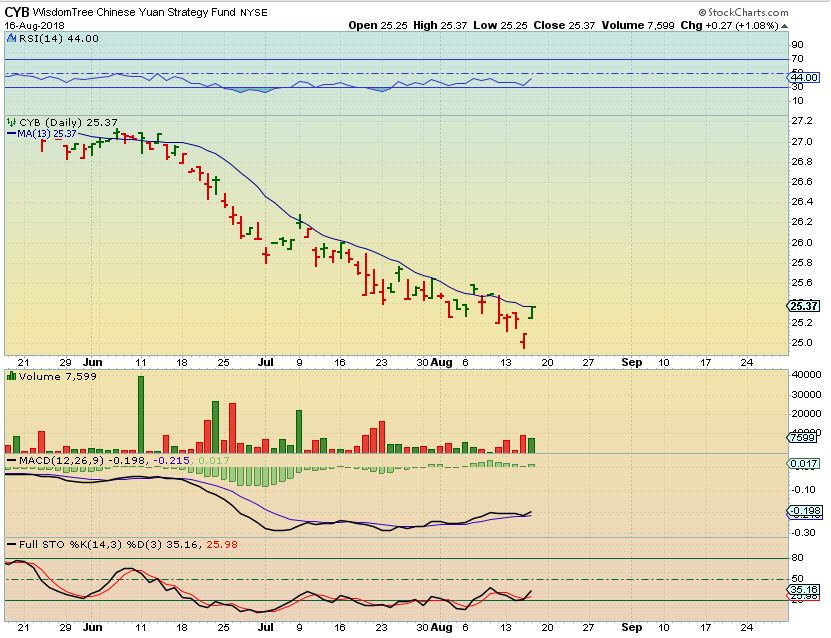
CYB WEEKLY