AUGUST 4th Weekend Report – It Looks Very Close
In the weekend reports, we take a step back and try to look at the big picture. It looks like we are VERY CLOSE to some changes. Let’s take a look…
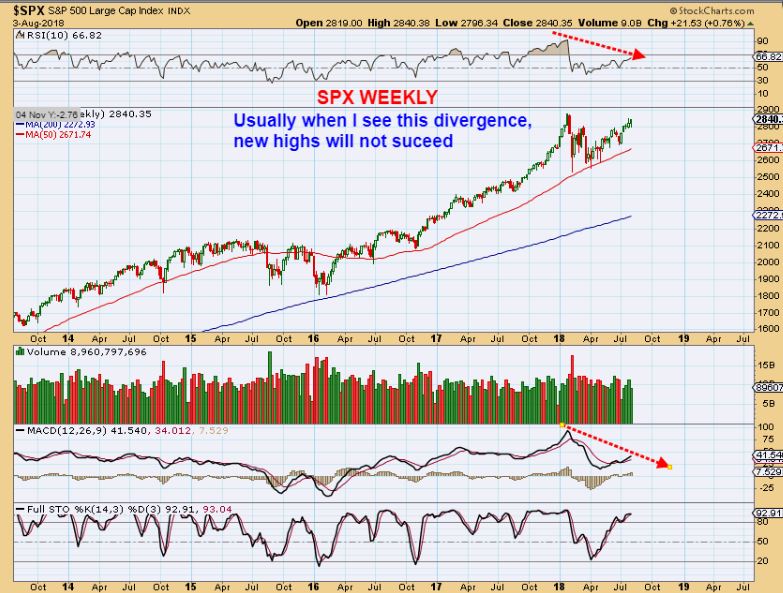
SPX WEEKLY #1 – I have been discussing this divergence. It is not a sign of strength at the highs, though the big picture is obviously a bull run. Bull runs can & do pause and falter as the consolidate recent gains, see 2015 into 2016. This can take months. Read the chart.
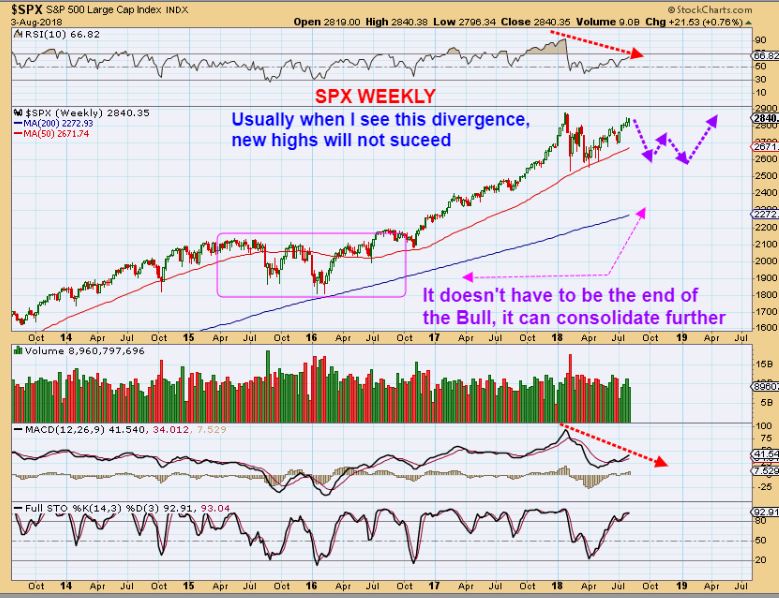
SPX WEEKLY #2 – Again, Bull runs can go choppy and difficult for weeks, months, even years, as seen here. Read the chart.
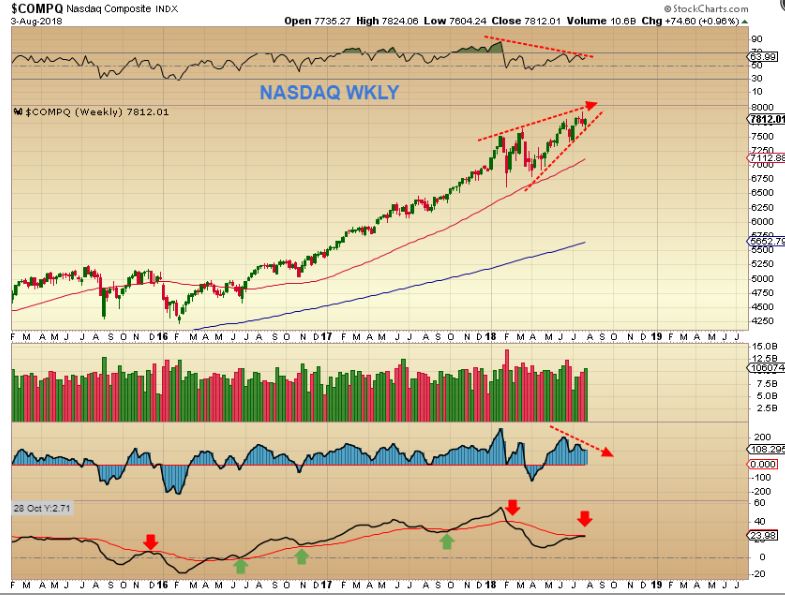
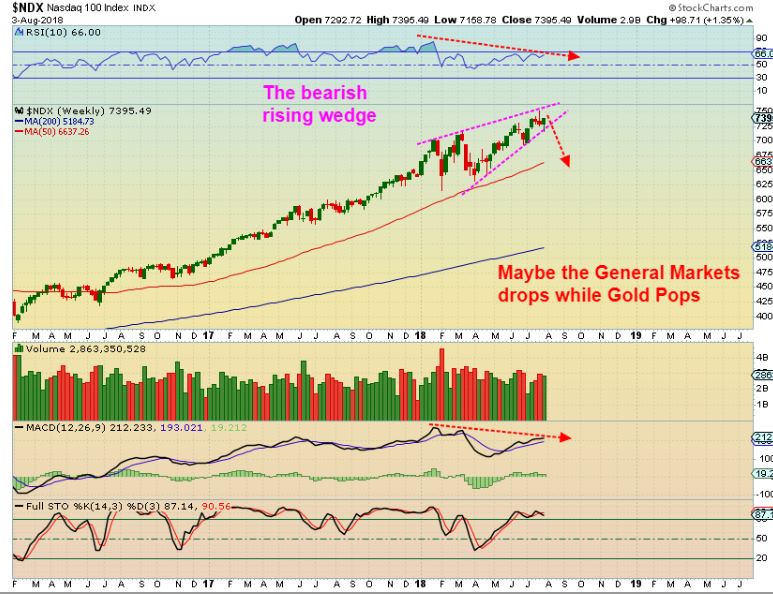
NASDAQ DAILY – Tech is strong , but this looks like a bearish rising wedge with strong divergence. Remember, all is not great in earnings land. We had FB, NFLX, and several others crash. Sentiment is getting frothy again. As I have stated in the past, to be cautiously optimistic, you could go long at the last dcl, ride it up to day 15, raise stops and look for signs. I will tell you what I see, and so far it is mixed weakness & strength with earnings. I would be a bit cautious, this should drop.
NDX DAILY – Same picture here, and maybe it just drops to an ICL near that 50 weekly ma? I think that the next chart was a real eye opener, if you ask me…
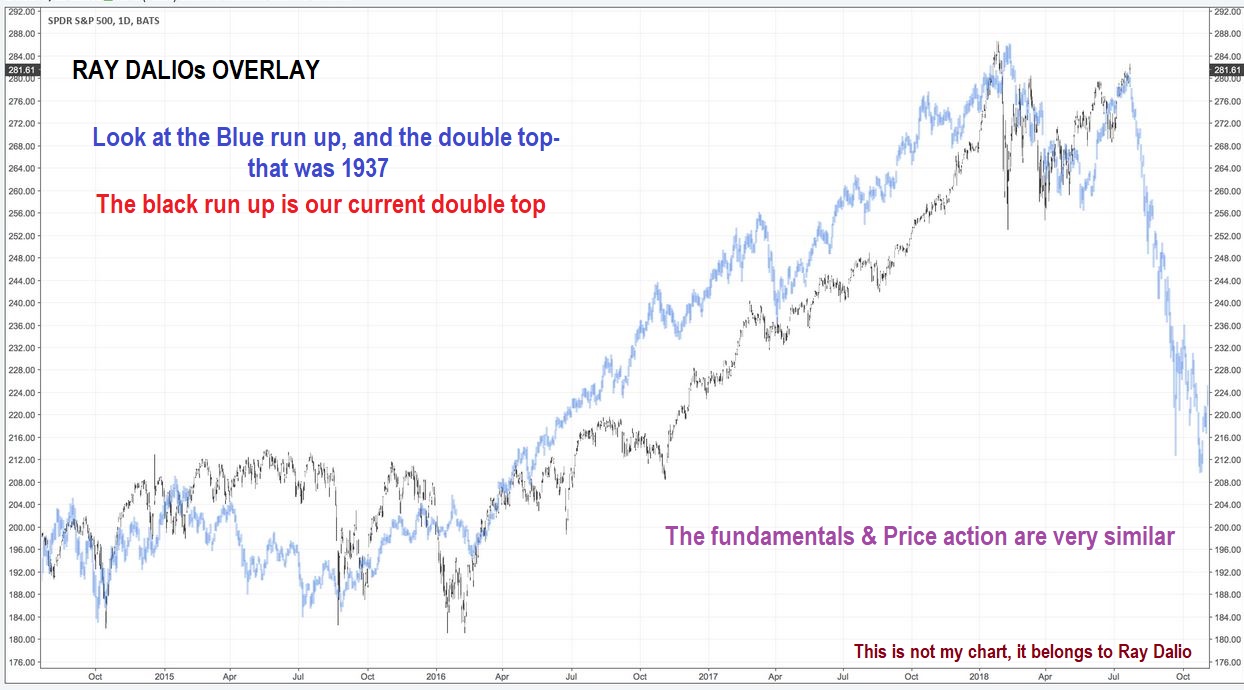
SPX DAILY – A reader sent this to me and I said “Whoa!”… That looks identical. It was an overlay of a Bull Peak & then a crash in S&P 500 from 1937 (Blue line) & now (Black line), and apparently the fundamental conditions were also identical. Low Interest rates, similar debt, etc, saw this bull run – this was where it peaked as a double top, SO THIS IS A GOOD CHART TO KEEP IN MIND. Ray is a billionaire hedge fund investor and expects a recession soon.
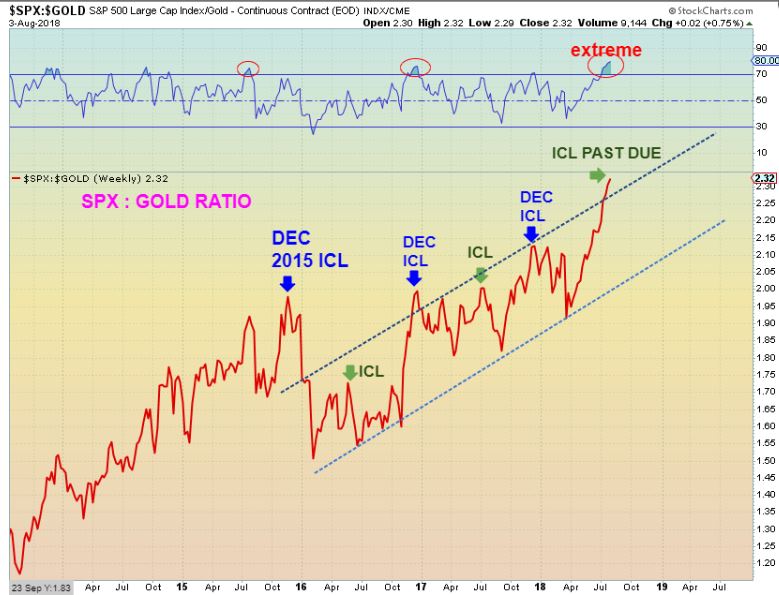
THE SPX:GOLD RATIO IS EXTREME : This could signal that a gold rally, an SPX drop , or both are coming. An ICL is overdue in Gold.
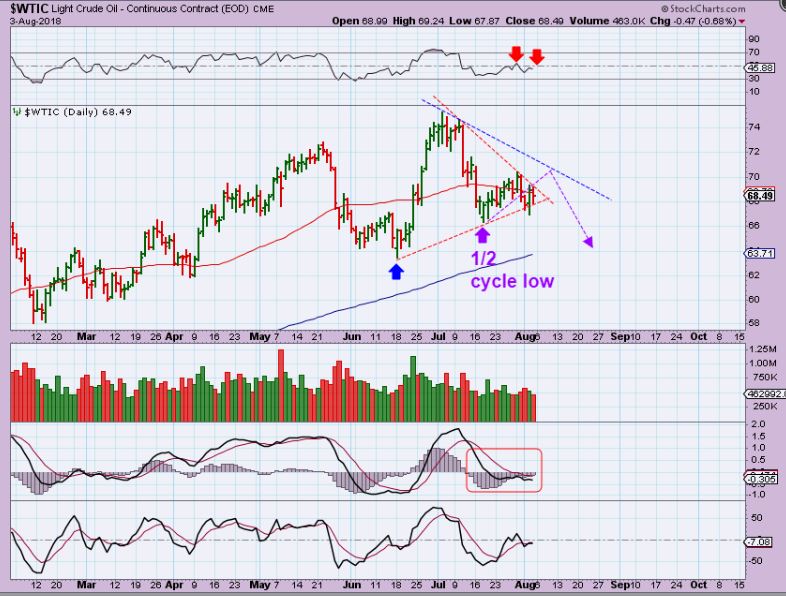
WTIC DAILY – This has played out as expected so far. I still feel that day 21 is a 1/2 cycle low, too early for a dcl, so I expected the bounce & another drop. I am not playing the bounce or shorting the drops, it is too choppy.
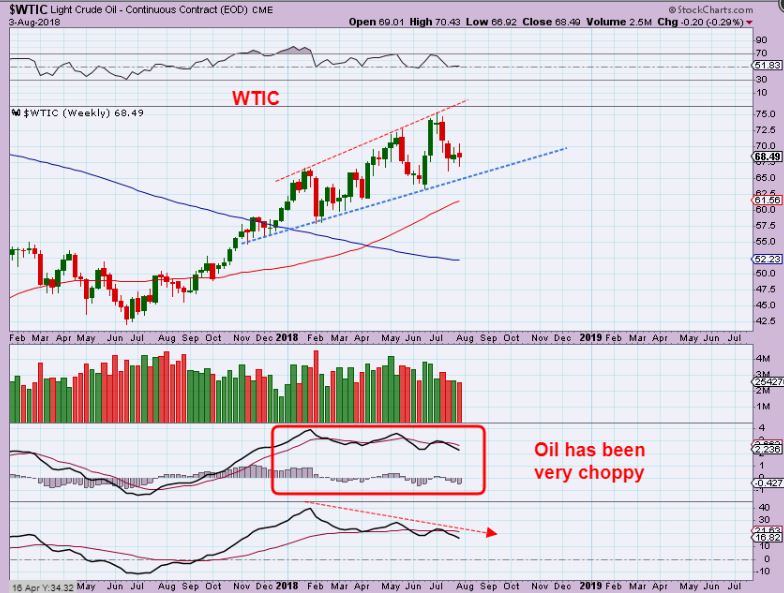
WTIC WEEKLY – Oil has been acting as I have expected on the daily chart, but the weekly chart shows just how choppy that has been. The weekly MACD is weak at peaks too.
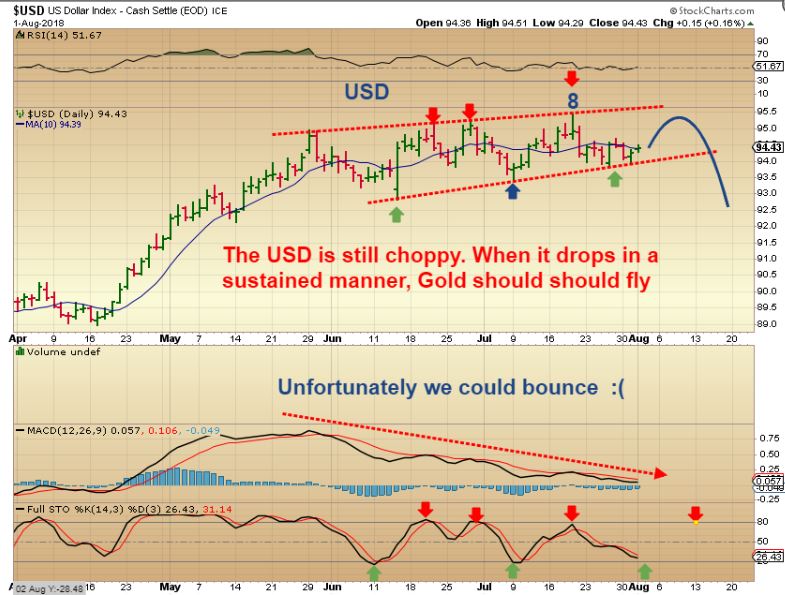
USD DAILY AUGUST 1 – I expected a bounce, but that the day 8 peak should not be taken out. AFTER THE POP, AND WHEN THE USD DROPS, GOLD COULD RALLY. DID THE USD POP / BOUNCE?
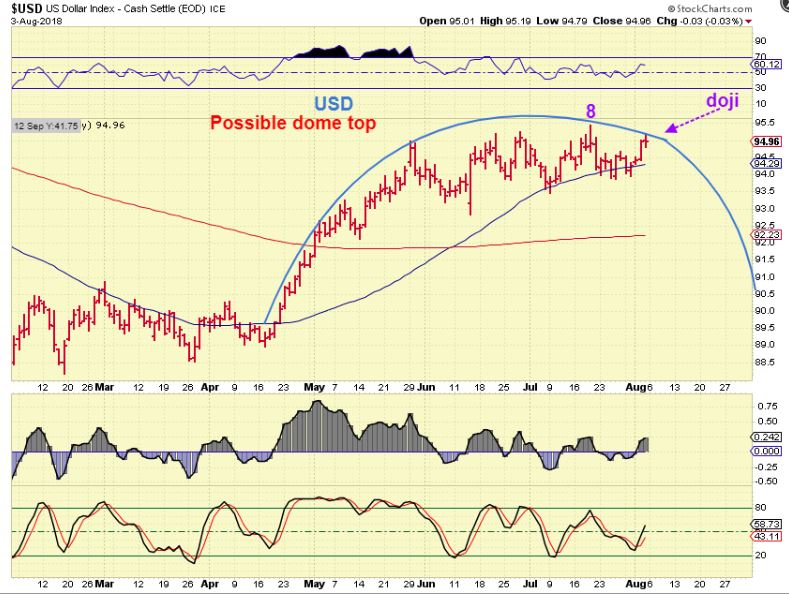
USD DAILY – We got the bounce (POST FOMC) and a ‘doji of indecision’ Friday (employment report). We may have a round top forming, day 8 is still the peak, we now need the drop and then Gold should rally (ICL).
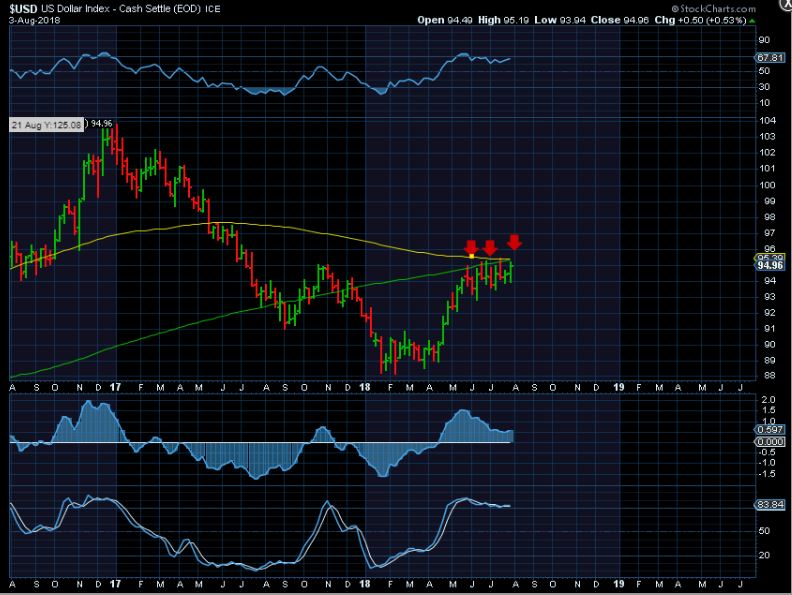
USD WEEKLY – Strong resistance is at 95.40 area is still holding
.
PRECIOUS METALS
.
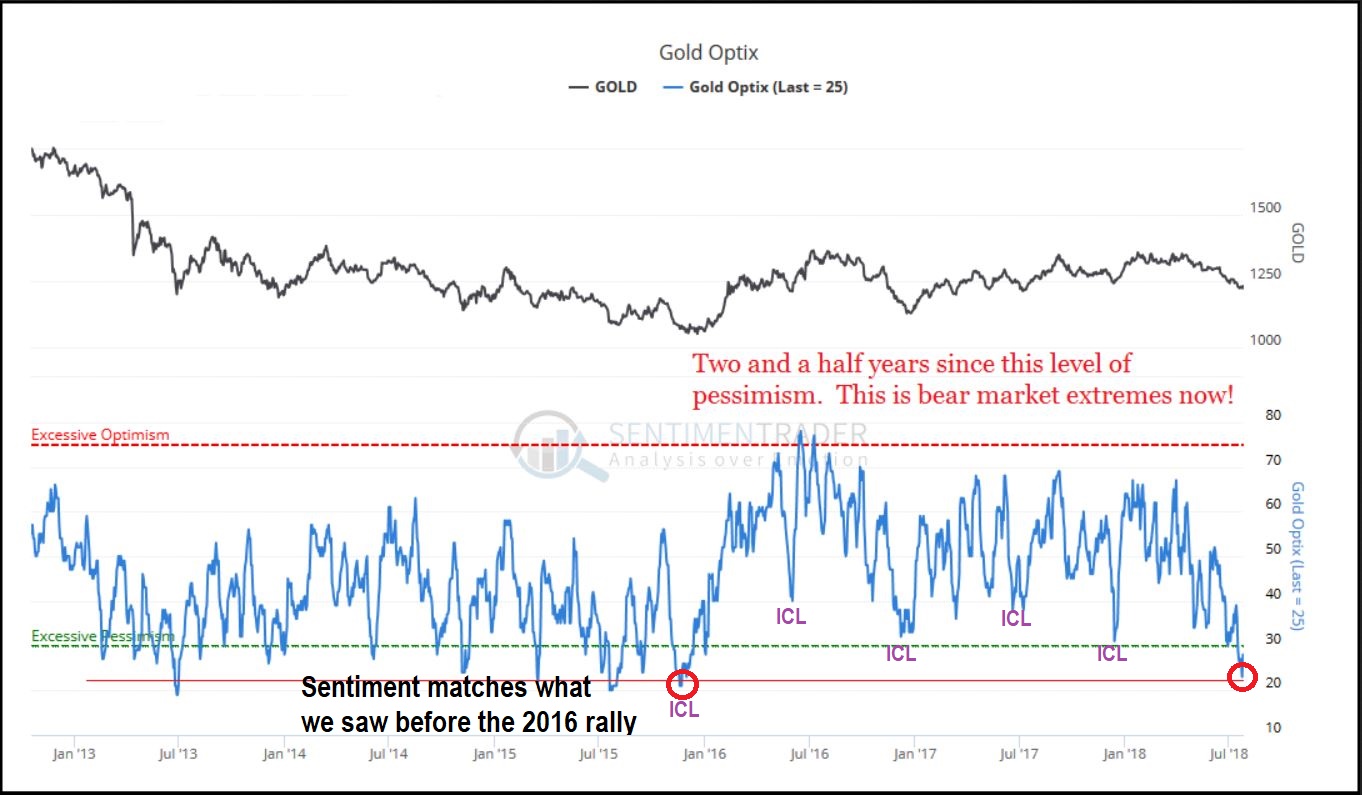
SENTIMENT – I am simply re-posting this reminder. We are at the same levels of bearish sentiment & positioning that we saw in 2016. We should rally in Gold very soon ( As you will see, we are really overdue).
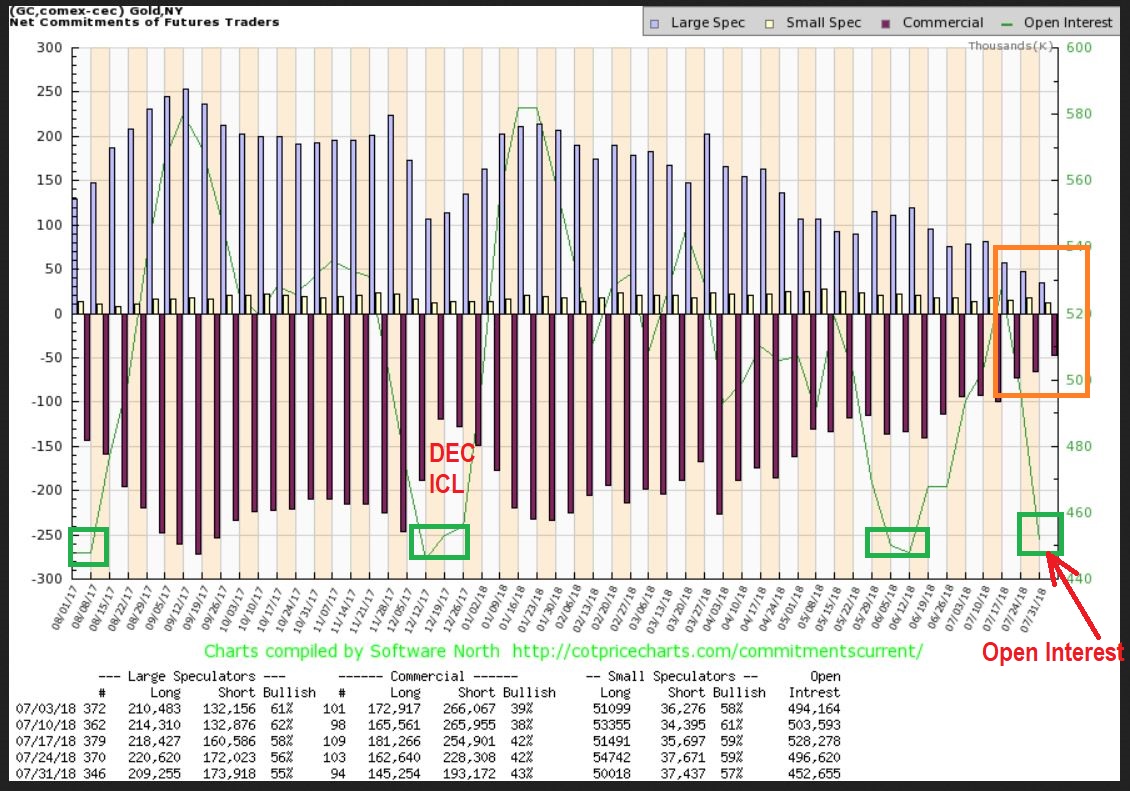
GOLD COT – This is just getting better and better. This is as of Tuesday, so it likely even improved more when Gold broke the lows after the FOMC meeting. Notice how low the smart money shorts are and look how Open interest dropped to ICL levels agian. THIS is where I like to see open interest and commercial shorts when in the timing for an ICL.
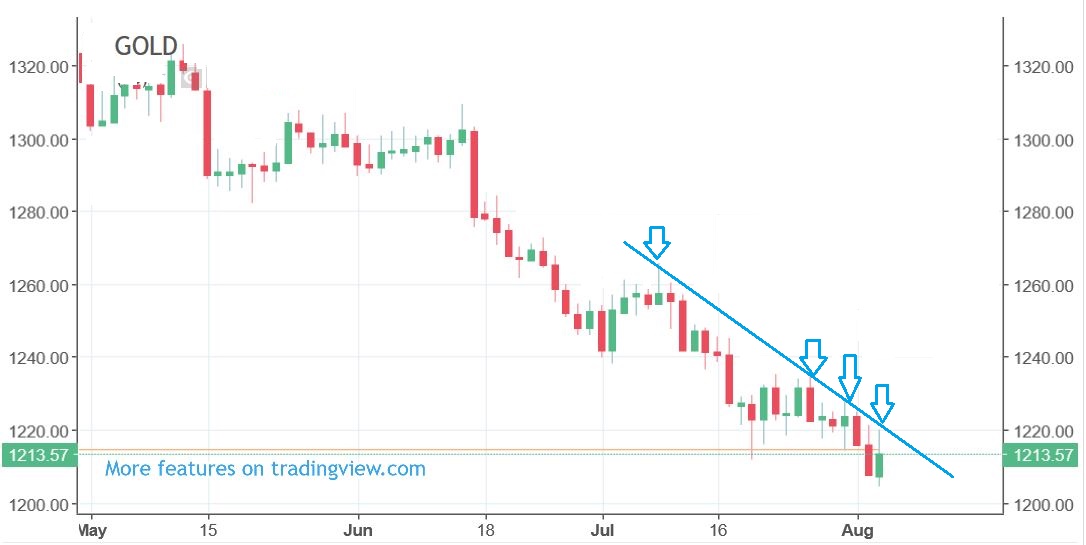
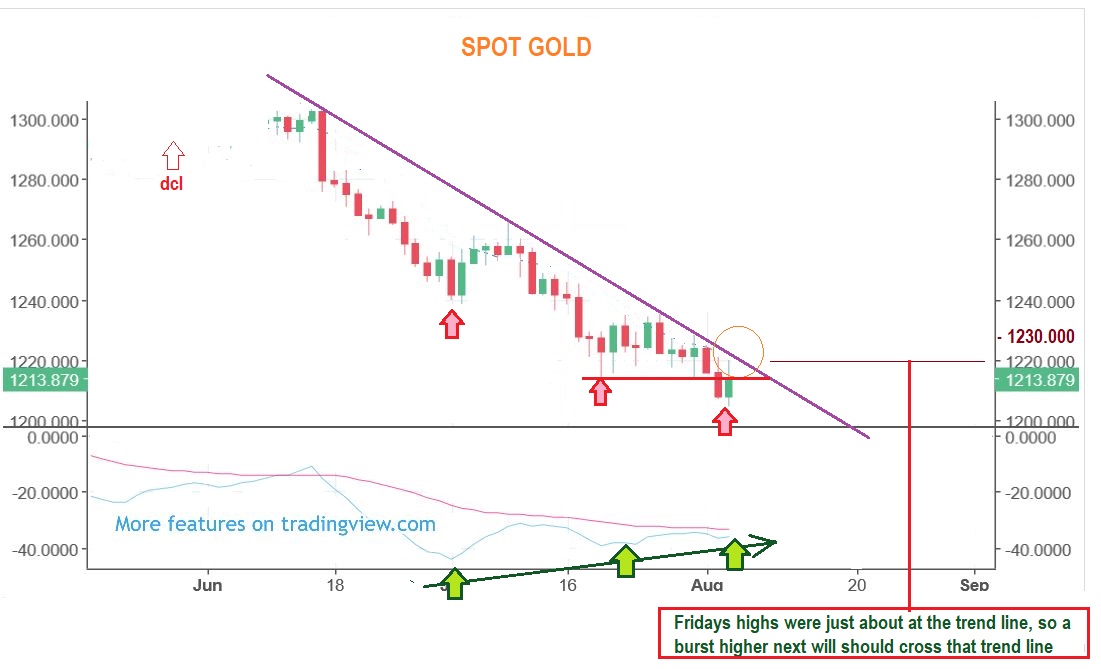
GOLD DAILY – We saw a reversal after the jobs Report Friday ( no trend line break yet). A $100 drop for Gold is not that big of a deal, it could do that in a week honestly, but it is the fact that this $100 drop has taken from May to August that is exhausting. The relentless time consuming drip has been a killer of sentiment and bullish enthusiasm for sure!
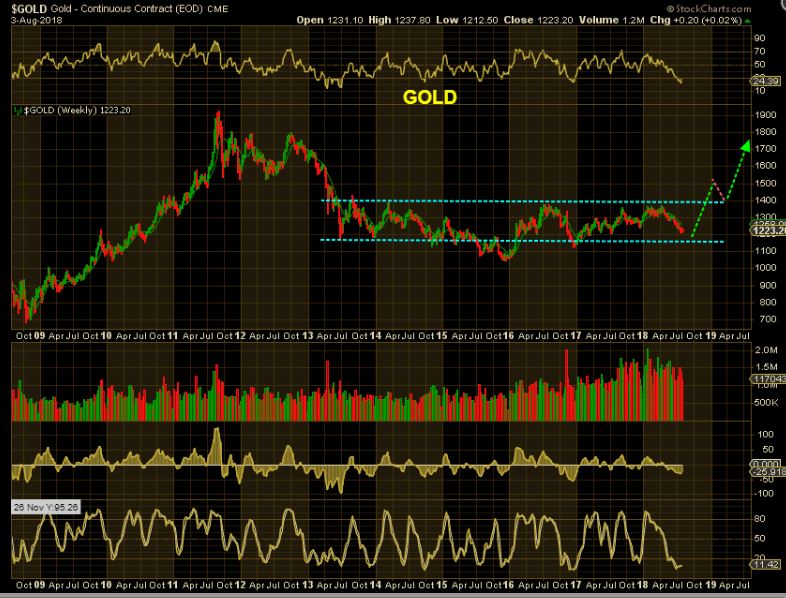
GOLD WEEKLY – Stockcharts has Gold at $1222, because they are using the Dec contract price, but the spot price would have us bounce on the lower line near $1200. I like this pattern & I expect a strong bull run from this ICL, so I have been drawing it as a break out, back test and continuation higher for now. We will watch it as things unfold.
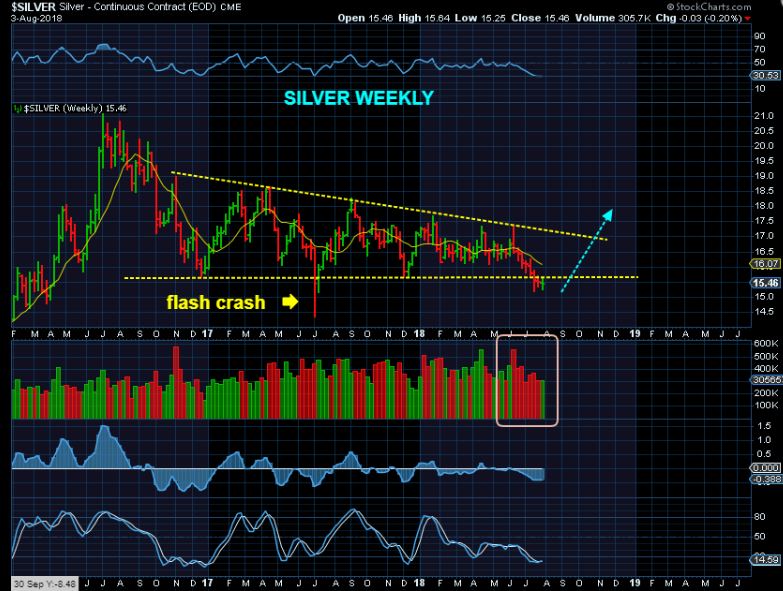
SILVER WEEKLY – Did Silver just do a ‘shake out’? Last July had a flash crash. We’ll know if it is just a shake out when it recovers, We know that we are overdue for an ICL rally.
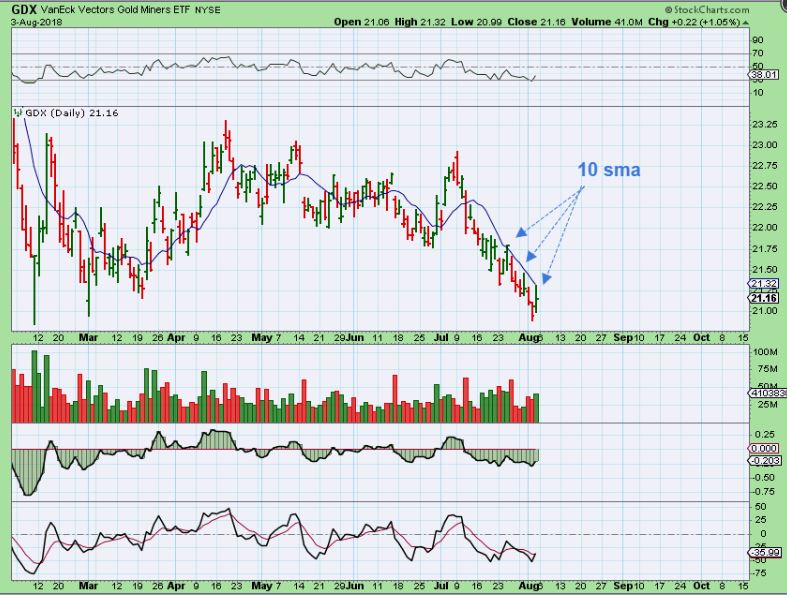
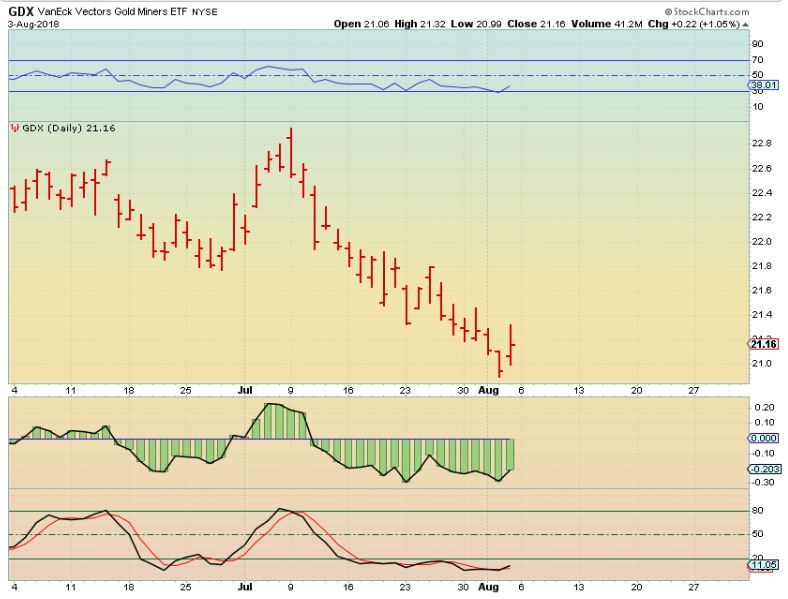
GDX DAILY – We remain under the 10sma. Let me show you something…
Watch this. EVEN IF you started a position at the very tip of this drop, and didn’t use a stop, and then still added later after the ICL is confirmed…
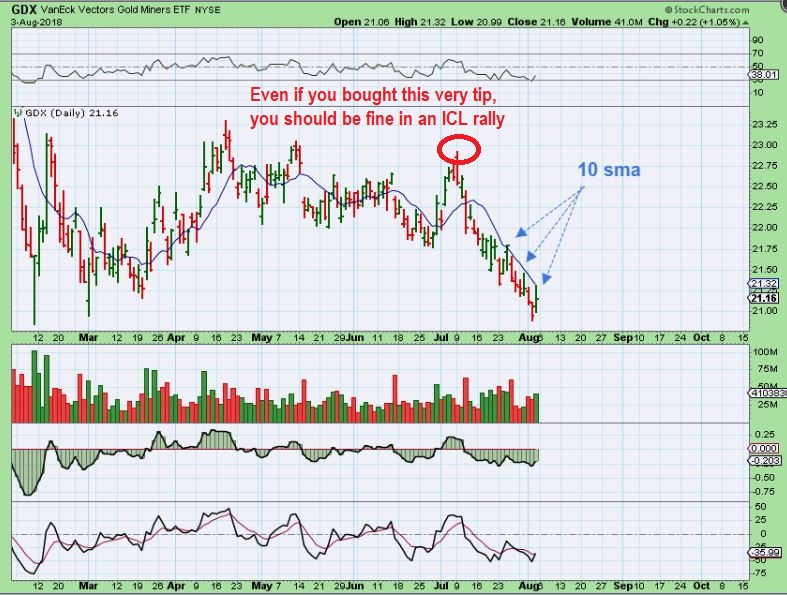
An ICL rally from this kind of bearish sentiment should overtake that high. Just don’t give up. When the ICL is confirmed, you want to be invested. These sell offs shown here can break your desire to enter the rally, but each time the reward has been large. I am NOT even showing the GDX rally of 2016 here, yet you see the way Miners can rally.  Just look at last Julys rally, THAT is why we are focused on Miners here.
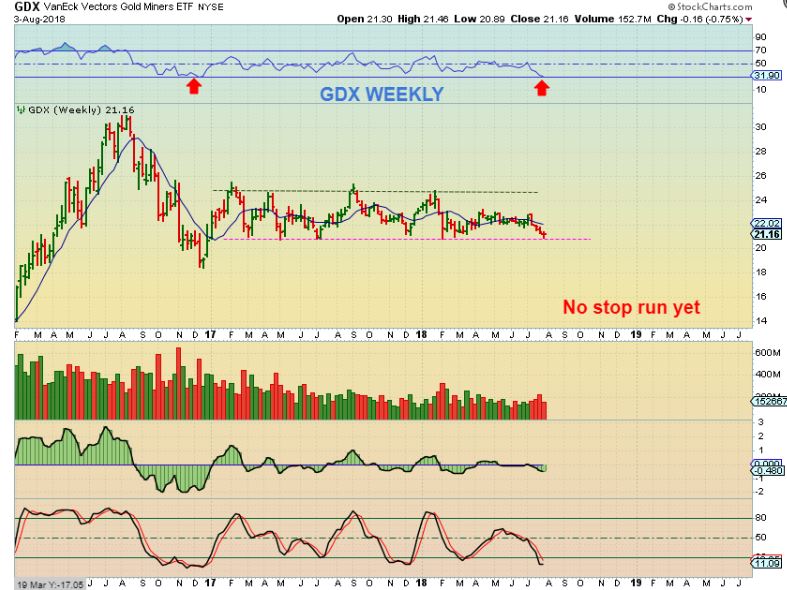
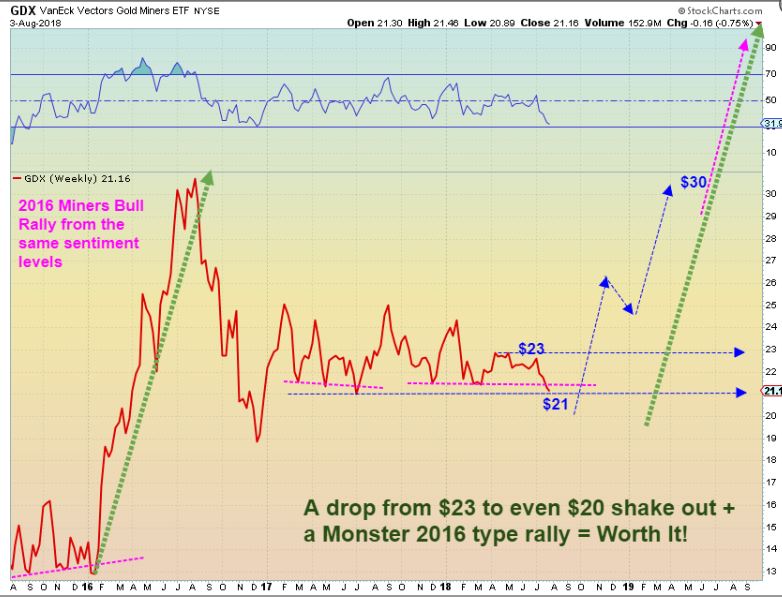
GDX WEEKLY – We still don’t have a major stop run, but this has actually been an area of support for over a year. We may NOT get a break down, it may just be support over and over again. We are finally oversold on a weekly now. I want to still say “Expect a shake out”, but it may not happen if everyone is expecting it.
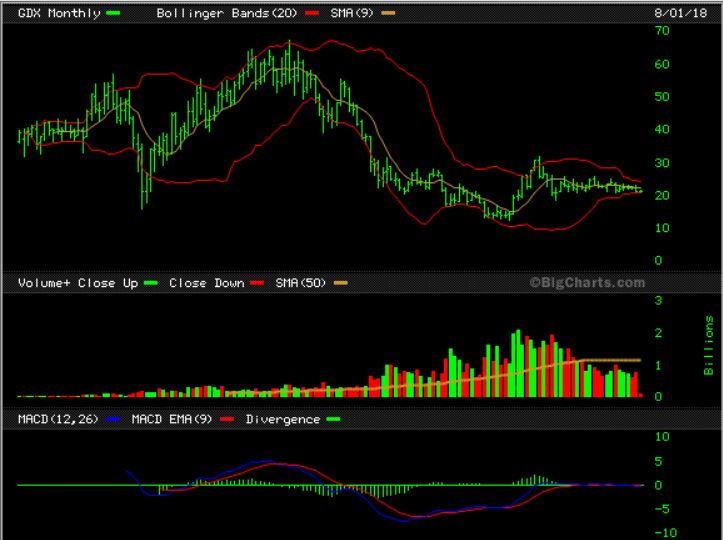
GDX MONTHLY – This is a chart that I posted to show how tightly squeezed the bollinger band is on a monthly. You can expect a major move out of this. I updated it below …
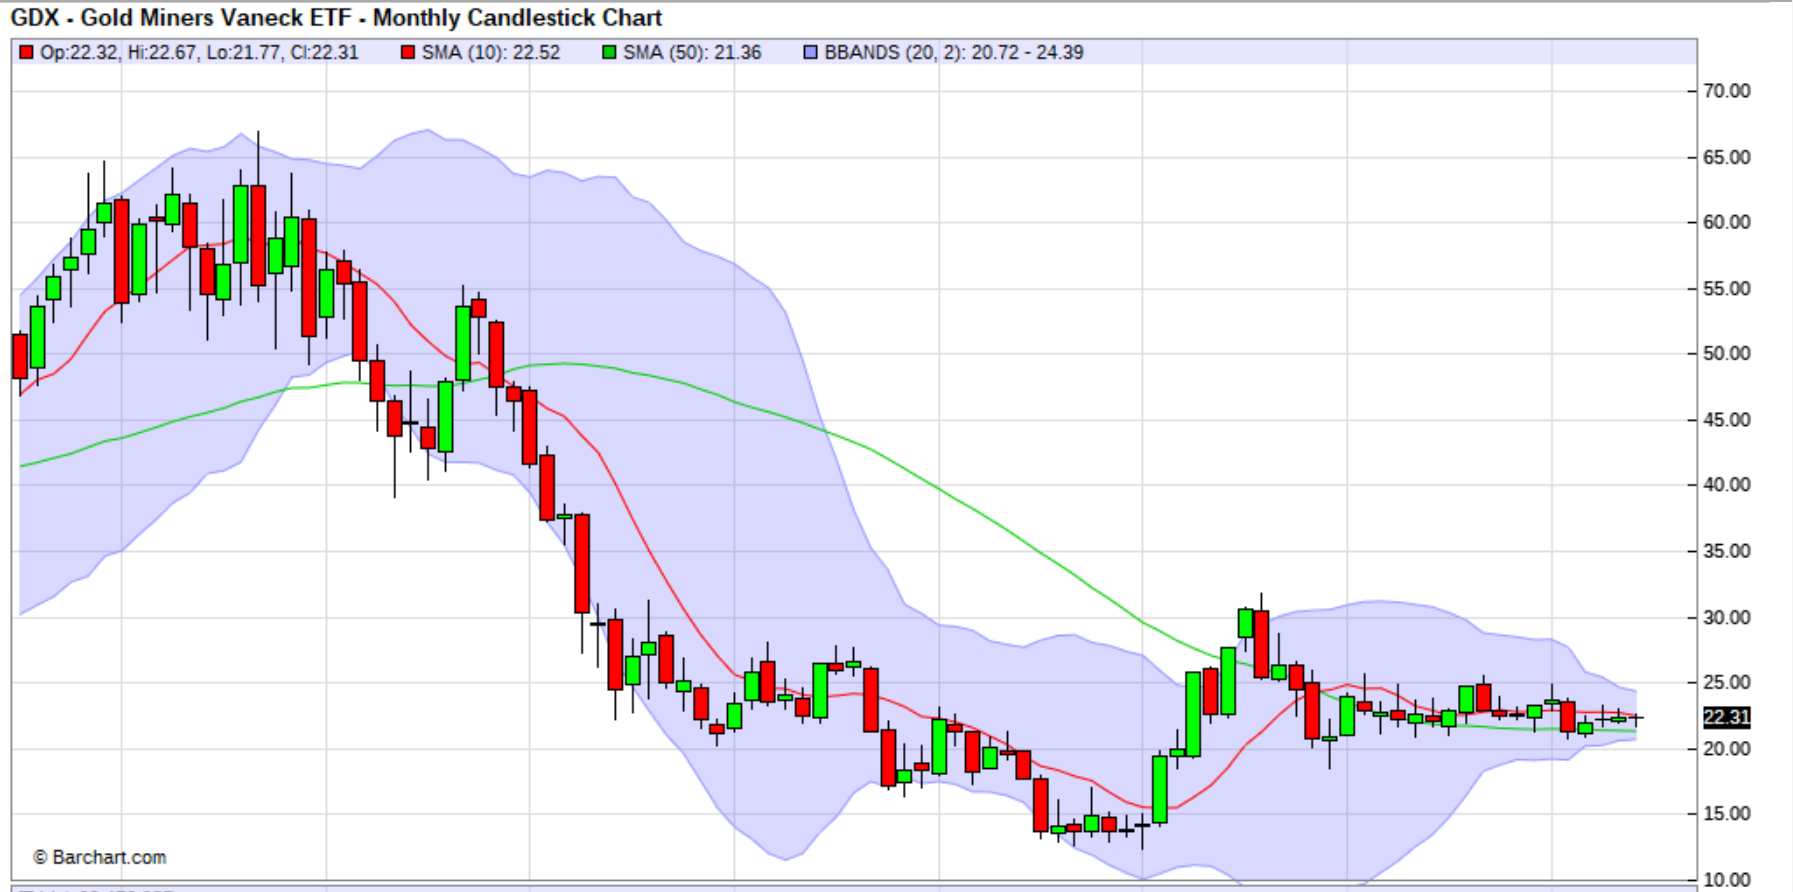
GDX MONTHLY – I updated it and those B.B.s are EXTREME!
WHAT IF that SPX overlay chart & SOX:GOLD Chart does indicate that we are in for a market sell down, and Gold massive rally? Would Miners holding up this way indicate that a Multi-Month Super Rally is about to unfold? This slow sell off pain will be erased in no time if that is the case. Please do not miss it, just wait for confirmation & be ready to deploy some funds.
Let me just state something else here, while I am ranting on. As the opening picture reminds us: We are close. 🙂
.
Golds sell off here has been extra difficult mainly because of the amount of ‘Time’ that is passing. ICLs come every 5 or 6 months on average, this one is well over 7 months! As I have stated in the past, EVEN IN A BEAR MARKET, the rally out of an ICL lasts for weeks, rips higher, and gives good gains. Please keep that in mind, because this kind of prolonged downward path can take its toll.
.
Also, look at the next couple of charts: GDX at times has only dropped 10 cents, 5 cents, 20 cents, 3 cents per day, when in the past it has been down 40 cents, 50 cents, 40 cents, etc etc. The selling has been constant in July though, and this slow steady beat down is killing emotions and any desire to participate. Let me now make my point…
.
If I saw you on the street and said to you …
” Hey, GDX dropped from $23 to $21 in the last 3 weeks. What do you think, scary, huh?“
.
You would probably say, “Big Deal, I’ve seen it drop $2 in a week! ”
.
.
Well, actually, GDX over the last 3 months has dropped 2 dollars total- from peak $23 to low $21. Yes, in 3 months it has traded between $23 to $21, but that slow day after day grind of July alone is killing sentiment. If you are leveraged a little, it was probably frustrating, if you are heavily invested though, day after day after day seeing the account a bit more red can be a real mind bender, however…
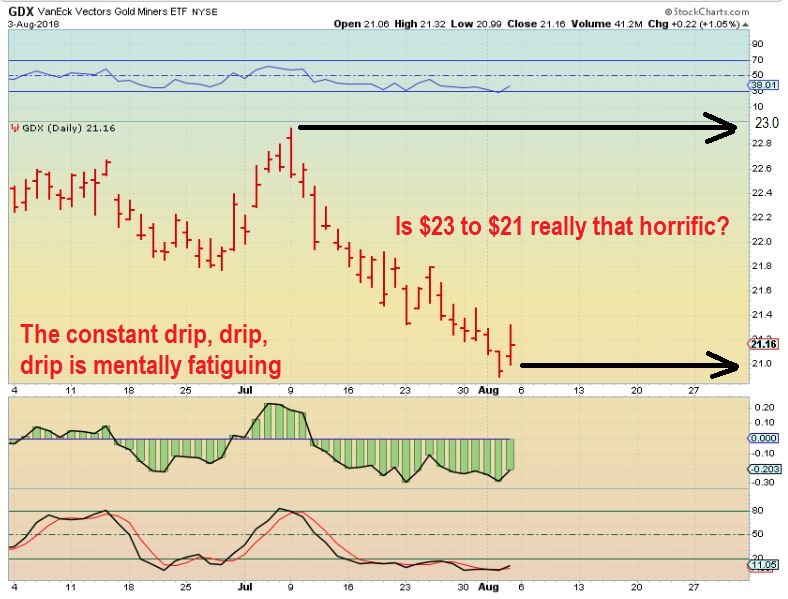
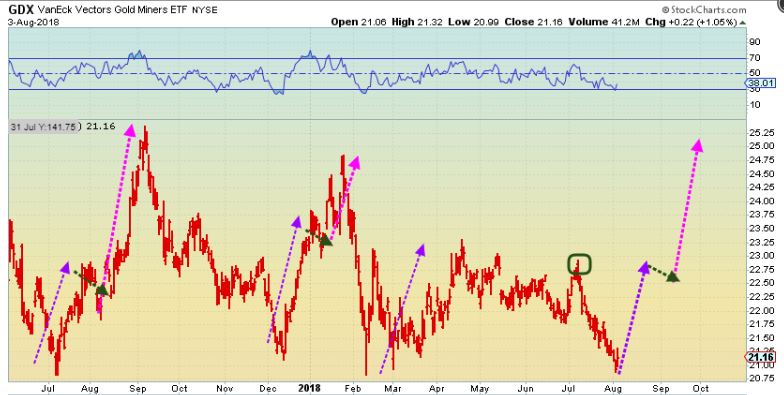
As pointed out above, the coming rally should undo all of that and then some. This $23 to $21 drop will be undone if an ICL rally takes hold. Look at Last July on this chart. We’ve seen this movie before, I don’t expect the ending to change. We are simply overdue.
How about a WOW moment! WOW, I’d take that!
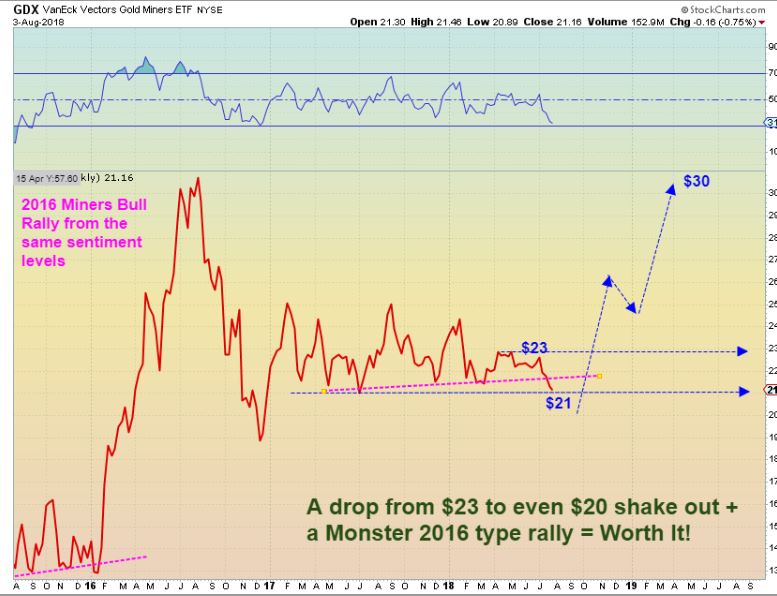
PERSPECTIVE : The 2016 actual size rally added to now is really a WOW moment, when you look at the $23 to $21 drop ( or even if we go to $20 for a deeper shake out). Don’t give up, just wait for confirmation and make some Money!
CONCLUSION: Yes, I hate to say this, but we MIGHT have the lows in place for an ICL as of Friday. I hate to say it, because ‘Time’ has been the enemy on this ICL. It has slowly dragged on & on, and it has been a real confidence killer for the day to day observer. Down-tick by Down-tick, I see peoples patience being worn down like the slow wipe of sandpaper across a soft vulnerable substance.
I mentioned that we’ve seen this movie before and we know how it ends. I still see things as just another step closer to a turnaround. The USD is at its resistance again, and an ICL is overdue. GOLD has reversed after a brief break down and is near that trend line. This trend line break is what I am watching for…
Don’t get me wrong, it has not been easy for me either. Not only am I invested in few Miners, patiently waiting for the ICL to completely load up, but I also have write about it day after day after day, and that gets tough. There are only so many ways for me to say ” We are due, but we do not quite have a confirmed swing low yet”. 🙂 Yet I see in the charts, sentiment, and cycles that an ICL should present itself at any time. Possibly even on a Friday after the unemployment report. 
.
Enjoy the weekend, here we go again!
.
~ALEX
3 OLDER REMINDERS
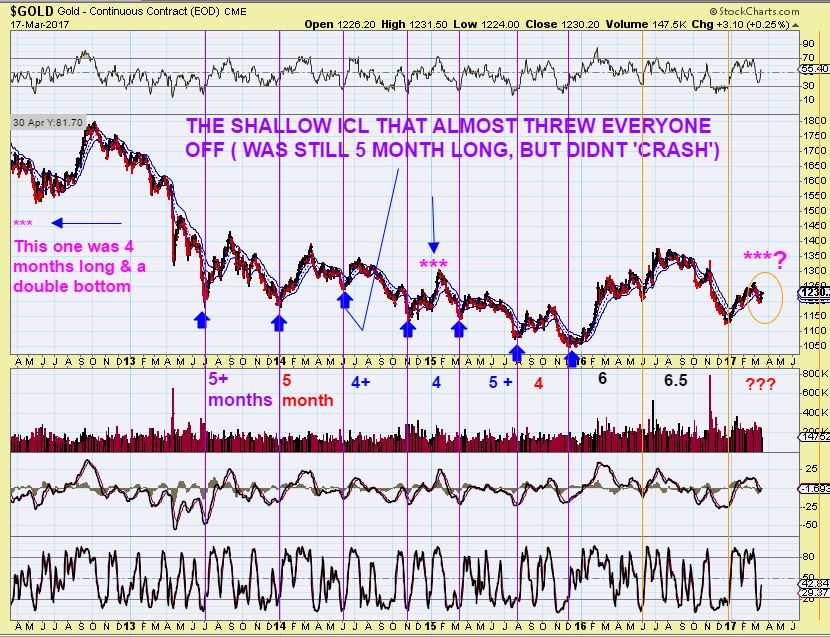
GOLD ICLs – In this JULY chart, I was showing that Cycle timing had us ‘due ‘ for an ICL around 5,6, or 7 months. Look at the cycle wave troughs – it lined up very close, give or take. In August, we are now overdue.
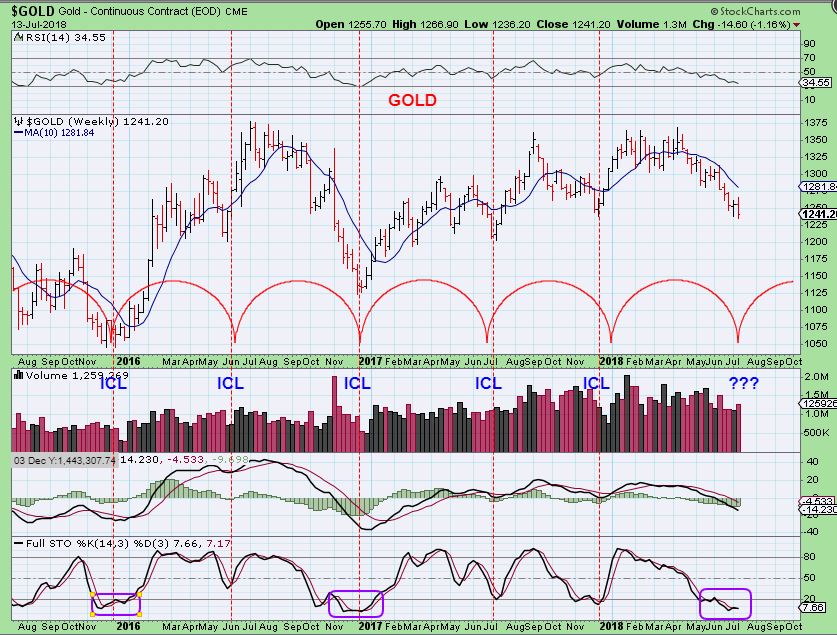
GOLD ICLs- Reminder that even the BEAR MARKET ICLs rallied for weeks before rolling over.
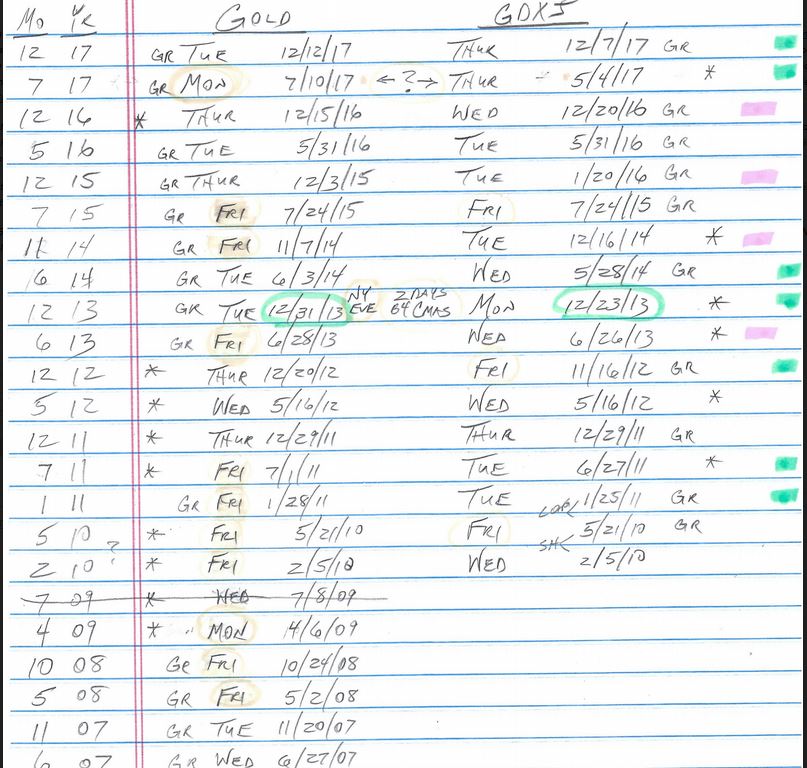
THE HANDWRITING ON THE WALL 🙂 – This was the list tht Cal threw together of ICLs and the DAY of the week that the ICL occurred. At times I would hear readers wondered if an ICL could take place on a Friday? Who would be buying heading into the weekend?
Well, many ICLs or Bottoms/ Lows of a sell off did happened on Fridays as you can see. This Friday it popped into my mind that…. MAYBE it has to do with the ICL happening at the Employment report?