AUGUST 29th – Here Again
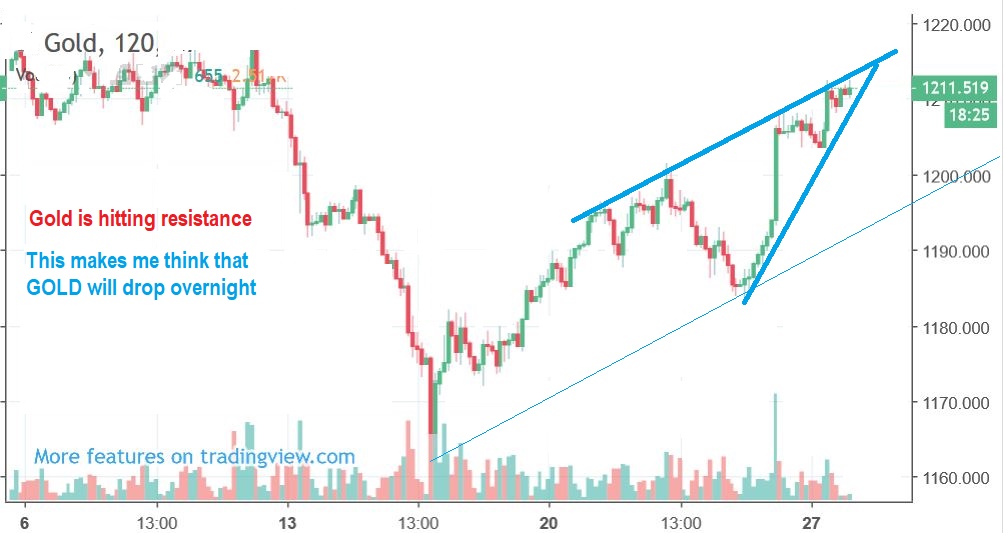
1. Last Night I mentioned to my readers that I was seeing a drop in Gold coming. Gold was at $1212, and I posted this chart saying that we could see a drop to $1200. That is not a big deal, but we are waiting for a short cover rally, so apparently we had to ‘expect delays’…
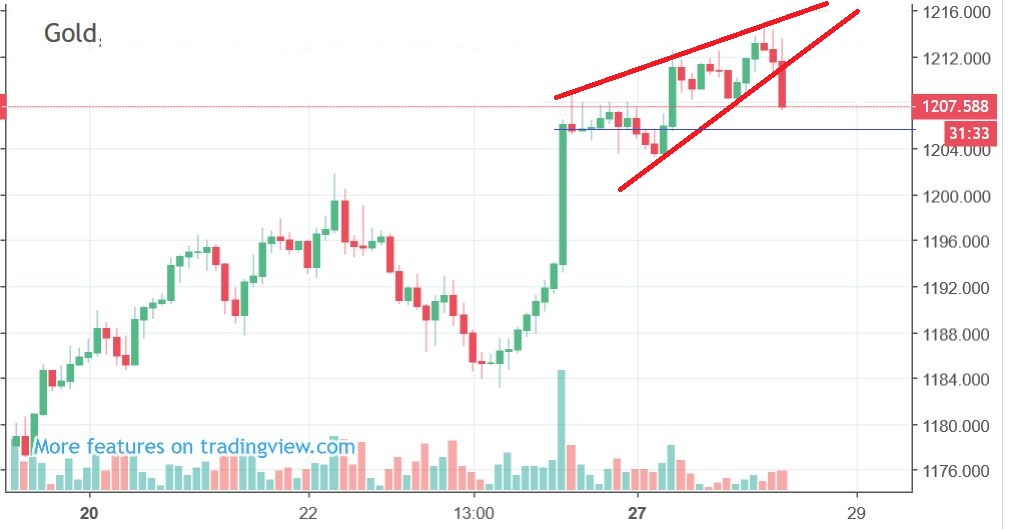
2. The drop started here, and I posted this in the comments section. Again, not a big scary concern, just Expect delays..
Let’s talk about Gold $1200
GOLD FELL TO SUPPORT AT THE 1200 area as expected by me, and bounced. This is a live shot at Midnight Eastern time… 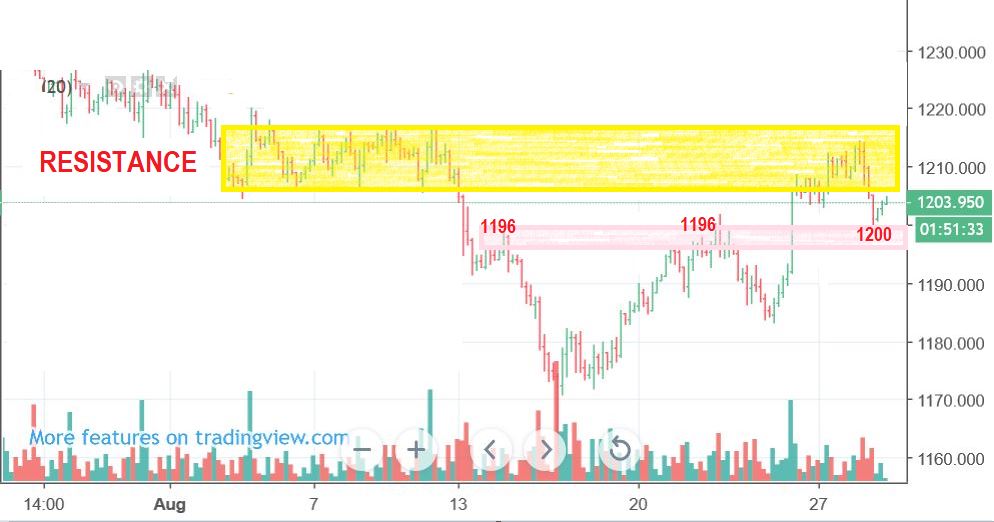
GOLD Could do an a-b-c type drop, but so far the $1200 area held it up. A-B-C looks like 1190ish.
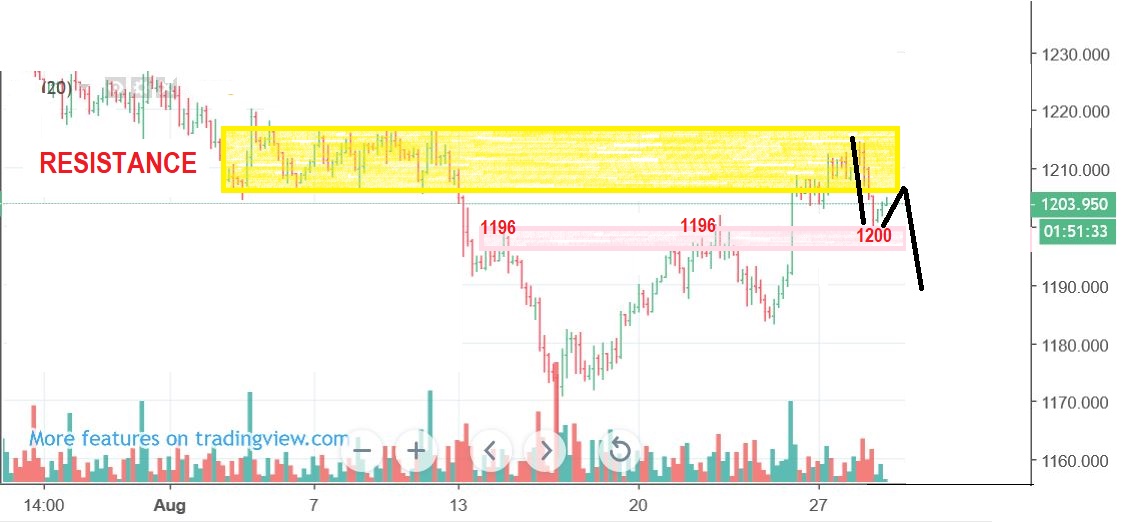
So GOLD DAILY is at $1203 tonight. It can drop further if I draw a channel with a lower trend line like this, and that would be that a-b-c down to 1190. This still looks like a capitulation ICL occurred 10 trading days ago.
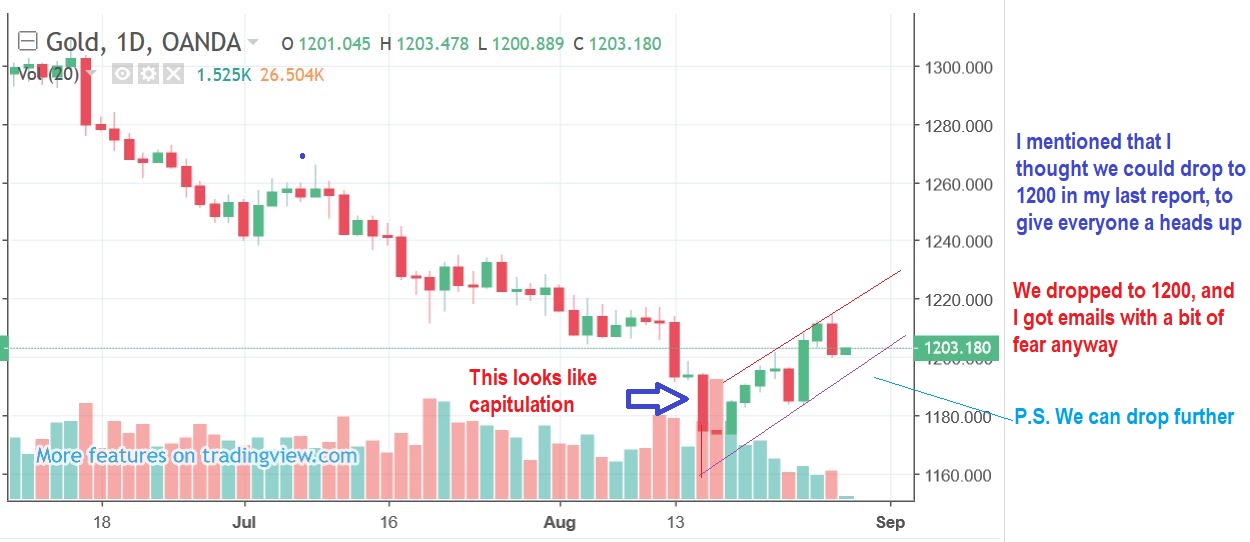
GOLD – Yesterdays drop looks similar to last Wednesdays drop, we’ll see if that is a 1 day drop or does this one have more follow through.
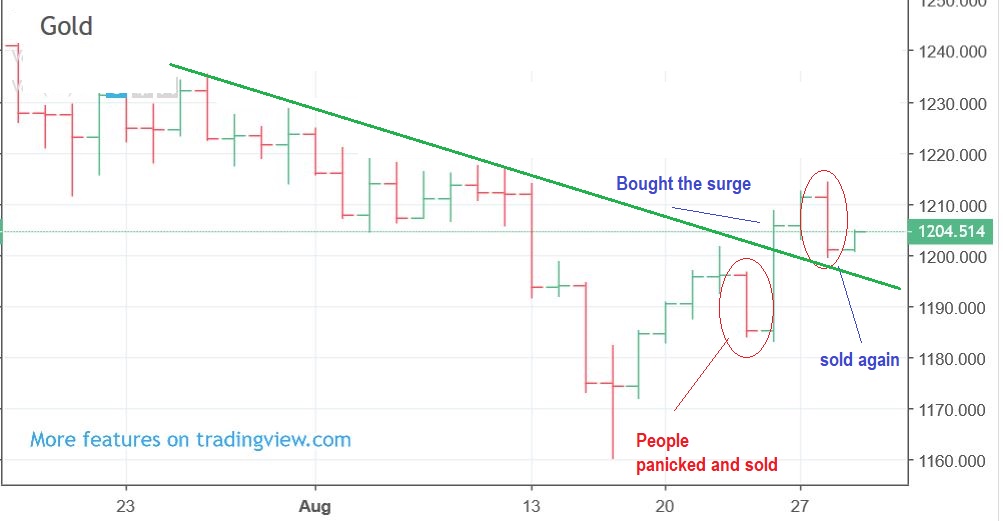
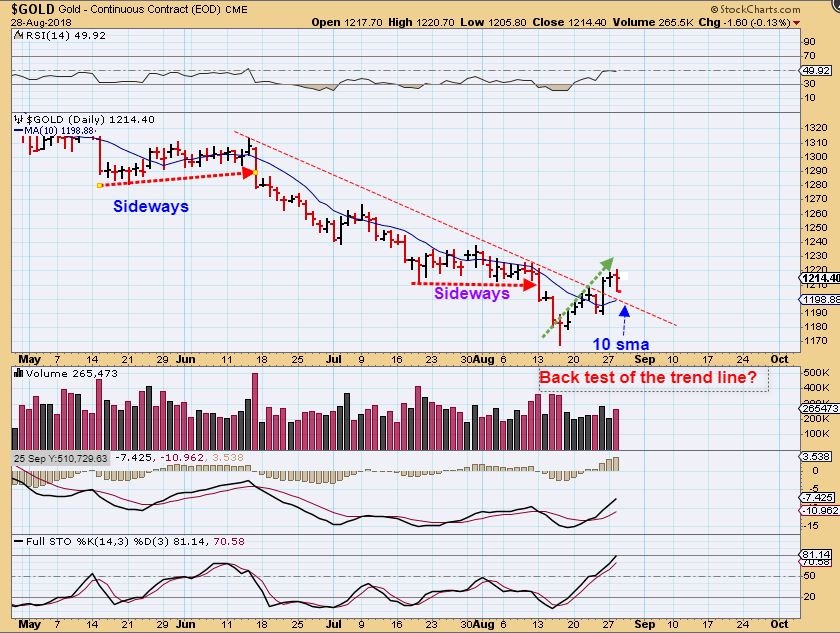
GOLD – This move up out of the lows looks steeper than the prior moves. Also a drop to the 10sma near $1195 looks like a back test of the trend line. Last Wednesday Gold dropped and people sold positions. Thursday burst higher, I saw people buy again, higher. Tuesday Gold sold off, I saw people selling lower. If tomorrow Gold is higher, will they jump back in? That is called ‘Buy high, sell low, Buy higher, sell low’ – not a good idea, but I see it often at choppy bottoms.
So far there is nothing wrong here. Let’s take a look at Miners…
.
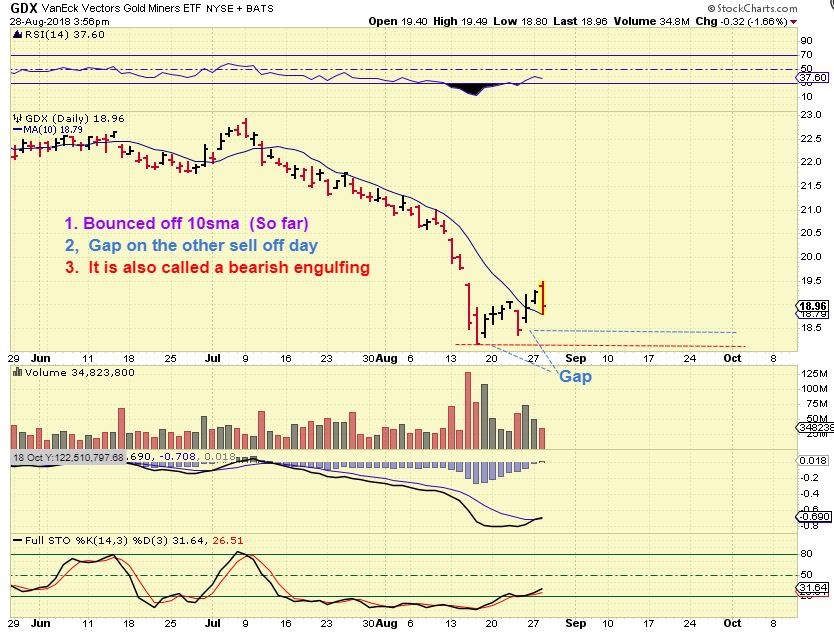
I will admit that Miners had a more negative 1 day look, because this is considered a bearish engulfing candle, but that doesn’t automatically mean that ” Now we break the lows”.
.
So far GDX & GDXJ are even still above the 10sma, but past ICLs saw the 10sma broken & it was o.k. ( 2015). Could this drop & fill those gaps? Yes. Will it? We don’t know, it doesn’t have to and the MACD still tried to cross with the Tuesday selling. Read the charts…
I looked for a Bearish engulfing candle near an ICL and I found one on day 11 in 2016. Was there an immediate sell off to the lows? No, but there was 2 weeks of choppiness. Can you handle choppiness?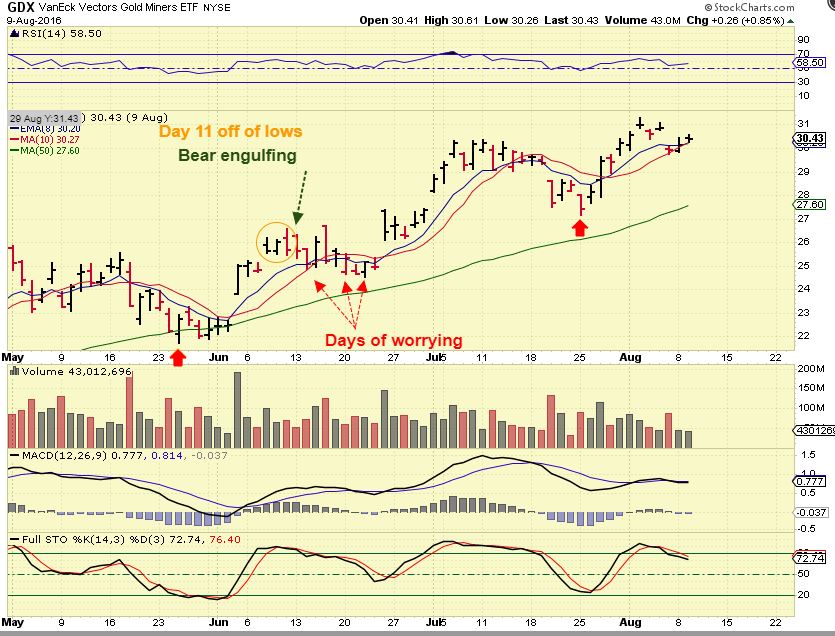
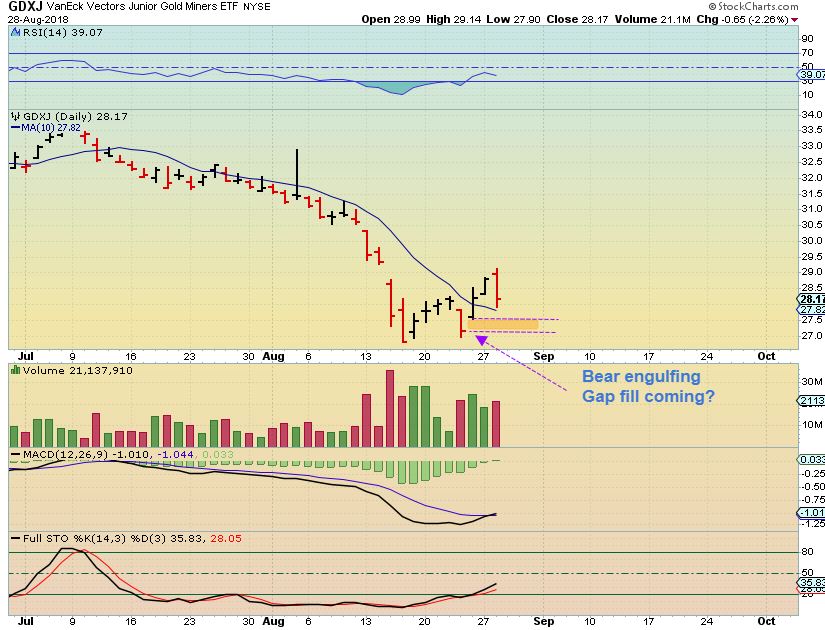
GDXJ – Will the 10sma hold? Will the gaps fill? Tune in Wednesday, there is no way for me to answer those questions, but GOLD seems to have an ICL in place, we’ll see what the Miners have in store.
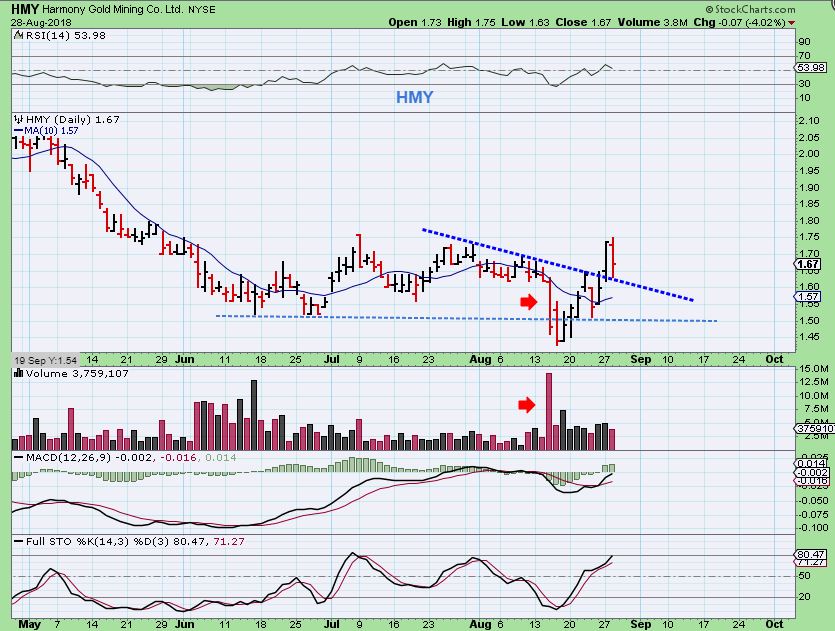
HMY – Still ok.
GDXJ – GDXJ also looks like an ICL with capitulation. If that low gets undercut, it would probably be a very brief shake out, but it also may never happen. Look at the February lows. Price also dropped toward those lows in Feb, but then simply went sideways. You may see something like that again.
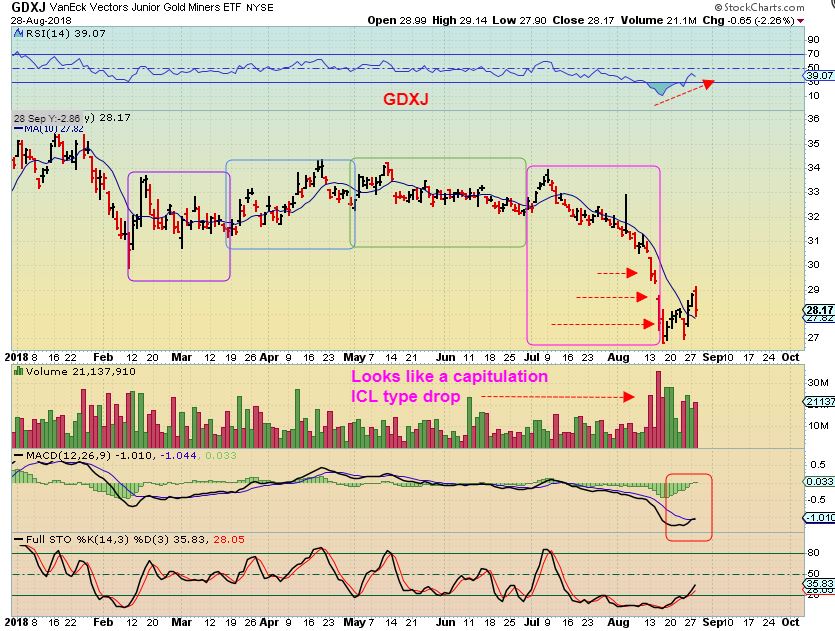
Looking at the above chart, the lows are still be in place at this point, but it looks like we may be in for some choppiness. Last Wednesday price dropped and scared people out, then recovered the next day with a strong surge higher. Now we have a drop again to me, so we’ll just have to wait and see what Wednesday brings. The bottoming process can be choppy, and did you know that not all bottoms look the same? I’m sure that I have mentioned that before.
.
~ALEX
.
DID YOU SEE MJ STOCKS IN AFTERHRS? MAN THIS SECTOR MOVES BIG 🙂
.
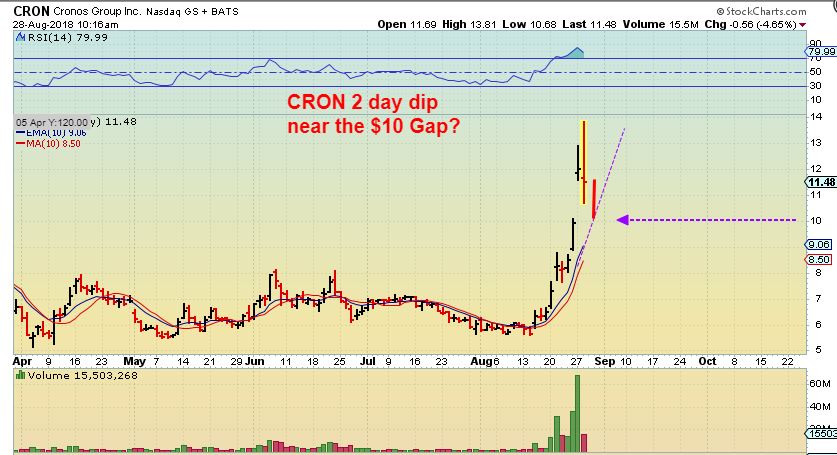
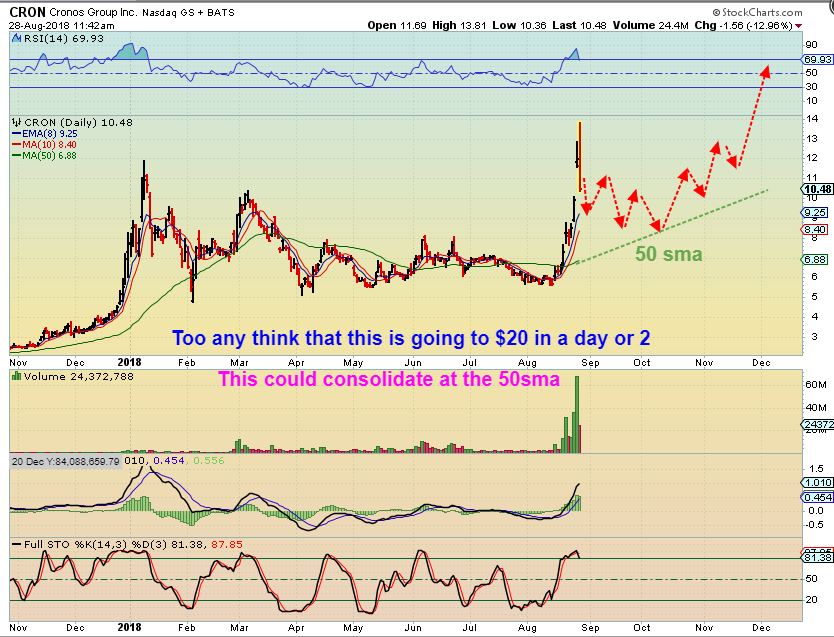
CRON SOLD OFF in an attempted Gap fill. This is a BIG move from Highs to near $10 in 2 days. I thought that it might take a couple of days to finish the work that it had to do, but…
.
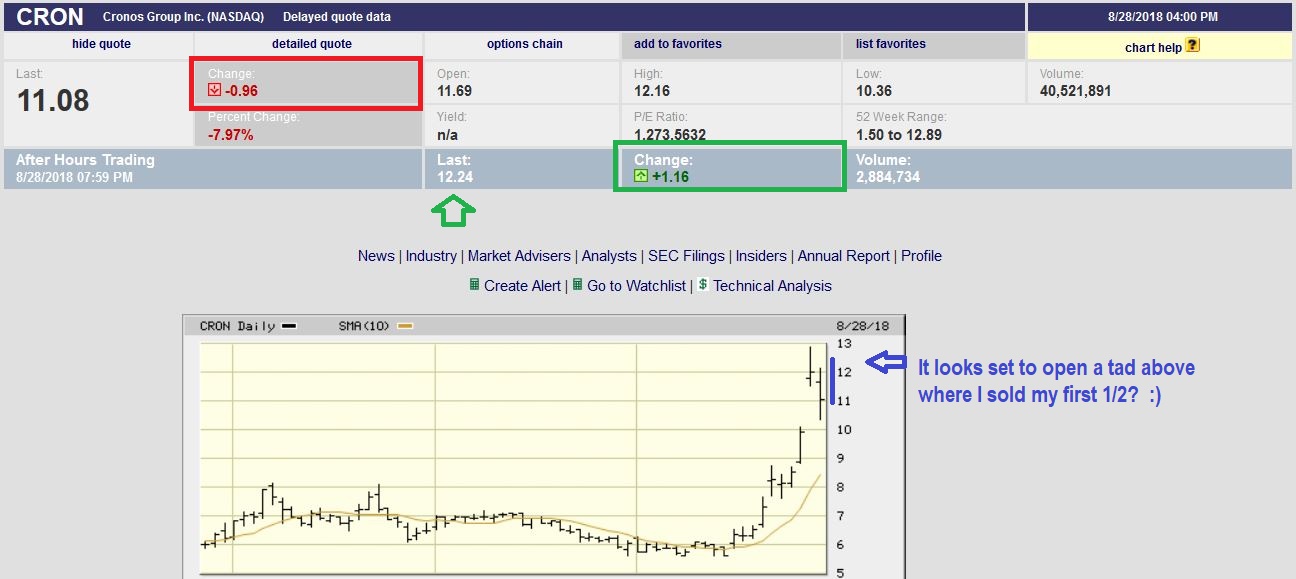
CRON AFTER HRS – It was down 96 cents Tuesday, it was up $1.16 in after hrs.
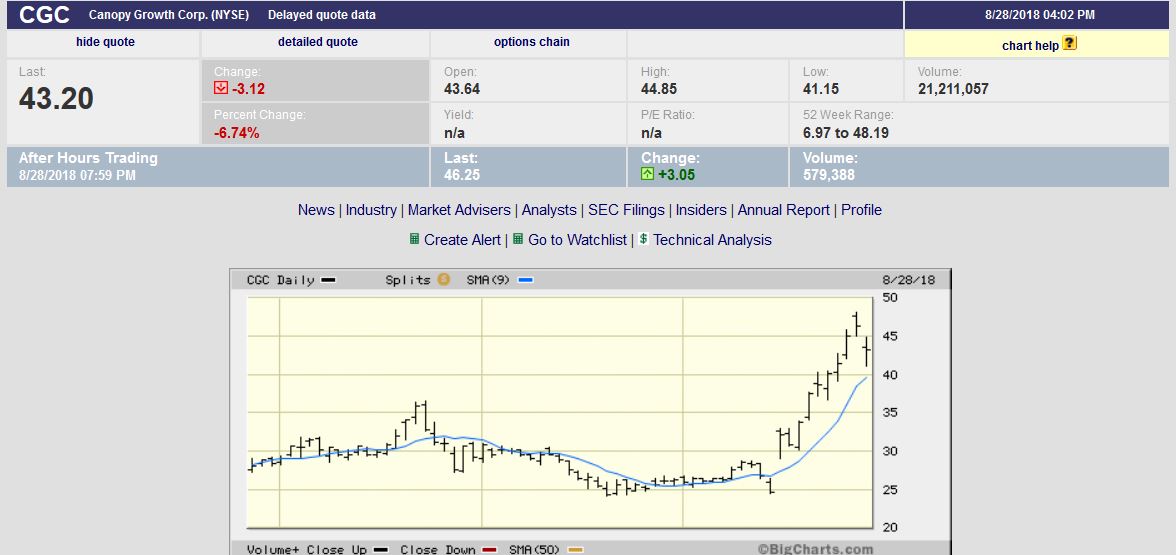
CGC – CGC was down $3.12 for the day, but up $3.05 in after hrs.
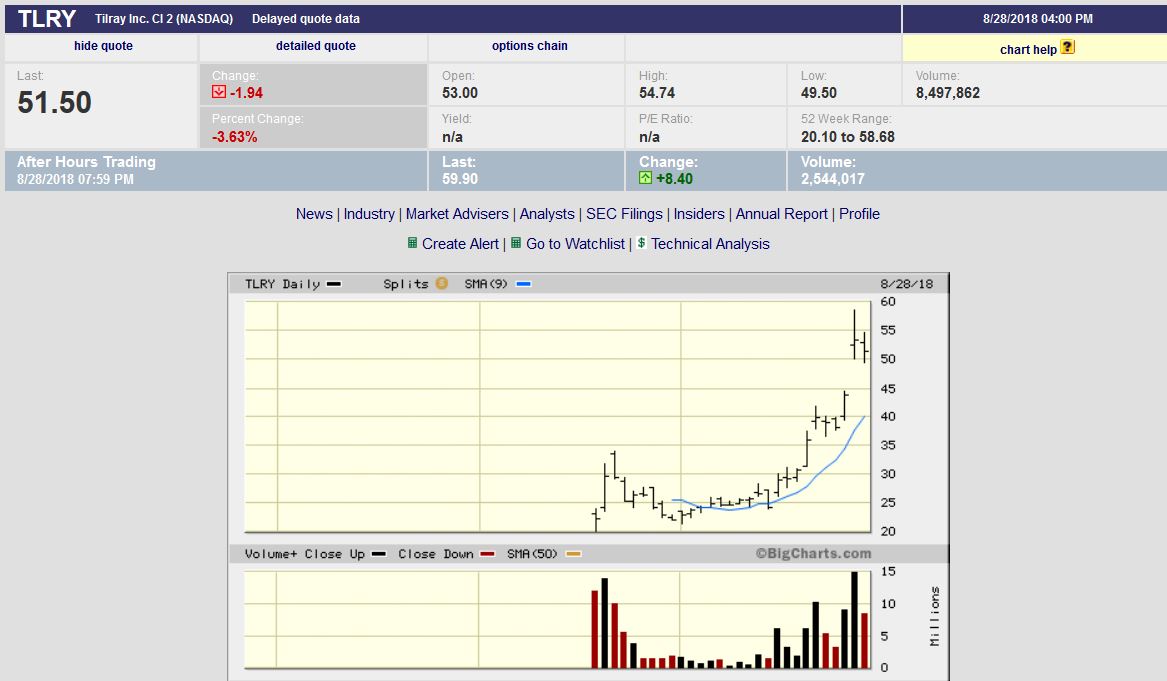
TLRY – Sales doubled for TLRY, and the stock was down $2 during the day, then popped up $8.40 in after hrs!! TLRY Hit highs near $58 Monday, and is now set to open at $58. This sector is NOT AN EASY RIDE, but boy has this been extremely bullish.
It was one of those down days for the MJ sector, and dread could be seen in the comments section. Most were just joking or kidding around, but it seriously is a tough Bull ride. These have been up 15-30% in a day, most were down 7-10 % Tuesday. THIS IS NOT AN EASY RIDE. I decided to draw up some conservative charts to give an idea of how this could play out.
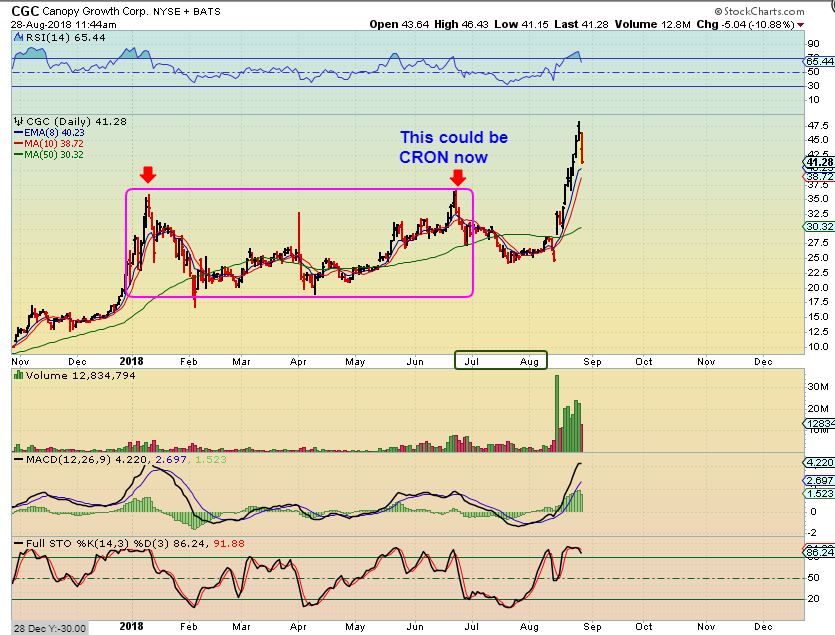
CGC-– Did you notice how CGC hit prior highs and then consolidated for a month before breaking out again? CRON & OGRMF just hit prior highs & stalled. What if they do what CGC did? Are you ready for that kind of a ride?…
CRON might look like this. This is a totally bullish chart, but I think that possibly todays reaction to selling in this sector was a bit of a wake up call for some.
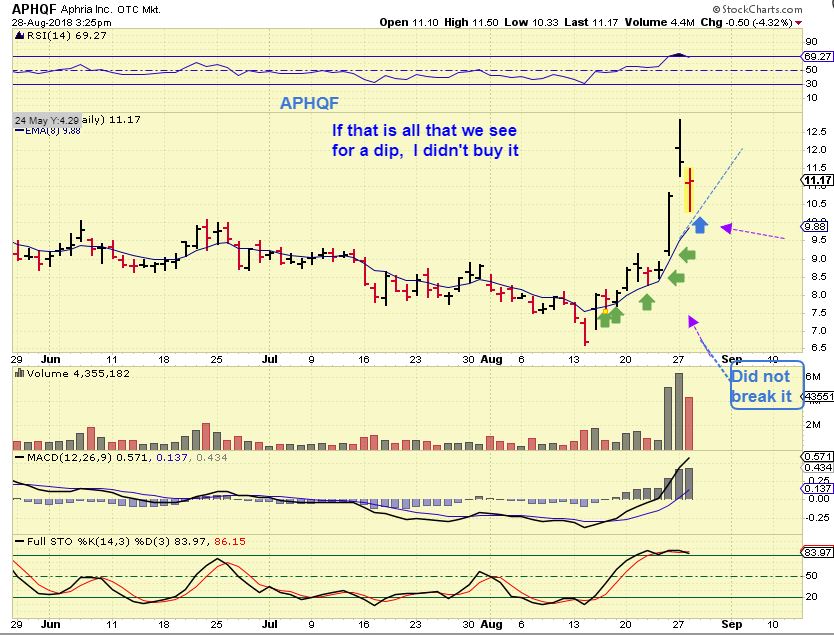
APHQF – This is a big drop. Almost $13 Monday, down below $10.50 Tuesday. OUCH. Notice how it rides the 8 Ema, many of these do …
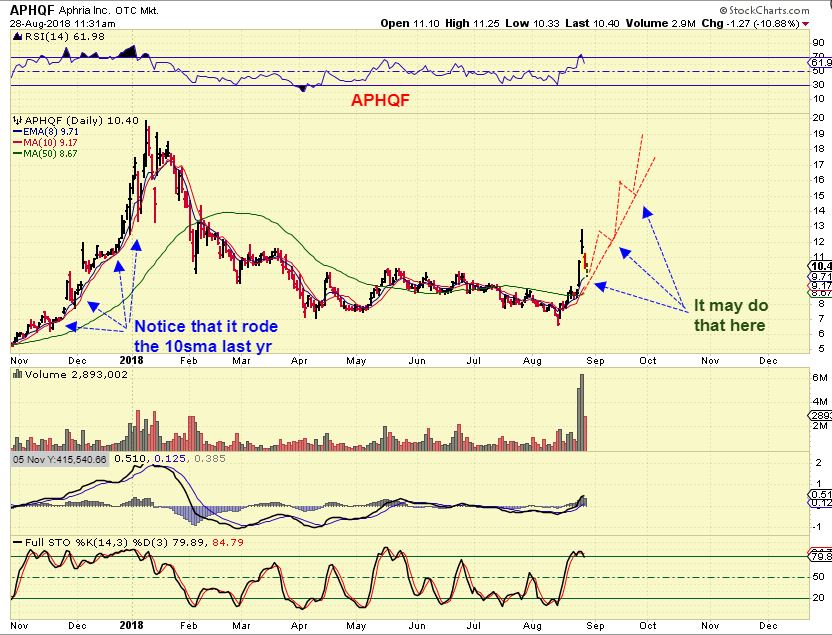
APHQF – I think that it is very likely that these will just climb their 8 ema or 10 sma , since they did in the past. Look at APHQF in November into January.
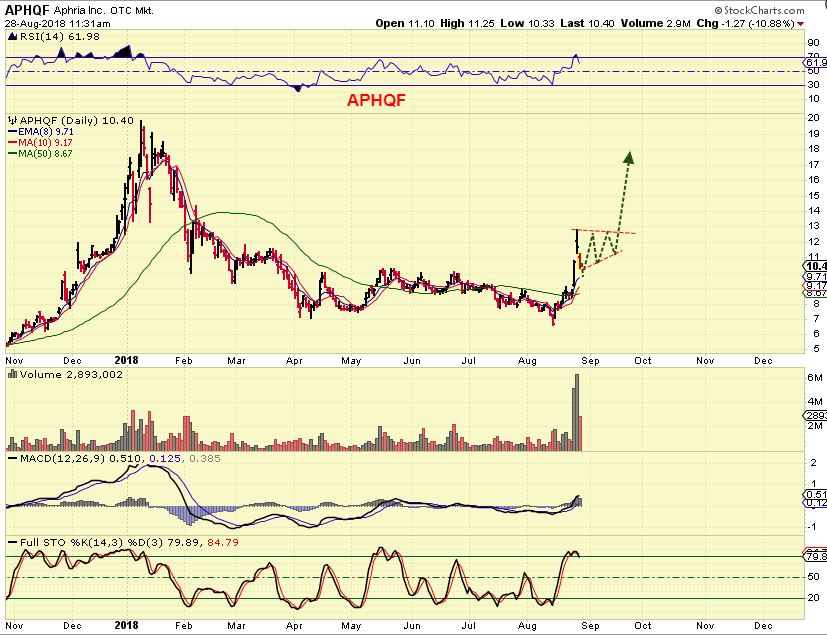
APHQF – However, what if APHQF Bull flagged? It just dropped $13 to $11 in a day, so it is not an easy ride, but this would be a very bullish chart.
AND NOW BITCOIN CHARTS ARE STARTING TO SET UP TOO? Look at 6 month charts of MGTI, MARA, HVBTF, BTSC, BTCS, etc – They are just breaking from bases again. Oh man, this could get crazy.

