August 22 – FOMC Minutes
The release of the FOMC Minutes from the last Fed Meeting is scheduled to be released today. At times, this can cause a reaction in the markets, if the verbiage or language that was used seems more Hawkish or Dovish than originally interpreted. For example, if they were to mention a concern pertaining to inflation rising faster than expected, that could affect certain sectors, so we just want to be mindful that the markets could move unexpectedly around 2 P.M. Eastern.
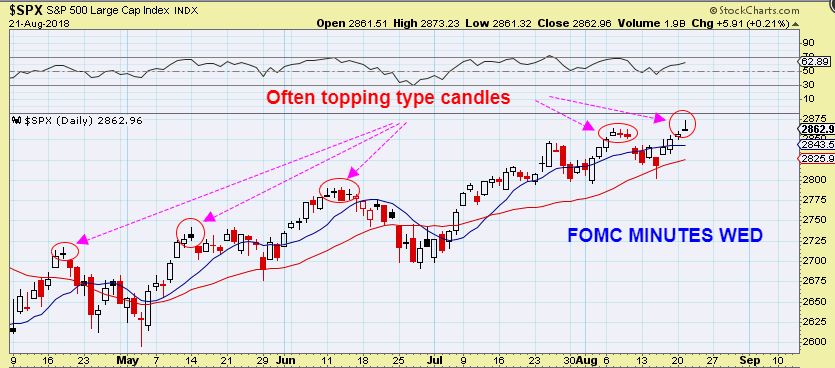
SPX #1 – Right where the SPX was about to break to new highs, it sold off a bit.
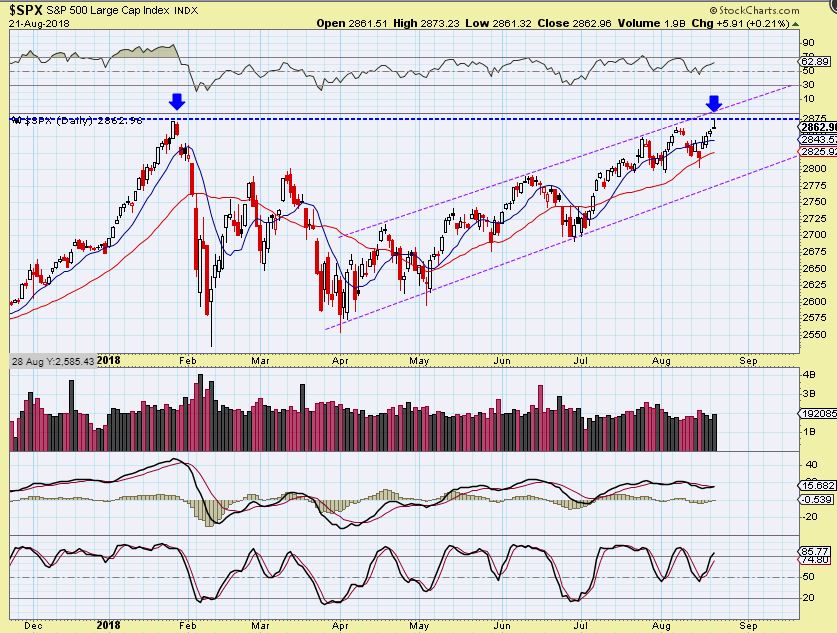
SPX #2 -Those are often topping candles (maybe just a short term pause), so we’ll see if the FOMC Minutes can Push the SPX right through resistance, or is this candle calling for some selling.
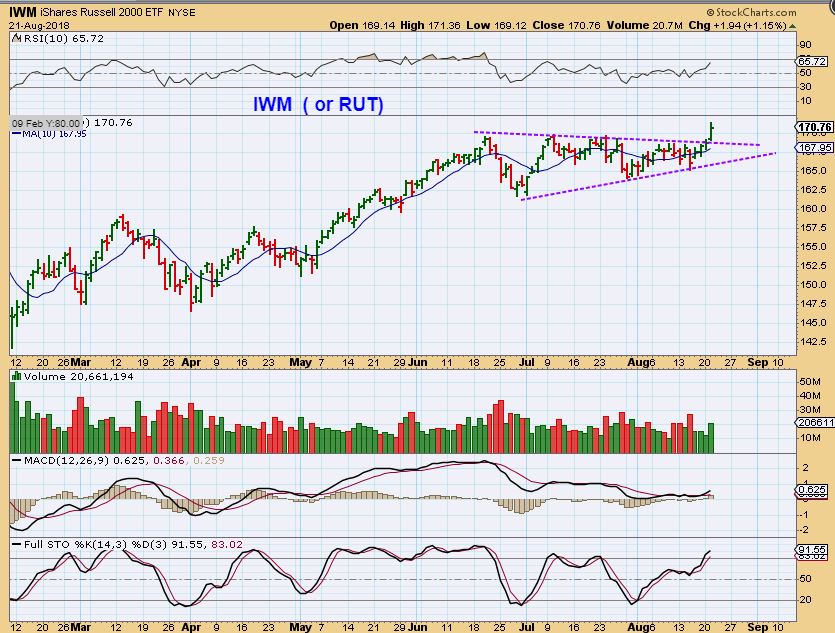
IWM – For days I’ve been saying that the markets looked mixed, and this looks like a bullish set up. This was AUG 14th.
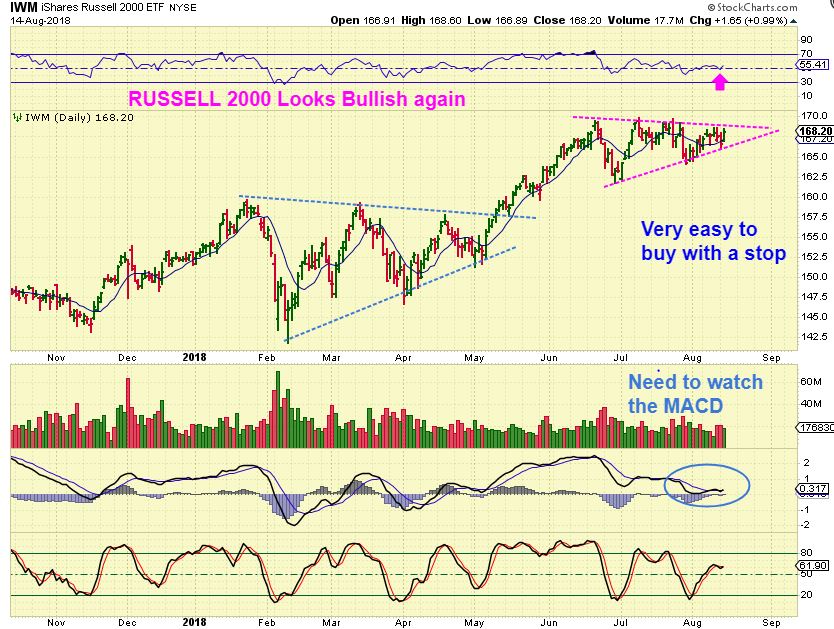
IWM – It broke out , and that is a buy with a stop, so…
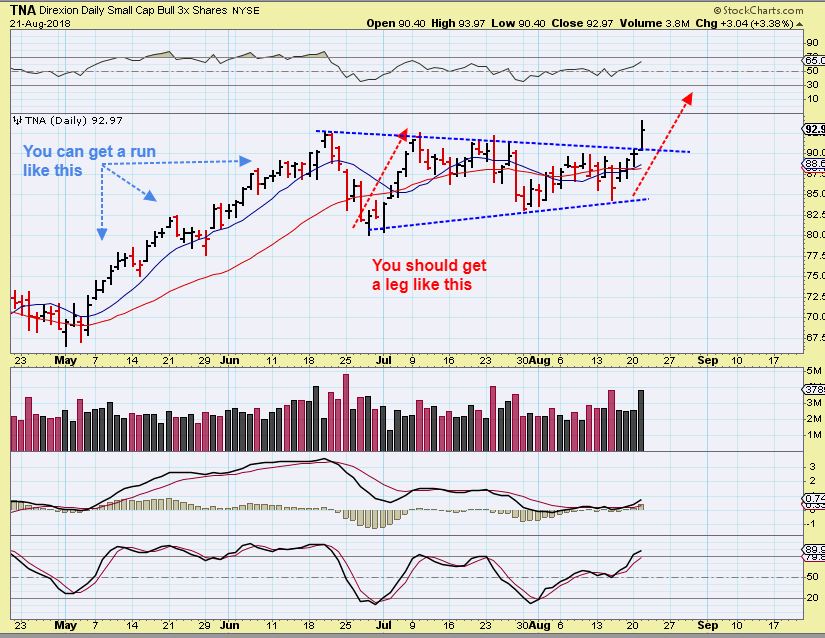
TNA – I have recommended TNA – a 3x Bull that doesn’t move scary fast, but can get some decent gains. I posted this in the comments from 10 a.m. as it was breaking out
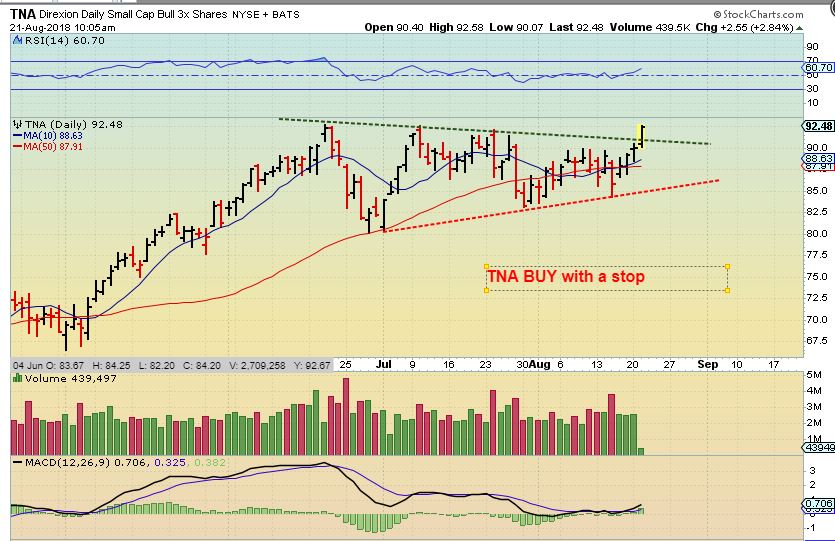
TNA -It should have further to go, and that was nice volume by the close.
QQQ – The NASDAQ moved higher and sold off again too. IF IT POPS HIGHER, you could buy TQQQ with a stop right at the trend line
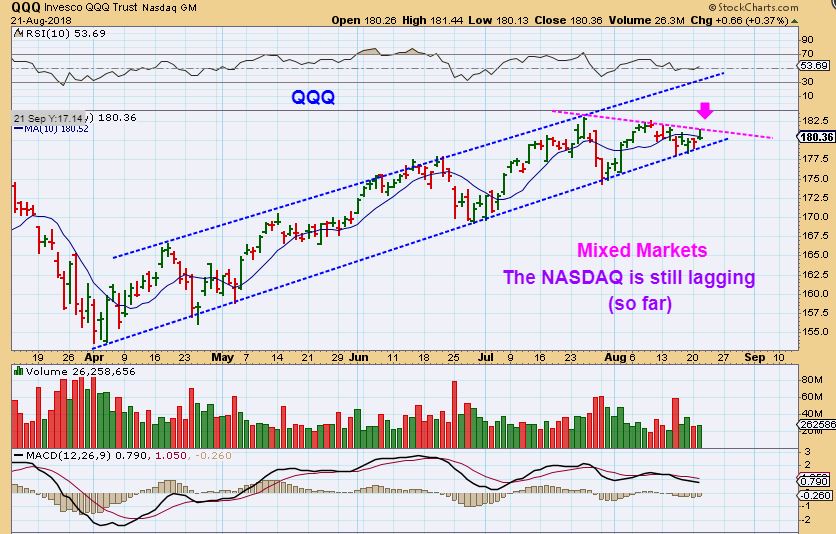
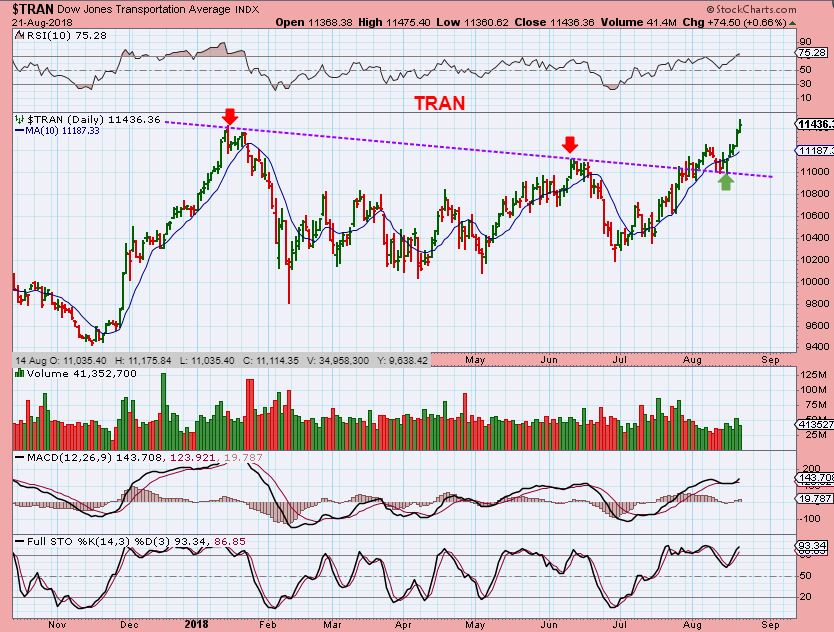
TRAN – After selling off in June, The transports have actually had a nice run from early July, back tested a break and continued higher. So we do have mixed markets, but maybe NASDAQ is getting ready to play catch up. The DJIA also broke out last week, as noted in prior reports…
So the General markets seem a bit mixed, and we’ve seen weakness in Tech with NFLX, FB, TWTR, and many of the IPOs that were flying high sold off too, however the Naz might break higher. Also, I found something else that was rather interesting, rather bullish, though I have been anticipating the timing for an ICL. Maybe we get another stronger daily cycle first? I will discuss what I just noticed at the end of the report.
.
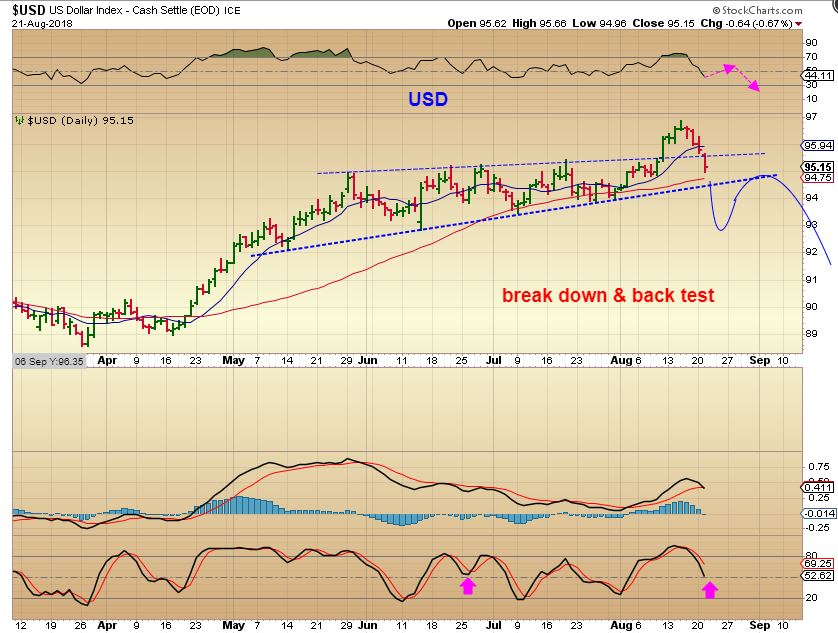
USD – Dropping to support areas. Can they hold the USD up? Will FOMC Minutes hold support or break support?
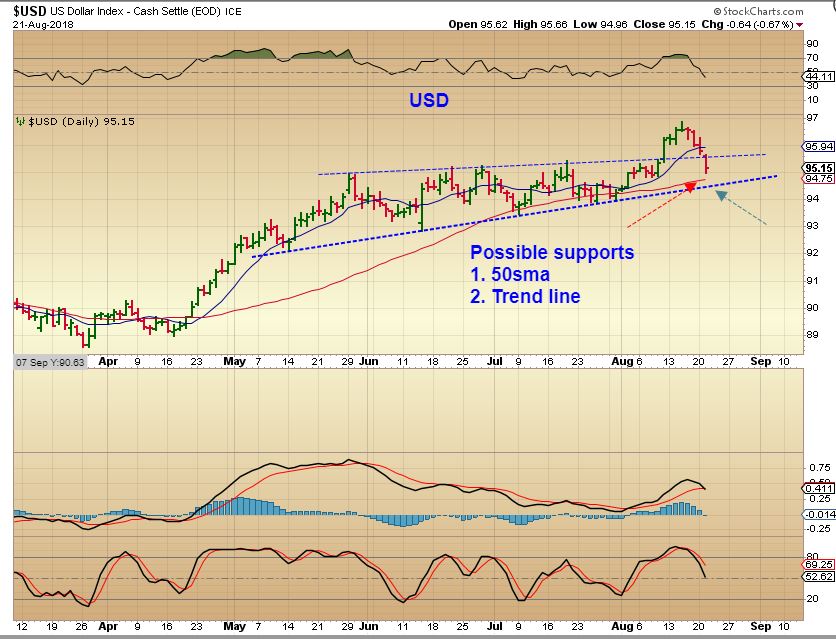
2 Possible Scenarios
USD – A dcl and FOMC Minutes cause a strong bounce that quickly rolls over
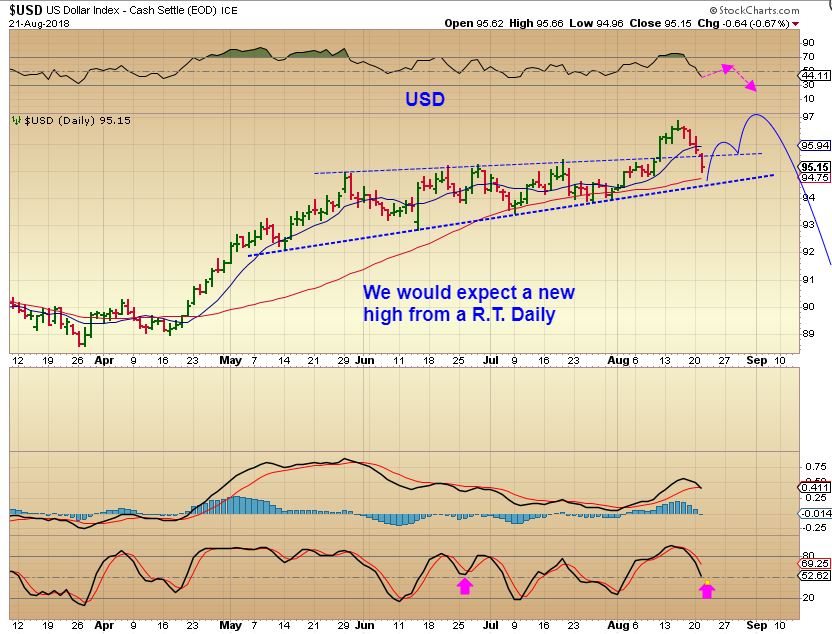
USD – Or the FOMC drops the USD under support and it back tests it after a dcl is in place.
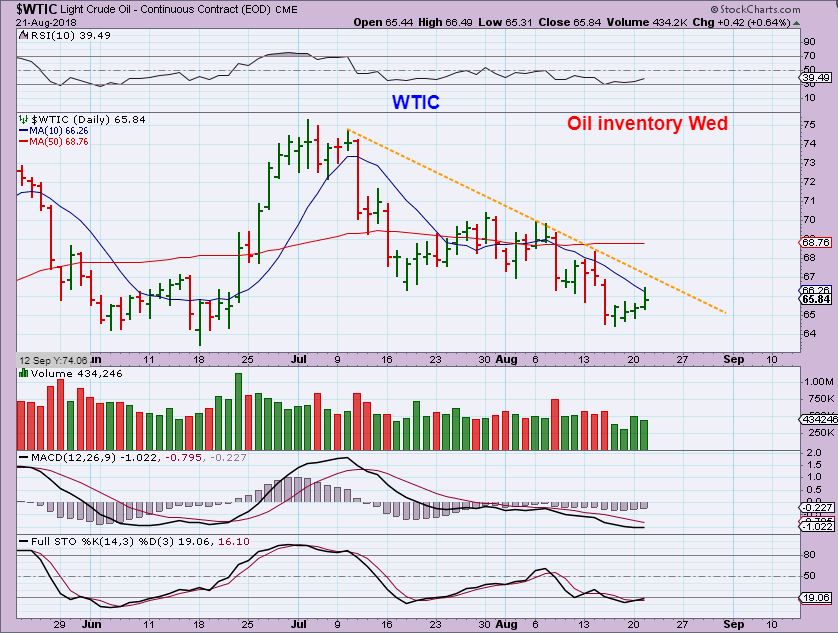
WTIC – Oil has remained fairly weak, the Inventory report Wednesday will reveal whether or not we got a dcl 3 days ago. We are within the timing for a daily cycle low, day 42 was the low Thursday. This was day 3 or day 45.
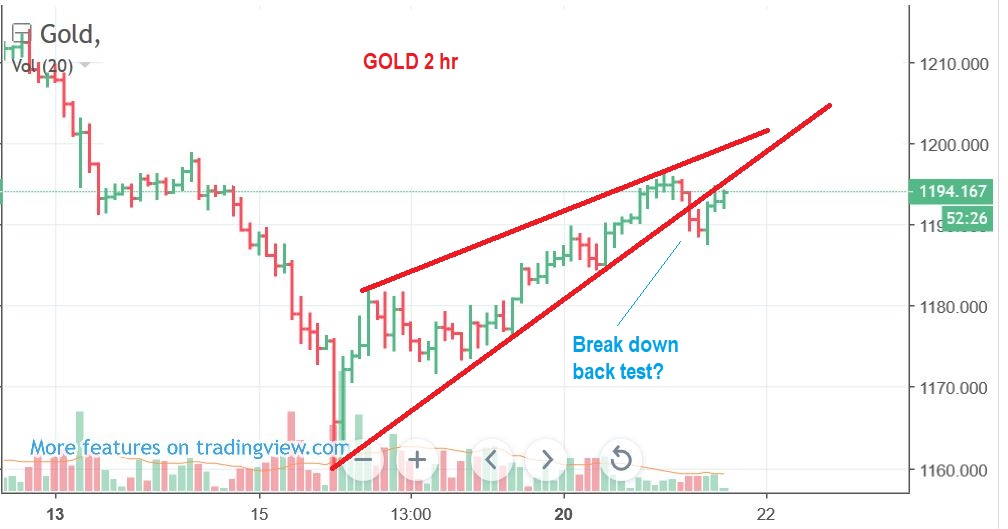
The next 2 charts are GOLD at the close. Notice that Gold did not get above $1200 on Spot Gold.
.
GOLD – I was posting Live gold charts in the comments section yesterday, then I saw this at the close. Are we in a channel, moving higher ( Bullish).
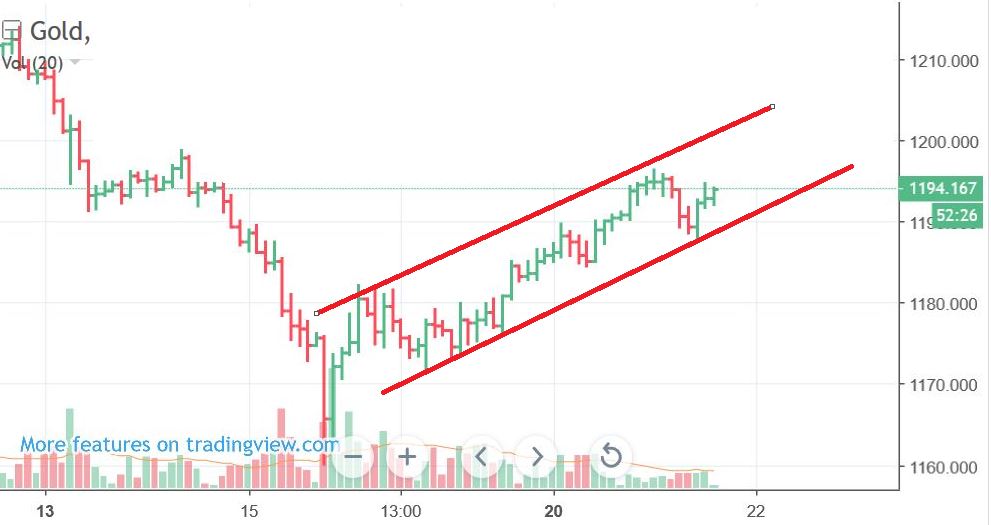
GOLD – Or did we break down and back test. I think that the FOMC Minutes will give Gold direction. IF GOLD DROPS, it may just double bottom and hold up at the lows.
.
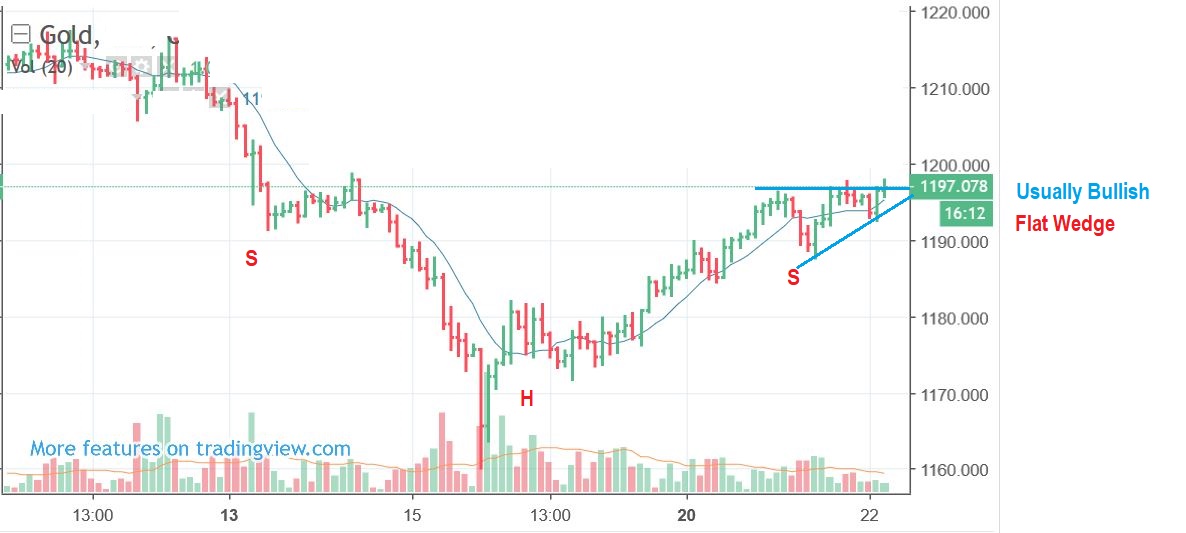
EDIT: I will insert a live GOLD CHART at the end of the report. It looks bullish.
.
GOLD – Stockcharts shows Gold hitting 1204 and selling off, above & below the 10sma, but I find this chart misleading, since spot never hit $1200. AFTER an ICL is confirmed, I will switch to stockcharts, but for now it is difficult to gauge where the 10sma & the trend line should be, since this chart changed with the contract change.
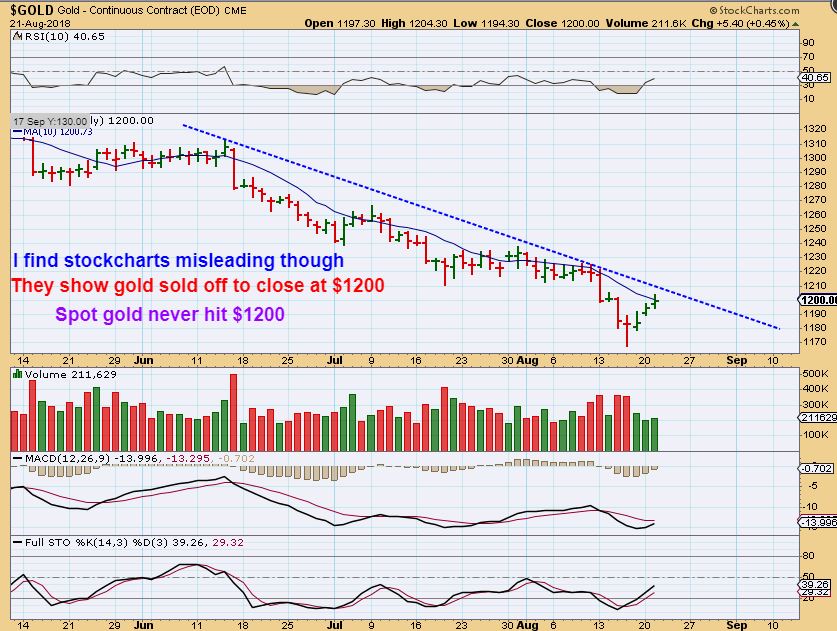
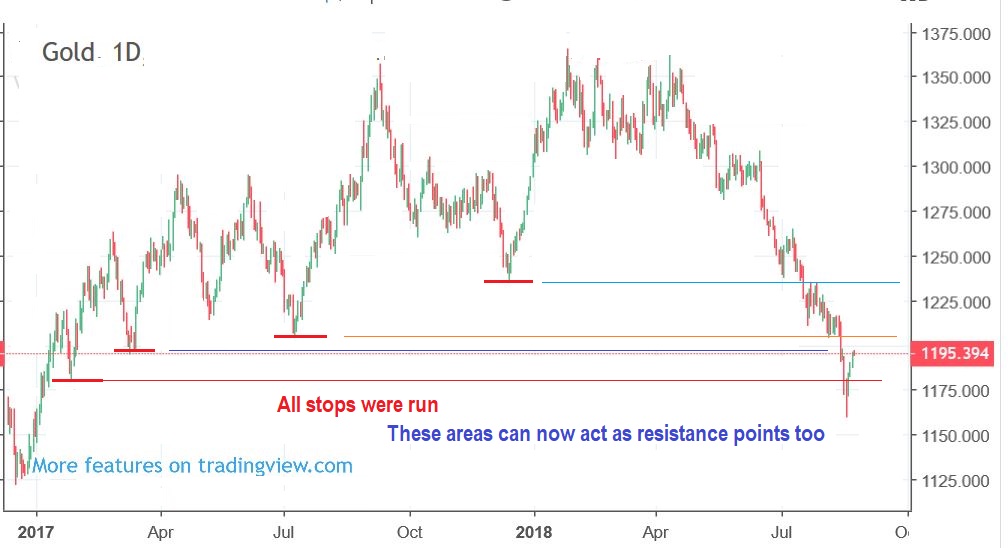
GOLD – Gold ran all of the stops ( except for the Dec 2016 Lows). These can be resistance on the way up, but if we get that short covering rally that the COT indicates could happen, this could just run straight up like it did out of last July or Dec ICLs.
EDIT: GOLD LIVE THIS MORNING
The 2 patterns on this chart are usually bullish. We’ll see if the FOMC Minutes can break this out higher
Similar pattern to what I am seeing in Gold this a.m.
Just the reminder that We are waiting to see what the FOMC MINUTES release does with the markets. I am watching individual Miners at their recent lows and looking for signs of a bottom too.
Please read the 2nd part of this report, and enjoy your Wednesday trading!
.
.
~ALEX
.
I have talked of mixed markets and some sectors looking bullish ( I pointed out retail and restaurants a couple of weeks ago) while others look bearish. Well, Housing has been selling off in a bearish manner for many months. Yesterday I started to notice at lunch time that HOUSING STOCKS were all POPPING off of the sell off lows. We may be seeing sector rotation again, where money goes from a bullish area to one that was bearish. This can help to keep the markets propped up. Just look at the following 5 Housing Stocks.
.
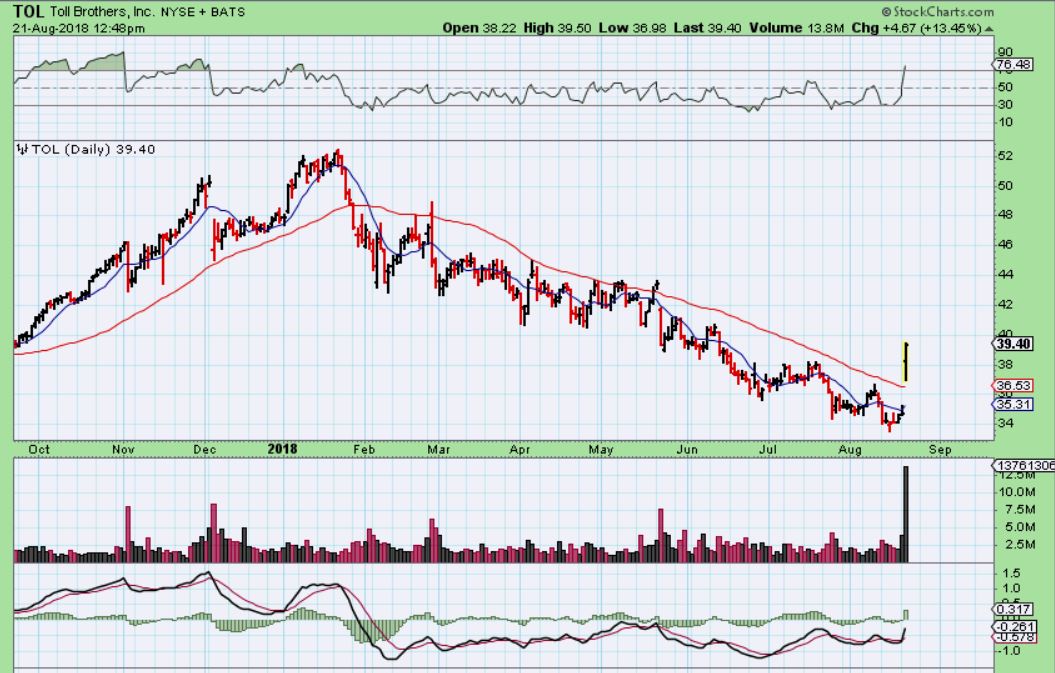
TOL – Look how bearish Toll Brothers looked in all of 2018. Yesterday at lunchtime I noticed a large Pop in housing. You can see the ‘timestamp’ in the upper left. These are not closing prices on the next 5 charts.
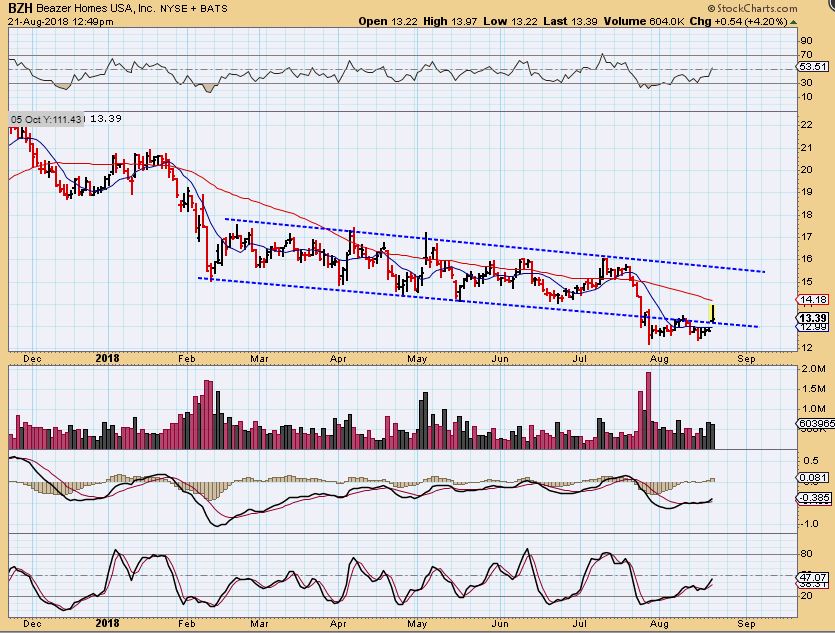
BZH – Through all of 2018 Beazer has sold off, but it Popped yesterday too. This is a small base & a pop.
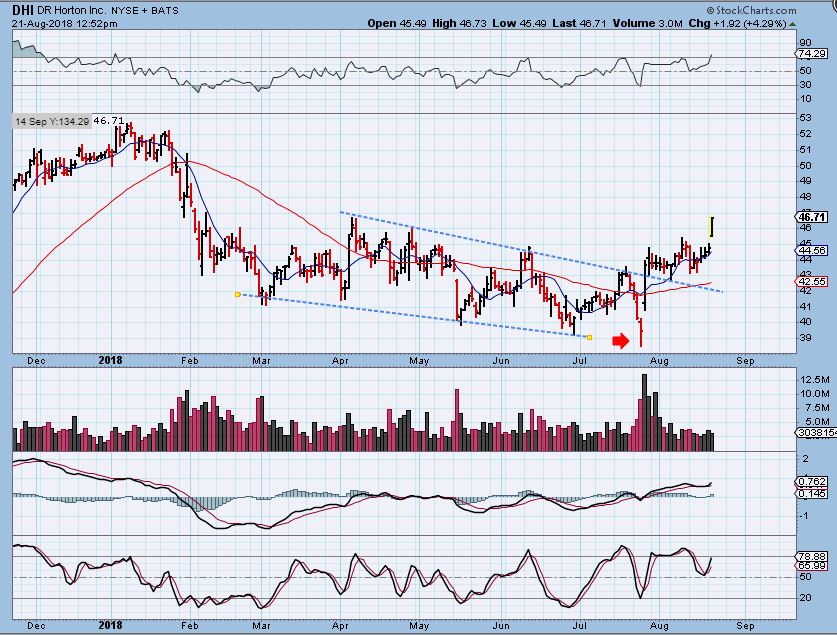
DHI – All of August has been constructive off of the capitulation lows. This is a bullish chart and may be what you can expect from BZR, TOL, and others.
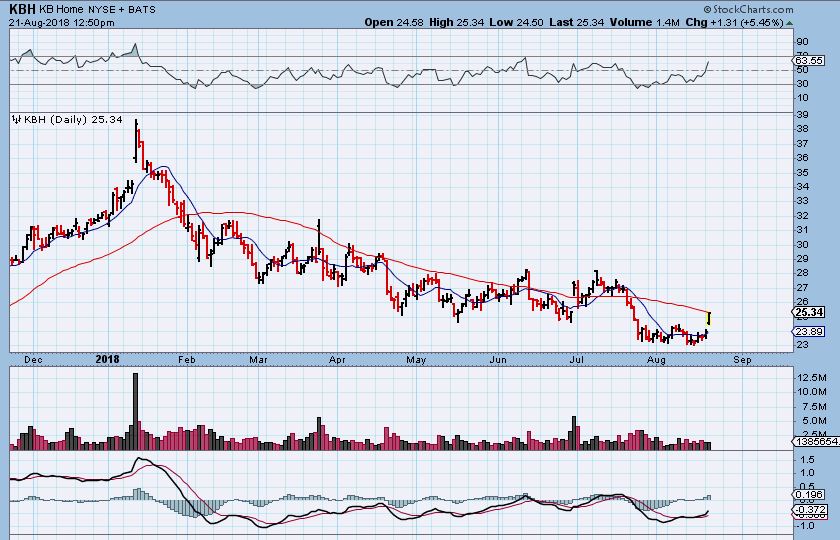
KBH – Another small base and a POP
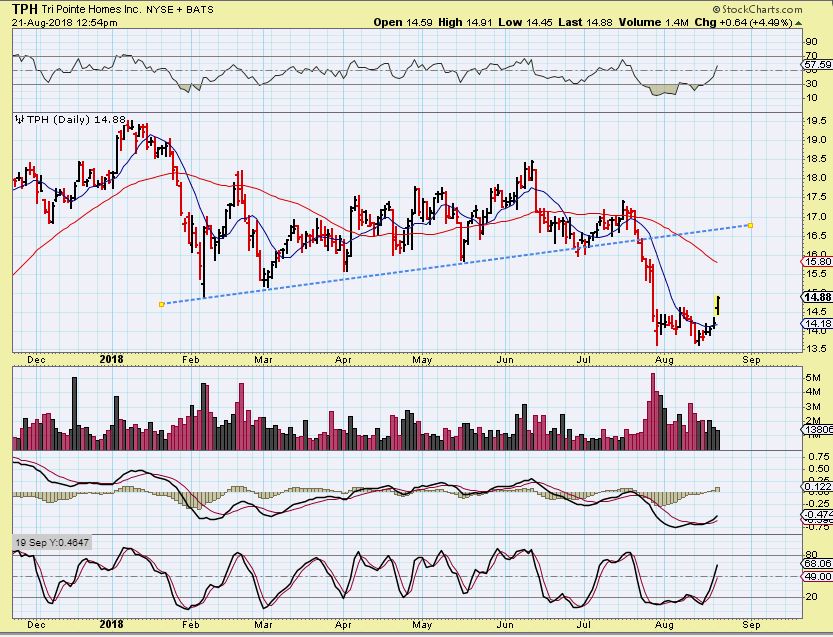
TPH – Another small base and a POP
So I Just thought that I would point out the somewhat Bullish attention that housing is getting. These also could be buying opportunities, coming off of the lows (A stop can be placed right under them). THIS is interesting to me, it also has me wondering, is it even possible that the FED is considering stopping raising rates? Or even trying to drop interest rates 1 more time?
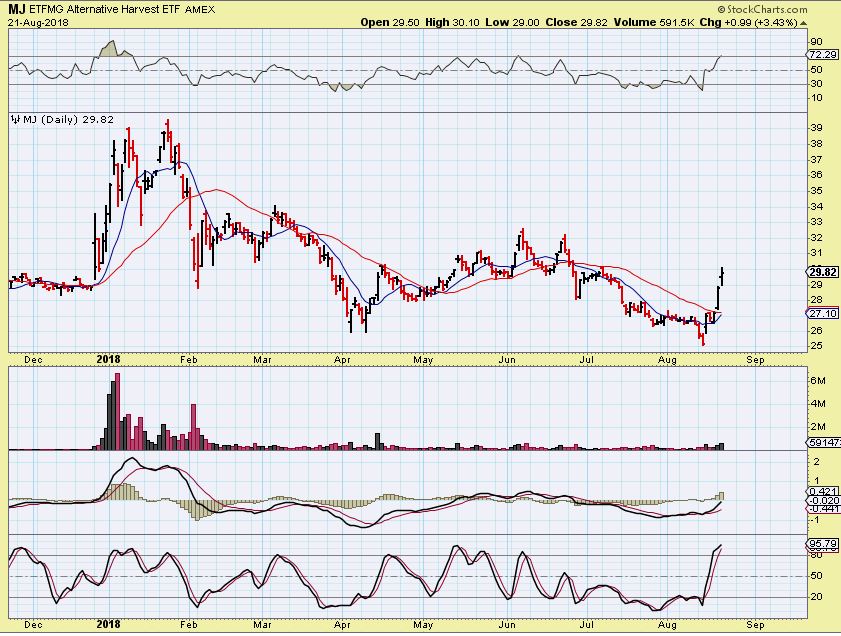
MJ – This is the ETF for the Medical marijuana stocks. I wish I had pointed it out 2 days ago as it sat forming a bull flag under that 50sma. $25 to $30 in a few days is FAST for a normal etf. This sector moves like leveraged etfs. It could keep pushing higher, but if it drops to back test the 50sma, it will be a buy.
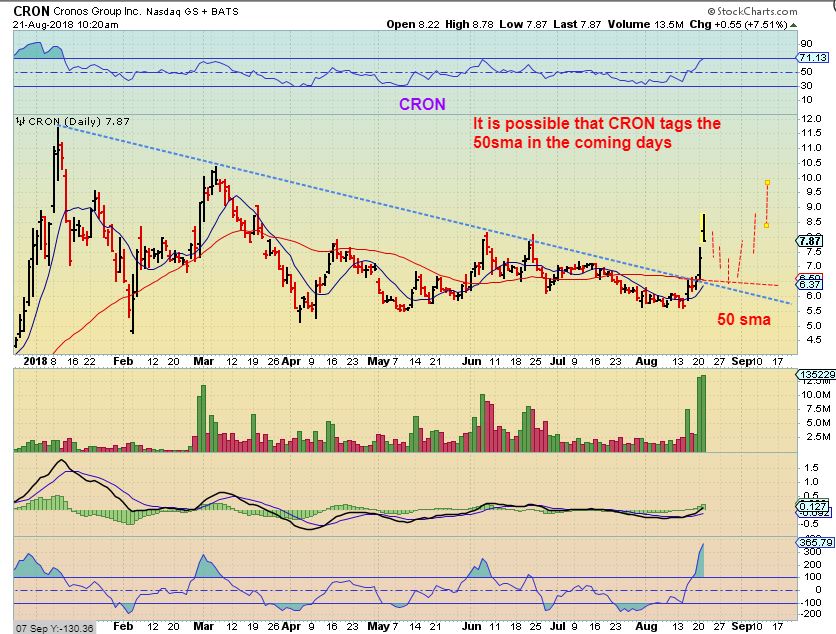
CRON – Notice the same bull flag under the 50sma that MJ ETF had. If you see an MJ stock with that, you may want to buy it with a stop 🙂 I used this in the comments sector simply to show a gap open was now dropping, it might tag that 50sma, but it closed the gap & reversed higher again. This still could happen over time.
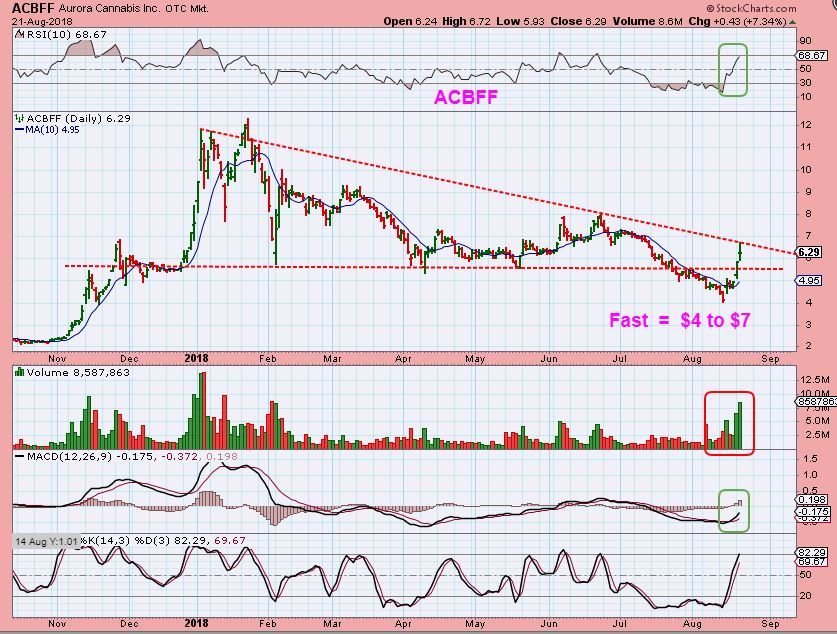
ACBFF – Notice the Bull flag just above the 10sma. I bought this one then. I mentioned several of these yesterday, and I just wanted you to see how very fast they move. The problem is, they can drop just as fast, so it is important to buy them while they are in their base, Or on support, ( You’ll see volume swell before they pop) or buy them on a back test of support later.
CNAB – For example, this is low in the base, but you see volume coming in. It actually ended up almost 20% yesterday alone, but these are known to move 20% a day for 2 or 3 days in a row. A 1 day trade is often all you really need to grab some gains and eliminate risk quickly. 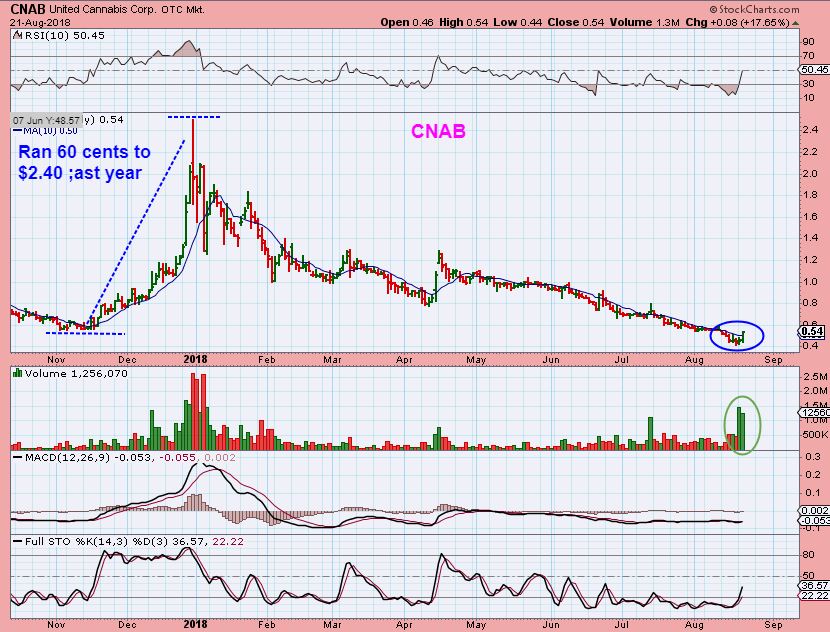
As mentioned yesterday, That is how these move and you MUST understand the risks. Many are OTC stocks, they can drop as fast as they Pop. Are you a day trader or investor? Are you in front of your screen to be able to manage them if they have a bad day? Etc etc etc .
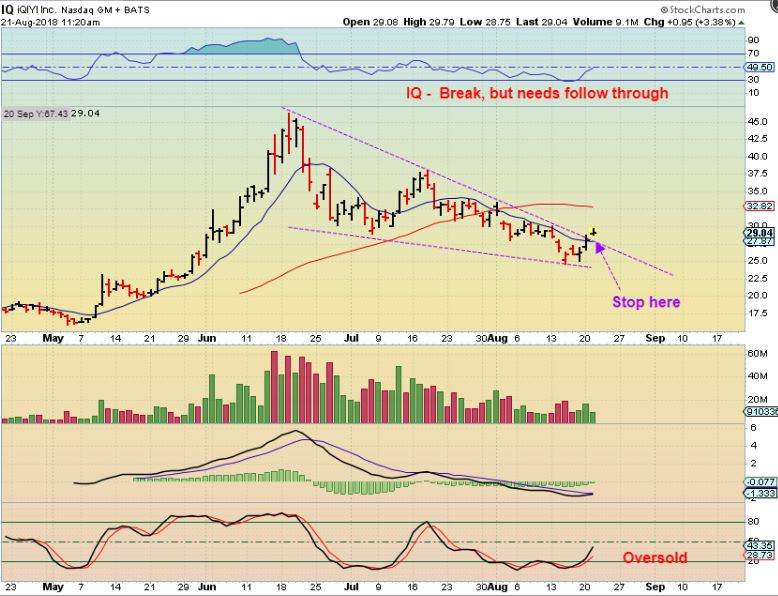
IQ – I posted this before midday, it closed at $29. It has moved above the 10 sma and could be a buy with a stop if you are looking for a TECK trade. I have to caution again about the FOMC Minutes and the fact that NASDAQ looks weak ( But small caps look good).
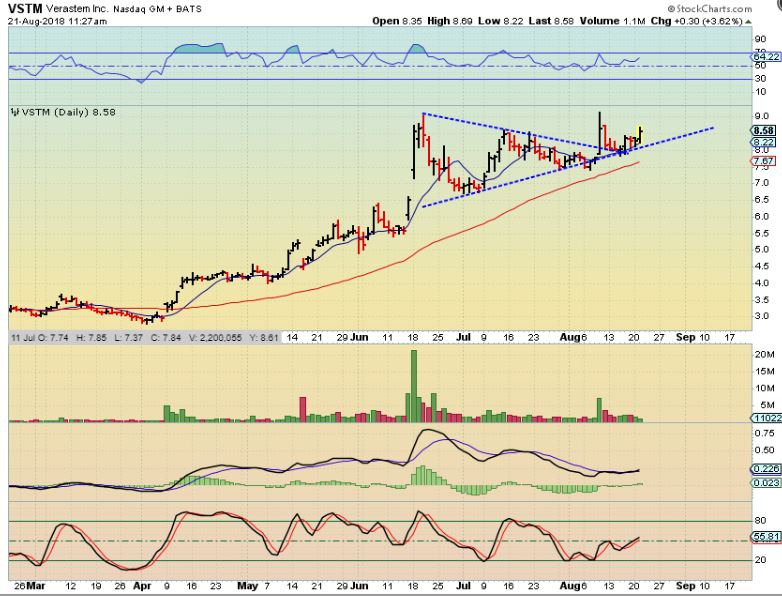
VSTM – Biotech can be tricky at times, but VSTM has steadily been rising all year long ( Choppy at times), and this set up is holding above the 50sma too. It is on a support trend line, so a stop could be placed under it.