Tuesday July 17th
This is a chart that I put in my report last Tuesday. The Financials ( Banks) were set to start reporting earnings, and this actually looked pretty good. Take note of the POP last Monday to the 50sma.
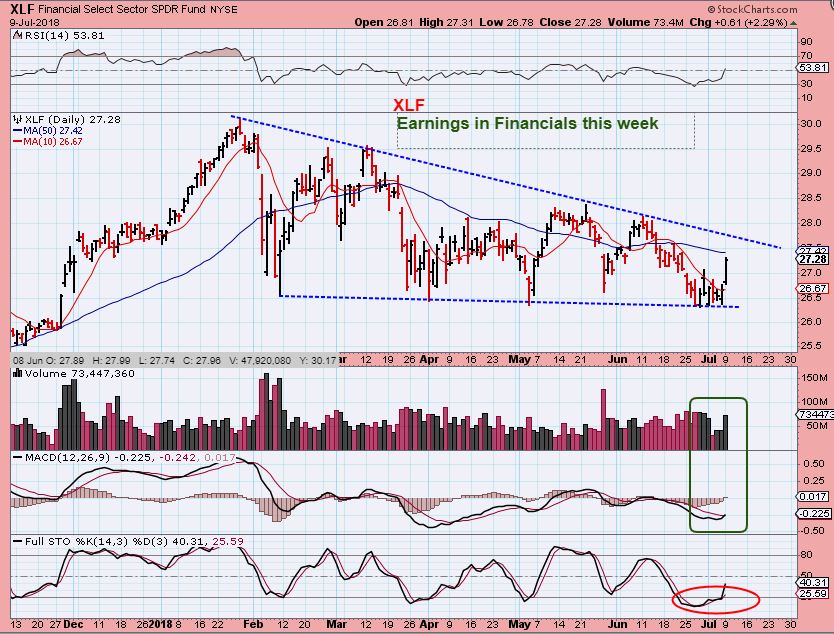
Lets take a look at the financials this week…
If you don’t feel like waiting for the Precious Metals sector, this is another set up that is Bullish. I personally am more focused on the precious metals at this point, but I do trade on the side for a living.
.
XLF – After I posted that chart & that POP, you can see that the XLF stalled Tuesday, Wednesday, Thursday, & Friday. So basically it flagged under the 50 & 200sma, as seen here. Now on Monday it POPPED again to the 50, 200sma, and the down trend line. It is a buy when it breaks out, but I personally would have bought it Monday.
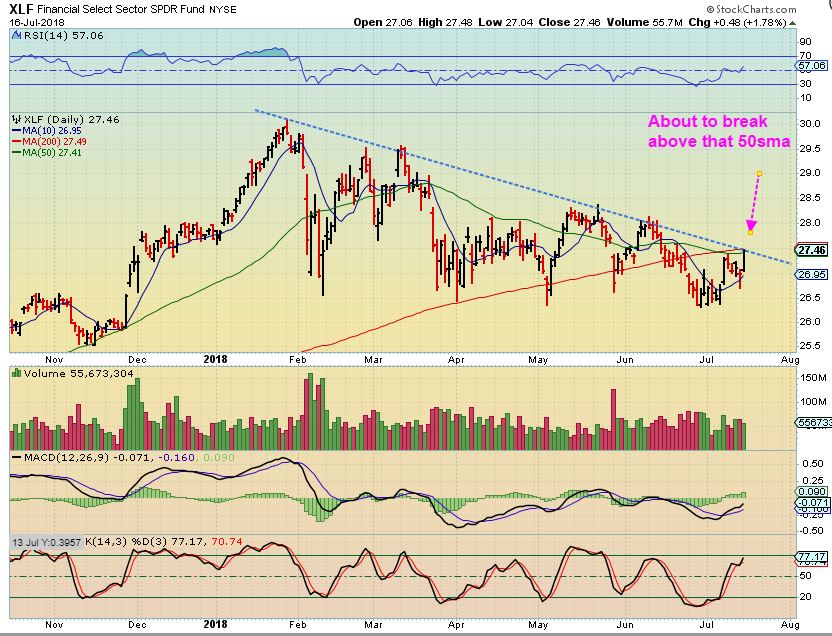
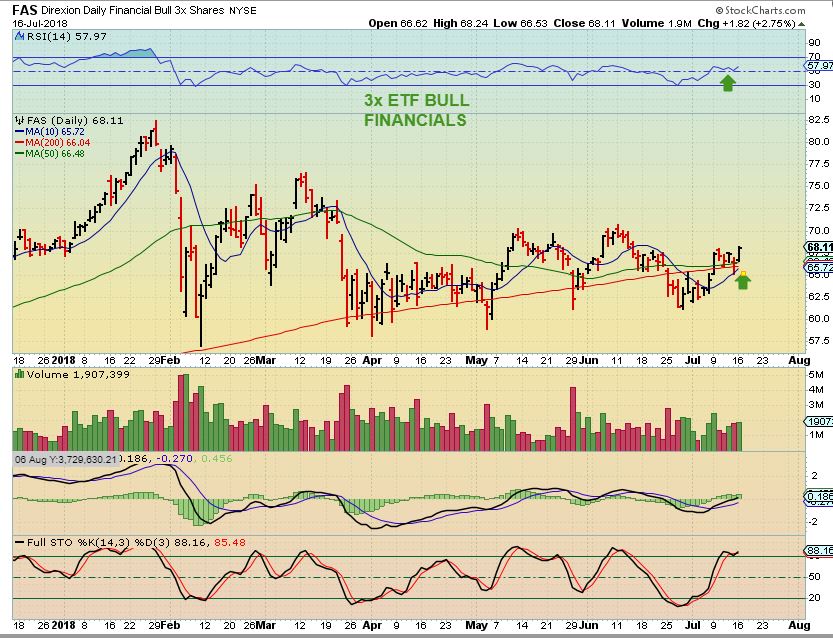
There is a 3x etf for the Financials, the FAS, and it actually sits on top of the 50 & 200sma, so you can use that as a stop.
When the Financials do well, it can often cause the General Market to rise with it, so this may benefit the SPX in the short term. I am going to post charts of some Bank stocks below to show the bullish look of a few bank stocks. These banks show that XLF or FAS should continue higher. You can also buy the individual stock if you wish, but do check and see if they released earnings yet or not.
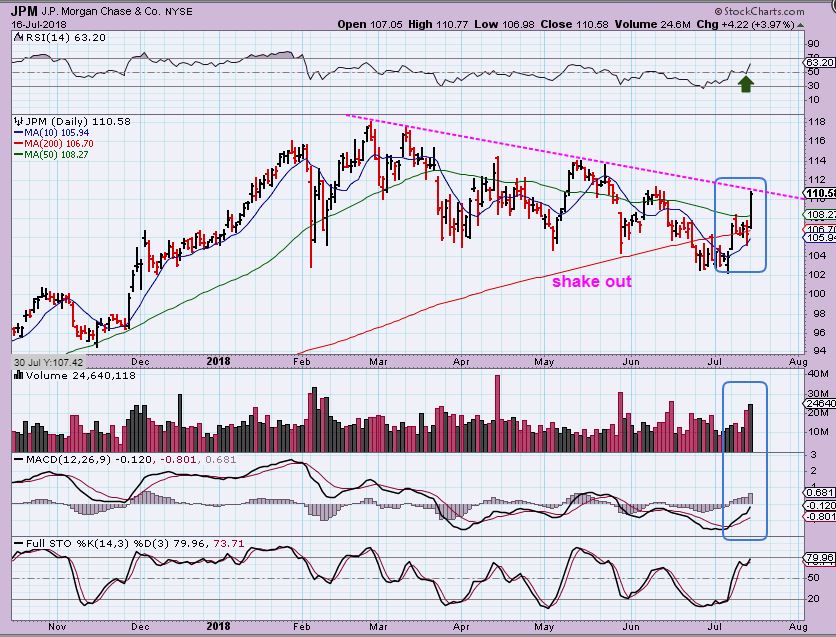
JPM – I was expecting JPM to release on Friday, and They did release earnings Friday at 6 a.m. I watched the stock drop Friday and it seemed to be weak. Monday it Popped and looks really Bullish.
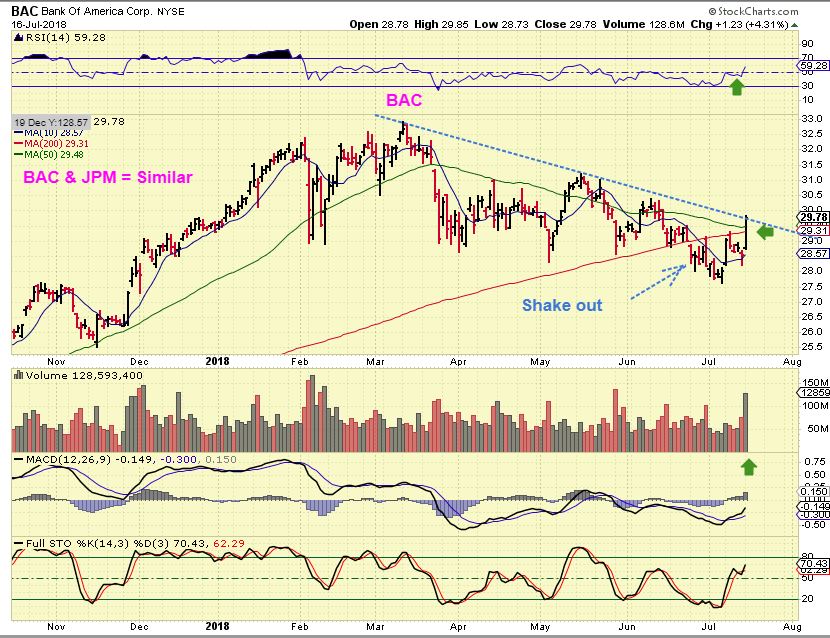
BAC is BULLISH- After reporting on Monday Morning, BAC broke above the 50sma, 200sma, and a down trend line too. Good volume. Buy it and use a stop.
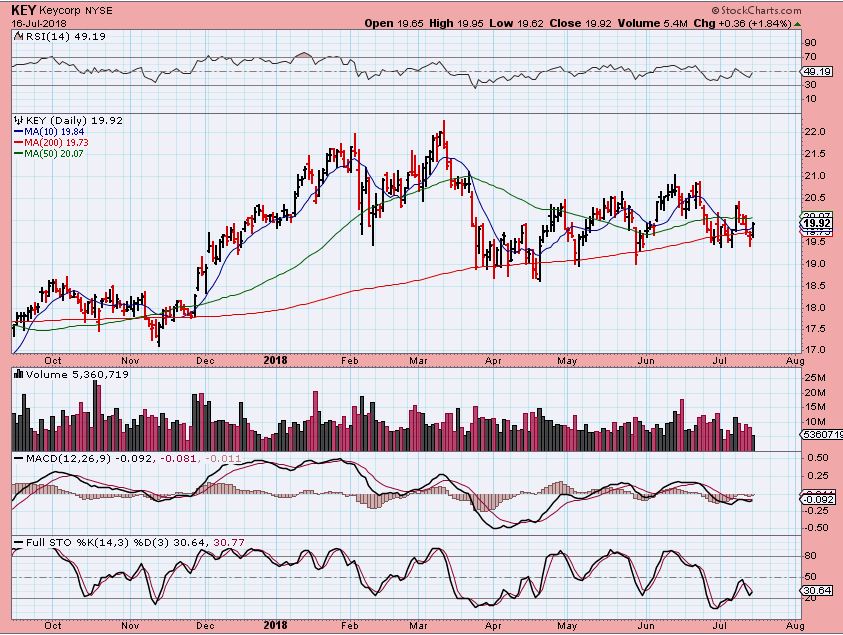
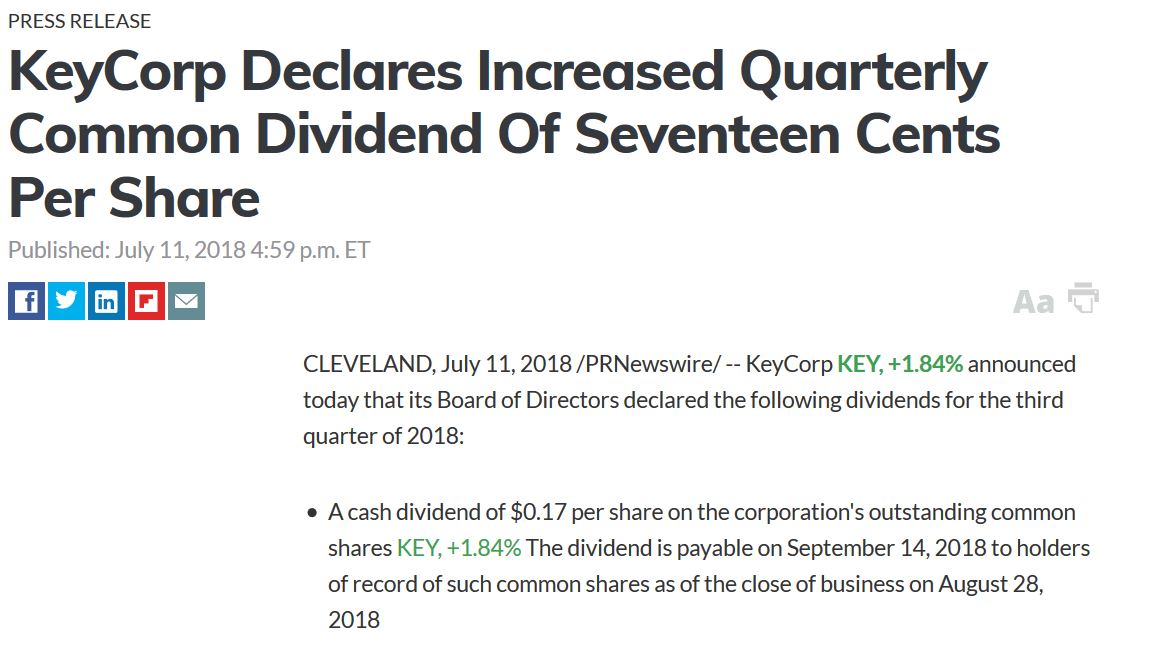
KEYCORP – This is basically holding up above the 200sma. If the sector moves higher, I would expect KEYCORP to move higher too. I don’t think that they released earnings yet, but on July 11th they declared a 17 cent dividend…
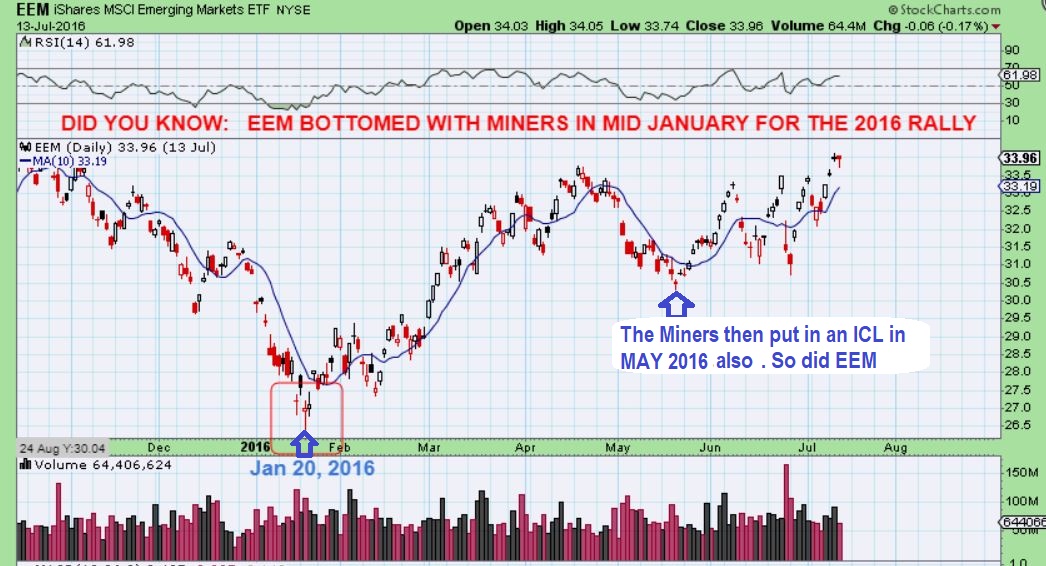
EEM- I used this in the weekend report to show that Miners and EEM seem to bottom at similar times in the past.
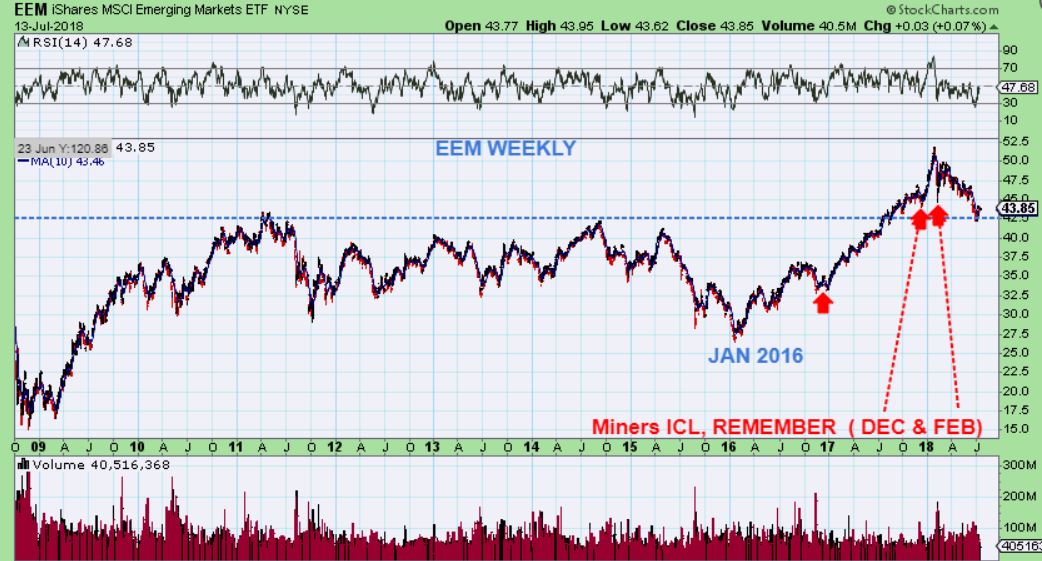
EEM -Then I showed this drop as a long term ‘back test’ for EEM. It seems to have bottomed in an ICL /YCL, so if you don’t want to wait for Miners or you trade on the side, this looks like a longer term low too. See the next chart…
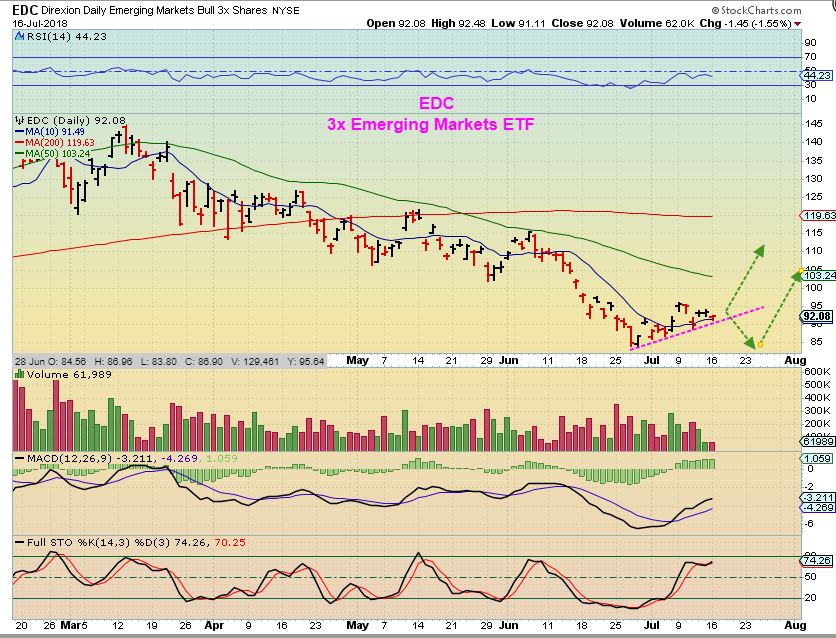
EDC – This is a 3x Bullish ETF for EEM. It looks to have bottomed when GDX & GDXJ did, but we saw GDX dip down to a double bottom so far, so I cannot rule that out for EEM (or EDC). Start small and add on Dips or follow through, if you are looking to go long.
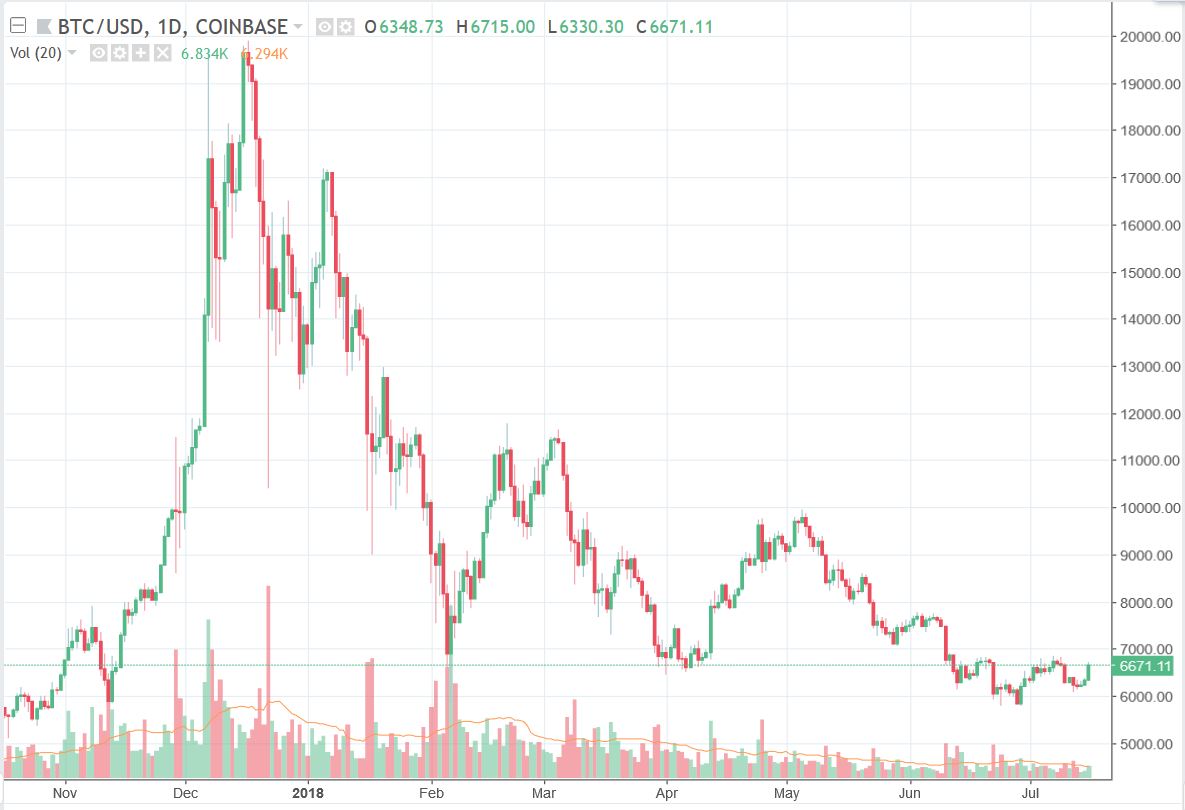
BITCOIN – I was looking at Cryptos and BITCOIN , LITECOIN, ETHEREUM, RIPPLE, etc look ready to bounce, and these bounces have been pretty good when they arrive. They are DCLs and the BITCOIN Daily cycles seem to last 2 months, so you can get a good bounce out of that before it dips down again. These are coming from a base pattern after a parabolic top, but SO FAR still making lower lows and higher highs.
.
TRADE IDEAS FOR THE RESTLESS
.
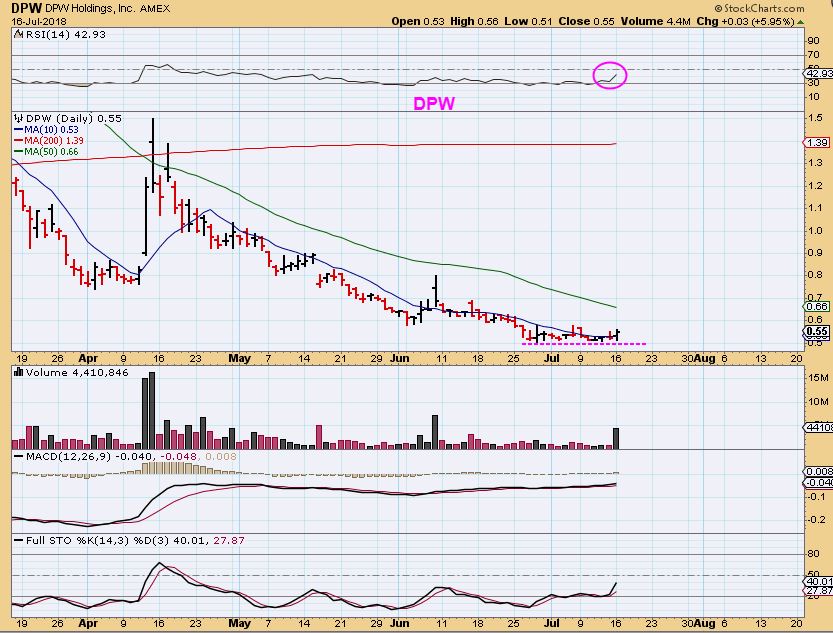
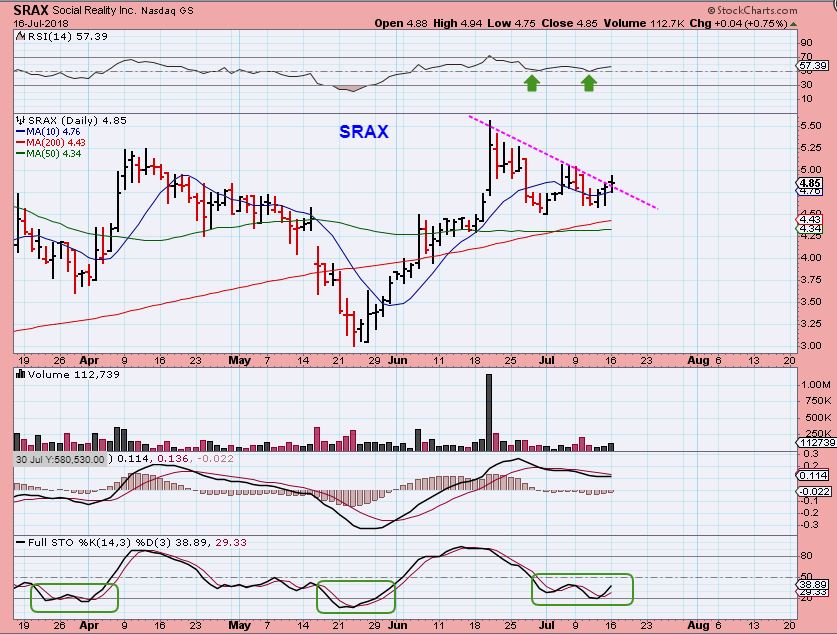
That said, some of the Blockchain trades that we have done in the past may benefit. MARA, MGTI, DPW, SRAX, SSC, BTSC, BTCS, etc may make for a good fast trade or medium term, if you are looking for a short term trade idea. These are fast movers and considered higher risk for that reason. I may post a few more of these in the next few days if they continue to shape up. Some are currently at lows …
DPW & MARA popped out of the lows. See their charts. Mara looked quite good, DPW looks possibly ready to bounce too with that volume pop.
SRAX– This has already been bullish out of the lows and looks good now too.
PRECIOUS METALS
.
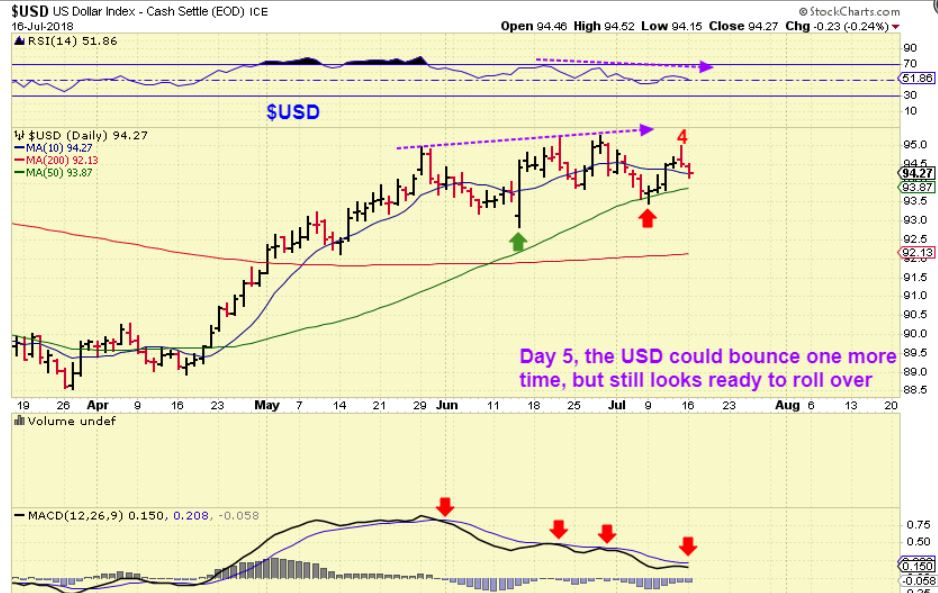
USD – As expected, the USD is weakening, With a day 4 peak, I could see this bouncing, but this definitely looks like the topping process that I have been expecting.
,
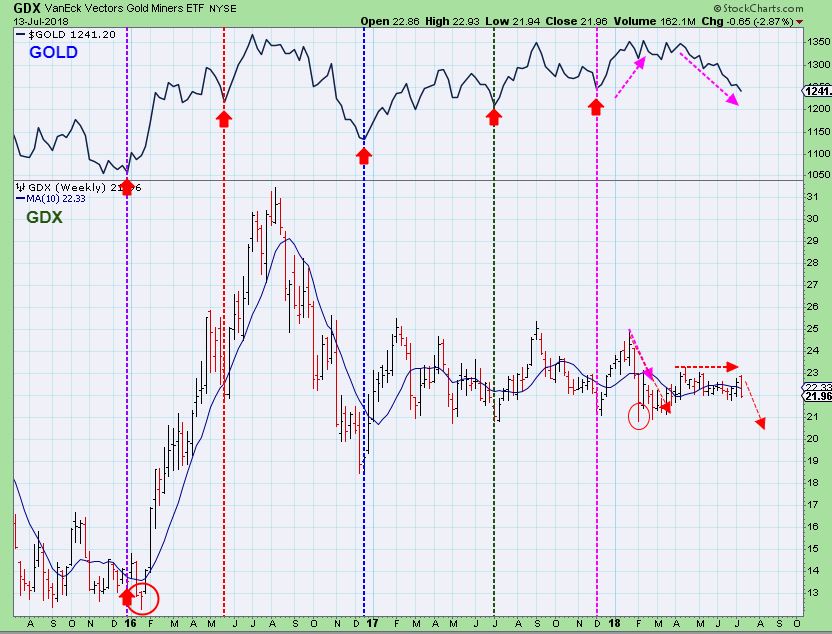
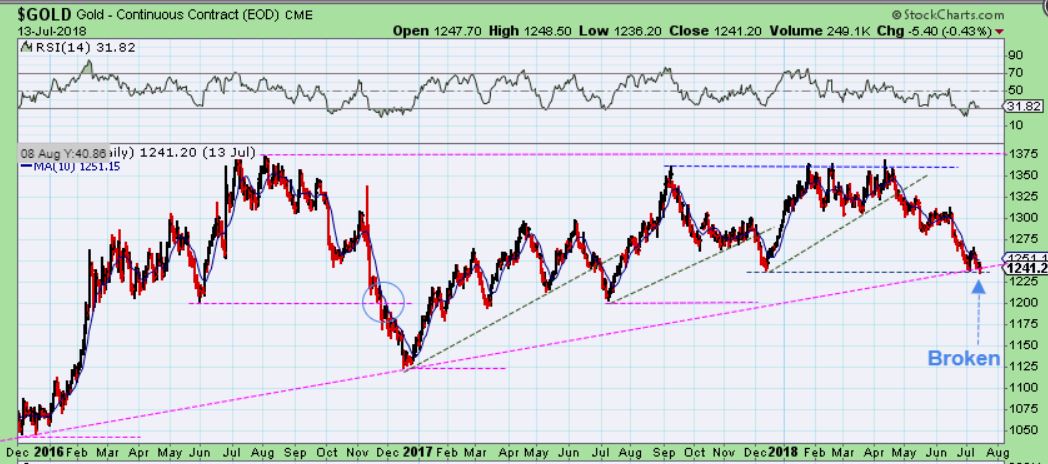
GOLD & GDX ICLS – I wanted to see how they line up, knowing that in 2016 the GDX ICL came after the GOLD ICL. In most cases, it is usually within a week or so. The lines are overlaying GOLDS ICL, GDX Lows can be seen near the line or also on the line.
It is noteworthy that GDX sold off to lows in FEB, Gold didn’t. Recently GOLD sold off and GDX has not. It is now a matter of will it play catch up or just hold up?
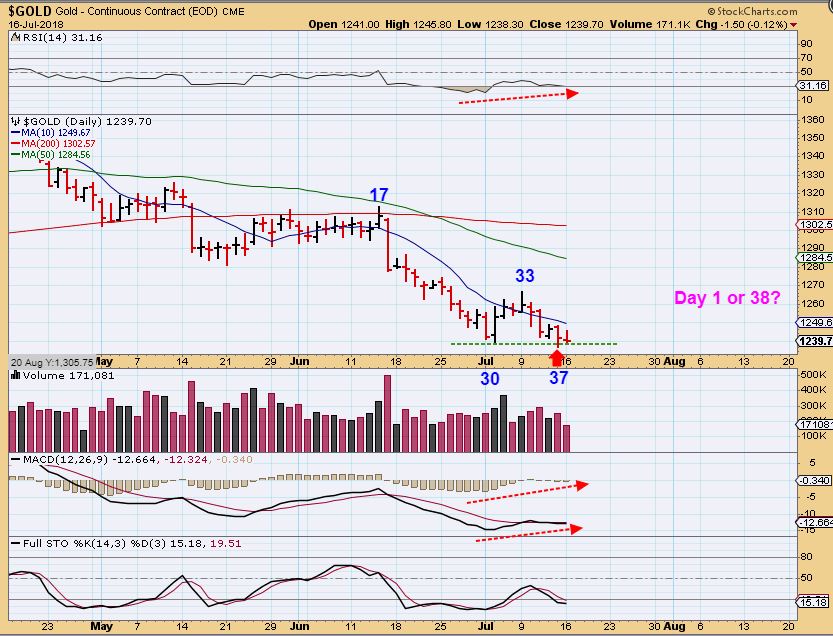
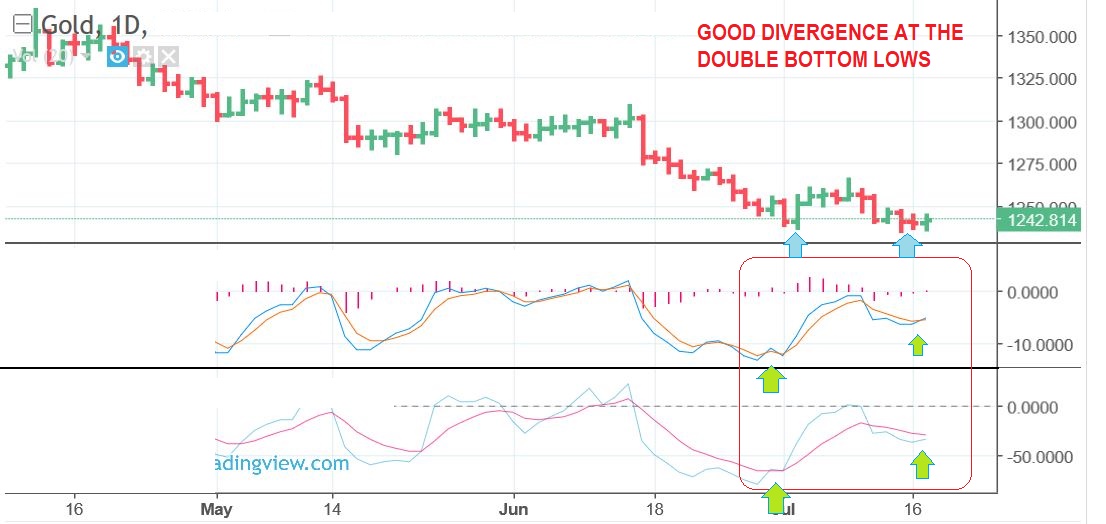
GOLD – So as of Monday, Gold bottomed on day 37, and Monday was day 1 or day 38. We do have bullish divergence forming in GOLD.
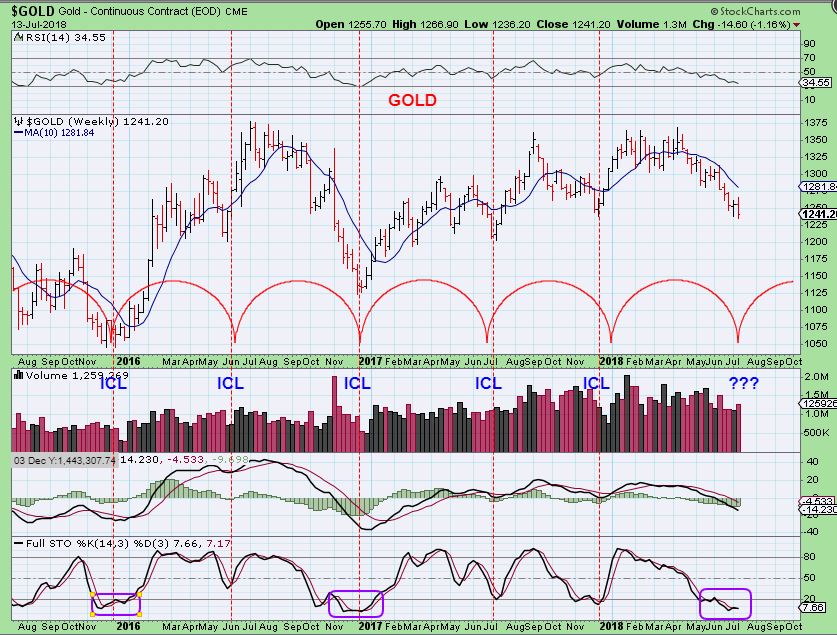
GOLD WEEKLY CYCLES – WE ARE DUE HERE
AS I SPELLCHECK THIS REPORT: LIVE GOLD 6:30 A.M. Eastern Time – I do see divergence and the indicators are curling up as price goes sideways. This is part of the ‘bottoming process’, and I think that we’d need a burst higher to probably $1275 in order to cross indicators into positive territory, above the zero line. We do not have a swing low in Gold yet.
LONG TERM OBSERVATION
.
GOLD – NOT TO ALARM ANYONE, BUT I WANT TO SHARE THIS OBSERVATION. THIS CONCERNS ME LONGER TERM, BUT NOT ON THIS ICL. In the 2008- 2011 run,we had higher lows, higher highs. In other words, NO ICL WAS BROKEN ON THE WAY UP UNTIL 2012. This is the same for 2001-2008. When the PRIOR ICL lows were broken, it then rolled over after a final strong rally. SEE THE CHART. The MAGENTA lines are ICLs WHY DOES THIS CONCERN ME?
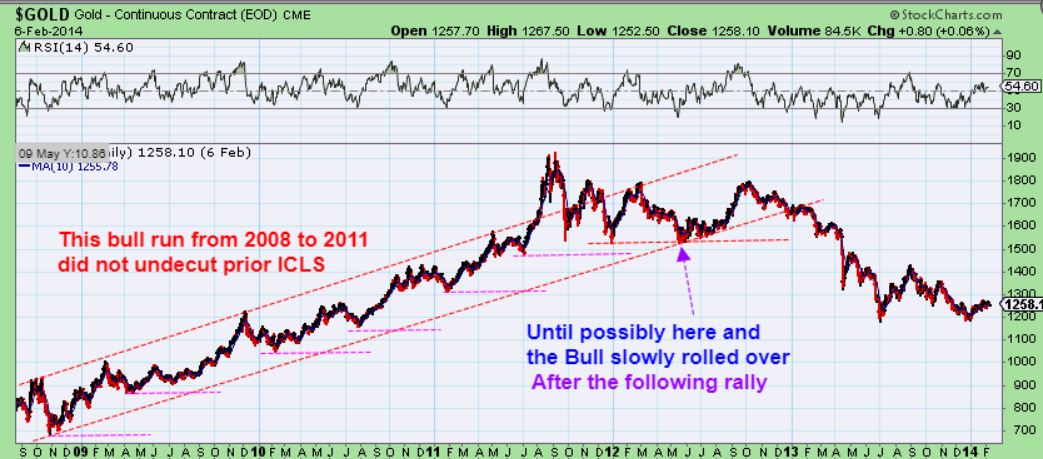
GOLD – THIS CURRENT ICL DIP BROKE THE DEC 2017 ICL, SO I STILL EXPECT A SOLID RALLY OUT OF THE ICL, BUT THIS WILL NEED WATCHING OVER TIME. Note: The May 2016 ICL was broken too, but we have rallied for almost 2 years after that Dec 2017 ICL So it might not be a big deal. It will still be something that I will keep an eye on.
MINERS
GDX – From the weekend report, GDX can sell off into an ICL for Miners
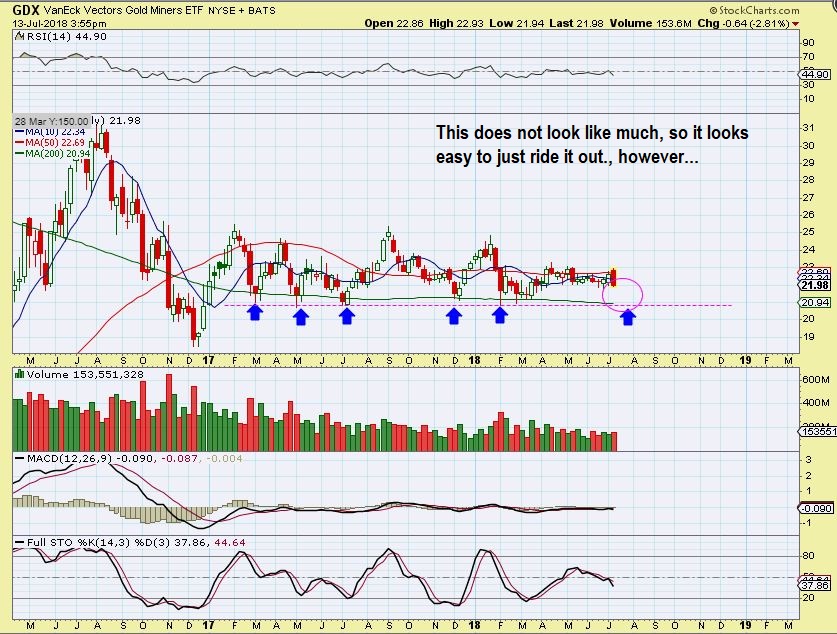
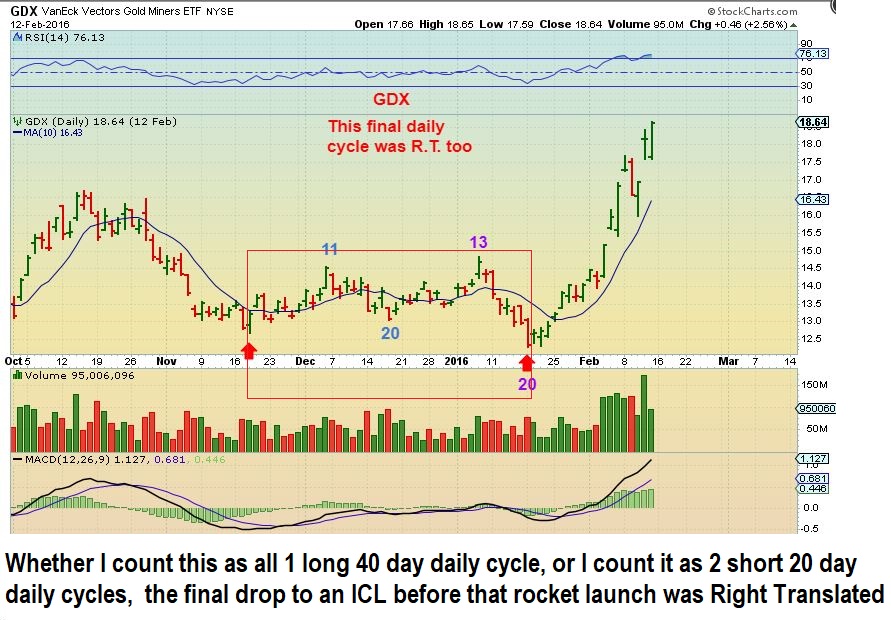
GDX- AND THAT FINAL SELL OFF DID HAPPEN IN 2016, but it was followed by a sharp rally.
GDX #1 – So please know that we could see this type of a stop run.
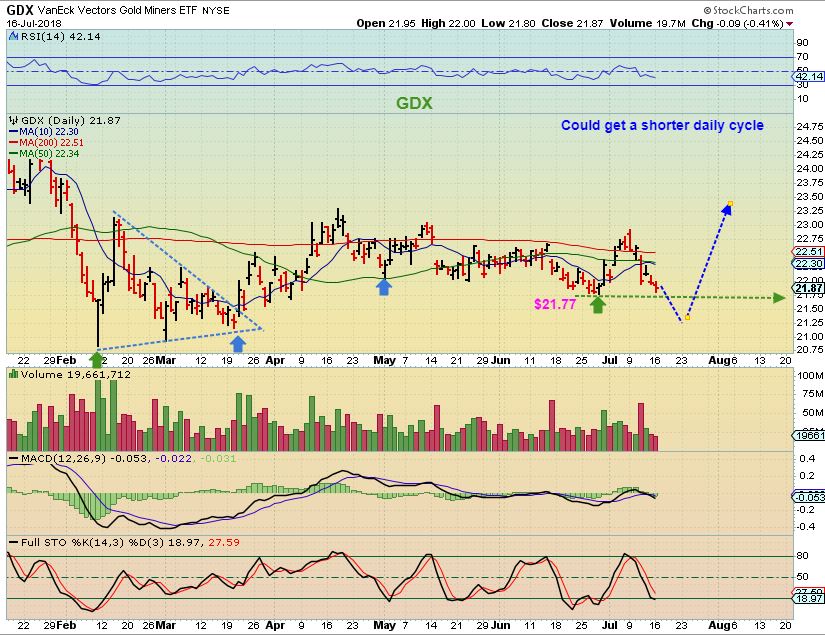
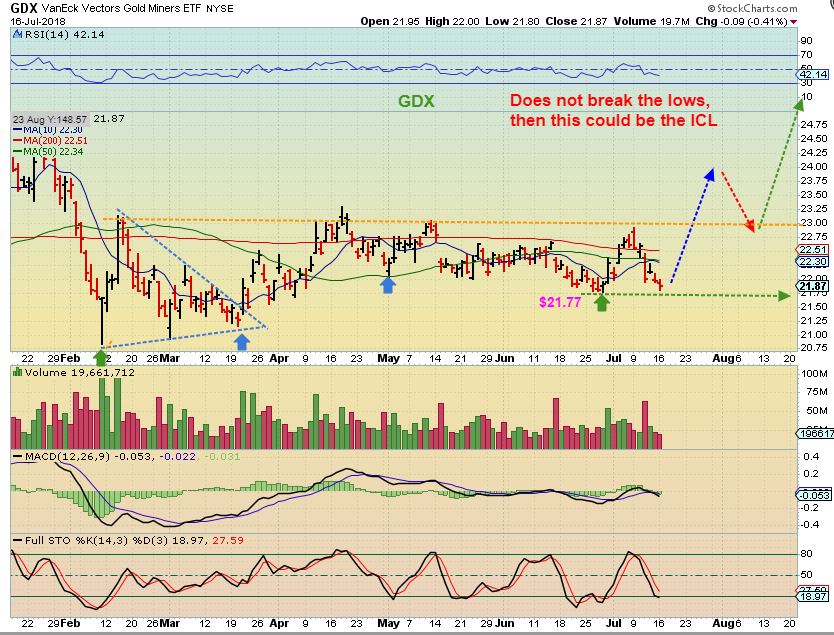
GDX #2 – If GOLD bottoms and $21.77 doesn’t give way, this would be day 11 and Miners Might have bottomed a week or so before Gold. Remember, they didn’t all line up in that chart above.
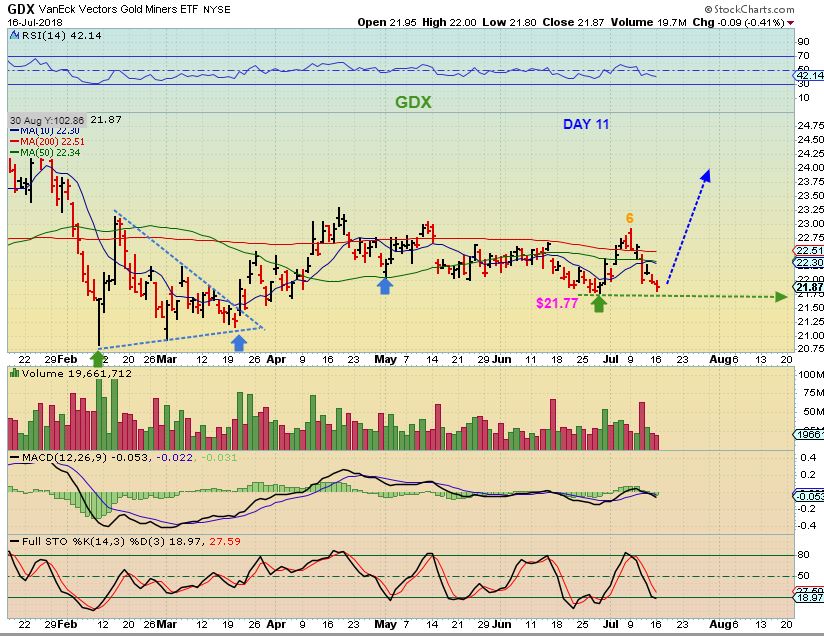
GDX – Again, watching $21.77 prior lows.
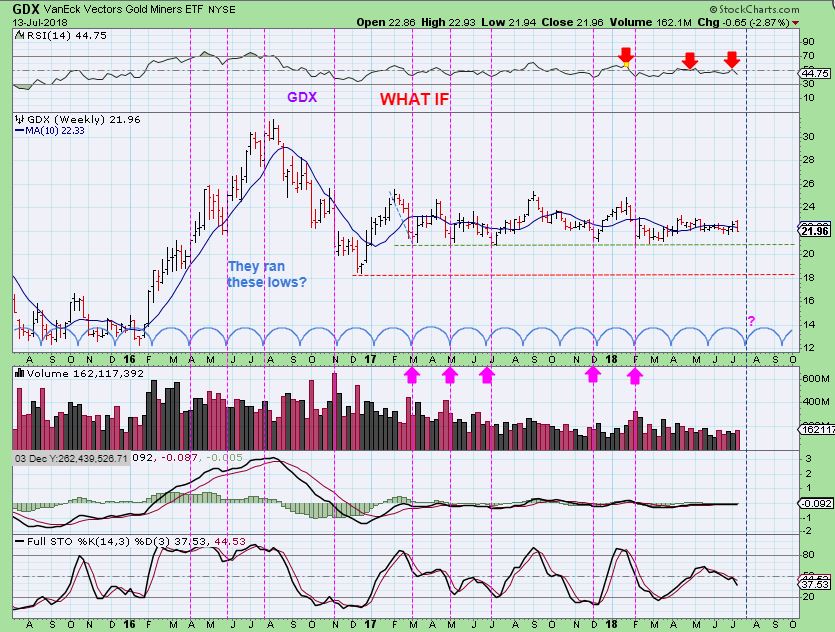
GDX – Different use of Cycles, because GDX has been acting differently than GOLDS cycles. GDX has more of an orderly Choppy up and down action, and really does look like a dip is due. Notice that in 2017 it bounced every 2 months off of those lows (Magenta lines & Arrows, & blue cycles ). Using the blue cycles at the bottom, GDX would be due for a quick dip and the RSI just curled down at the 50% line. We shall have to continue to wait and see. It went sideways and ignored the dip over the past 4 months.
This was a long Monday night report after a long weekend report, because I am trying to give you all of the info you need to understand the possibilities in Precious Metals. My Thursday & Friday Morning reports this week will be shorter, since I will be busier on those days. I am also trying to give you a few trade alternatives, since I feel that some may be tired of waiting. You can trade other areas while you wait , if that suits your style. This has already been a complex ICL process, and I personally can’t wait for it to end too! 🙂
Enjoy your Tuesday trading!
~ALEX
STAY FROSTY
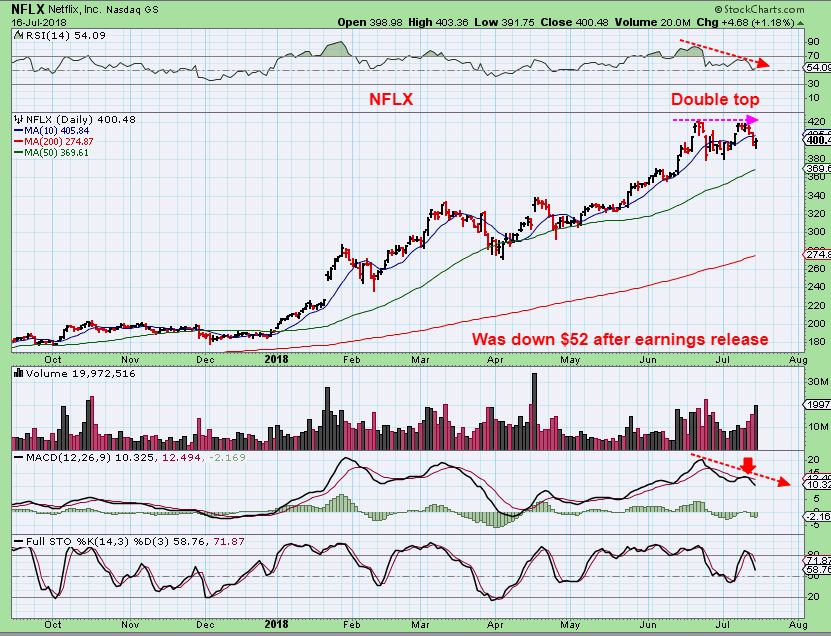
I SAW NFLX TRADE AT $340 IN AFTER HRS
Just a side note: NFLX was down 15% in after hrs after earnings release, trading below that green 50sma. I have been calling for a dip in the General Markets and said that I would be alert to that after some time goes by ( I used 15 days after the dcl as an example). This was a double top and was a warning ahead of earnings (insider selling?).
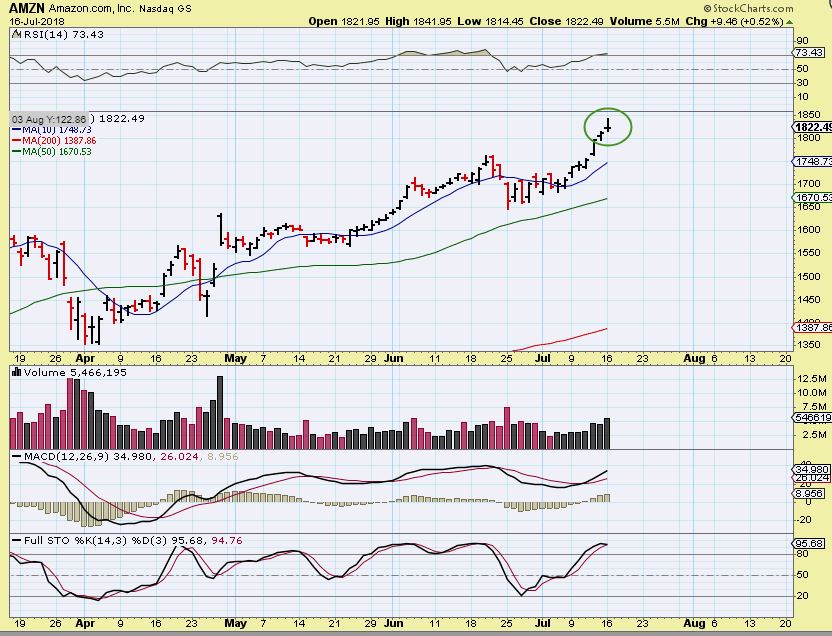
AMZN – This looks like a topping candle, and AMZN was down $20 in after hrs. Down $20 for a stock of this price is not a big deal, but again, and this is a good set up , unlike NFLX. It is extened though.
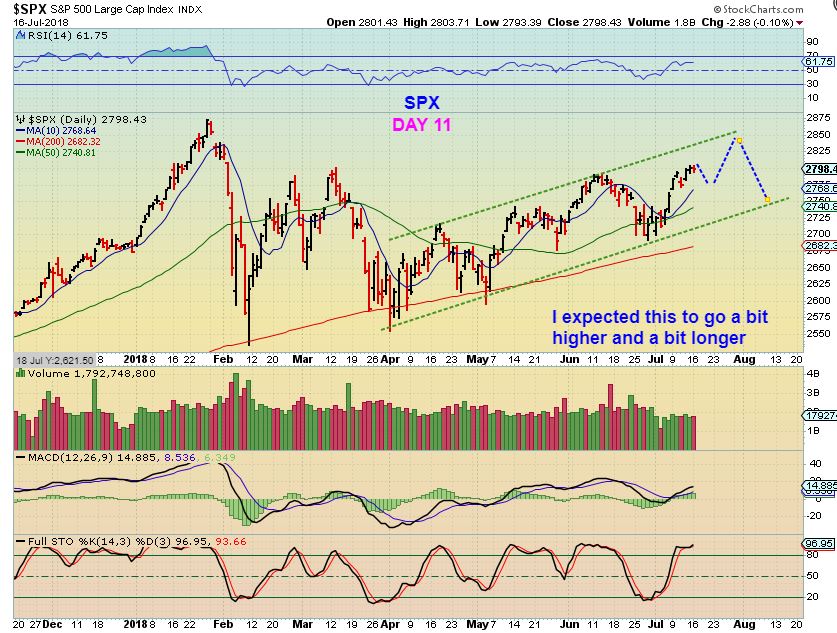
SPX – Day 11 and I did expect this to go to the upper trend line, so maybe financials help push this a bit higher before that dip into a dcl? We’ll see, but after NFLX earnings & that drop, I would remain alert, it is day 12 today. STAY FROSTY!