July 18th – Pops & Drops
Tuesday was definitely a story of Pops and Drops. I have SO MUCH to talk about, so let’s take a look…
SPX – From yesterday, we are early in the daily cycle, so I had drawn this chart up, with a run to the top of the trend line likely, before a dip into a dcl starts…
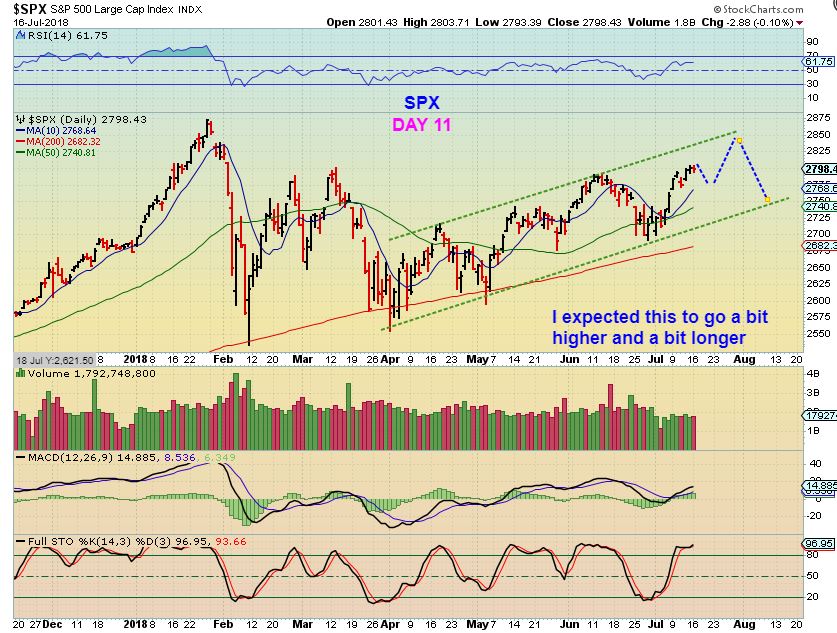
however, I also saw something else that looks important on Tuesday…
GOOD NEWS:
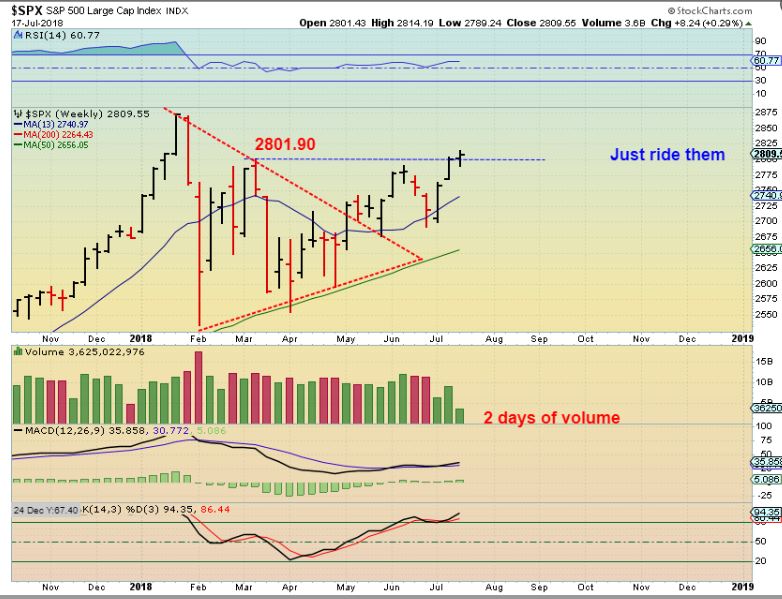
SPX WKLY– I jumped to the weekly chart, and we have now moved above the March highs. You may recall that I was concerned that this could not break this point, and the reason that concerned me was that because this would become a left Translated intermediate cycle. Now it is going to peak later in the cycle out of Feb lows. This should now make it right translated, and that is bullish.
So when we had our dcl recently, I mentioned with the General Markets that this could become L.T. Daily, and that would be concerning by day 15. I said that with a dcl, the way to play it is to go long, ride it, and watch it as it unfolds. Somewhere around day 15 I would look at it to see if looks weak ( drop to L.T.) or still looking healthy? At this point, it looks healthy on day 12 and should continue higher, I have been watching this upper trend line. This is only Day 12, so I would just continue the ride with a rising stop (loose, maybe under the 20sma or rising 50sma).
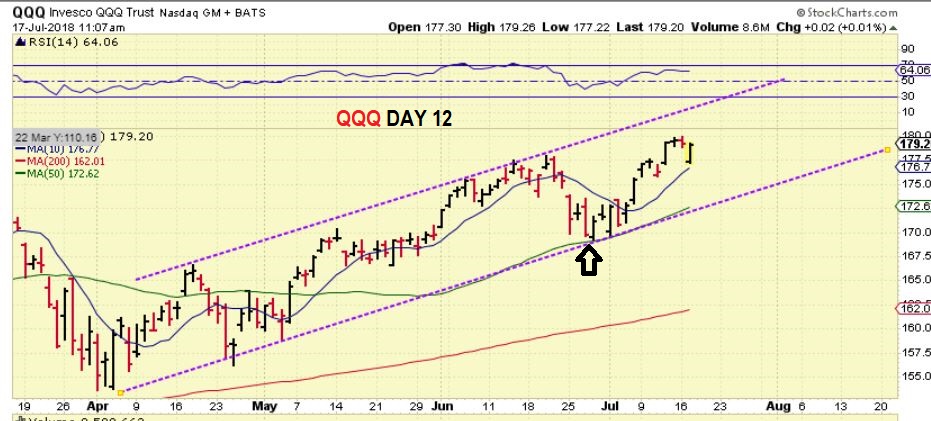
QQQ – I grabbed this chart as it reversed off of the 10sma area Tuesday morning. They continue to act correctly, heading to the upper trend line.
CONCLUSION: GENERAL MARKETS DID WHAT THEY NEEDED TO DO TO MAINTAIN A BULLISH OUTLOOK
.
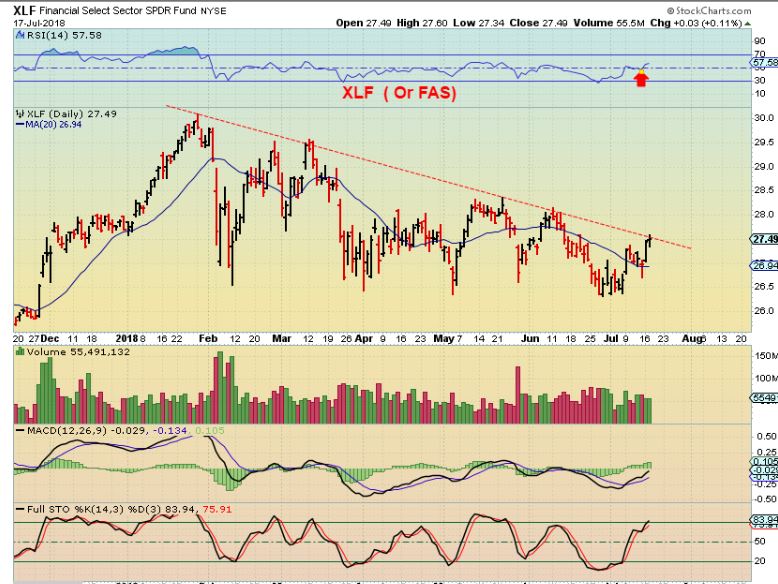
XLF – Paused, no break out yet. Buy before the break out, or buy the break out. In the past, Good financials usually rise with the SPX too.
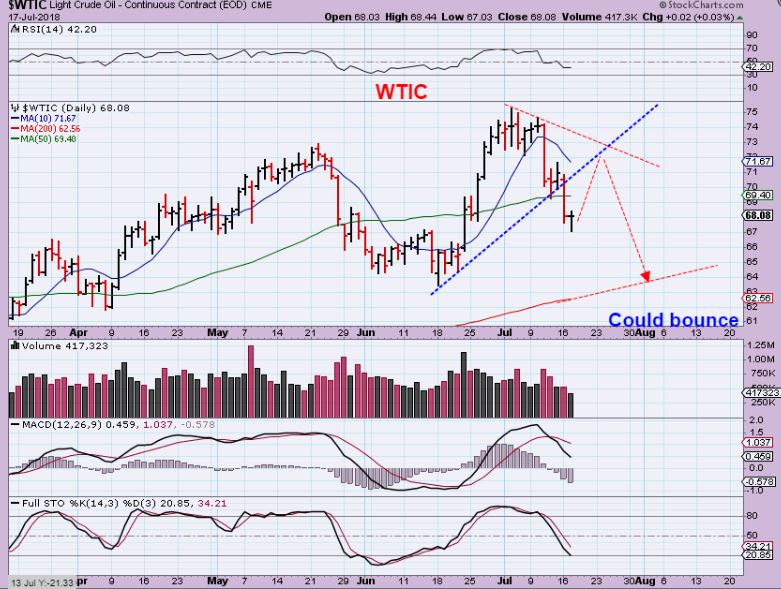
WTIC – Wednesday is Oil inventory day. Last Wednesday, OIL Crashed, so will that continue? It actually looks like we could see a bounce in Oil, but this is a bearish set up longer term, the way I see it. I might short OIL if it bounces like this.
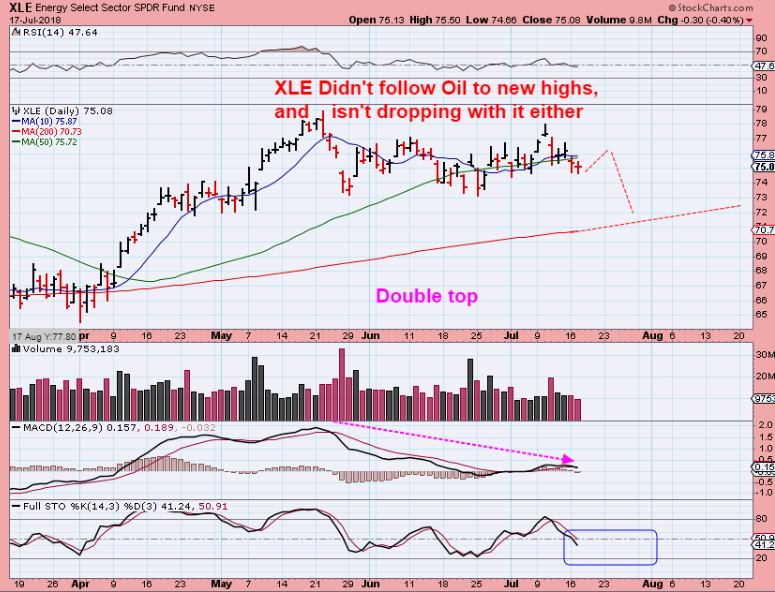
XLF – The Energy Sector ignores Oil lately, both up to new highs and the recent drop. I feel that it will drop over time, maybe to the 200sma.
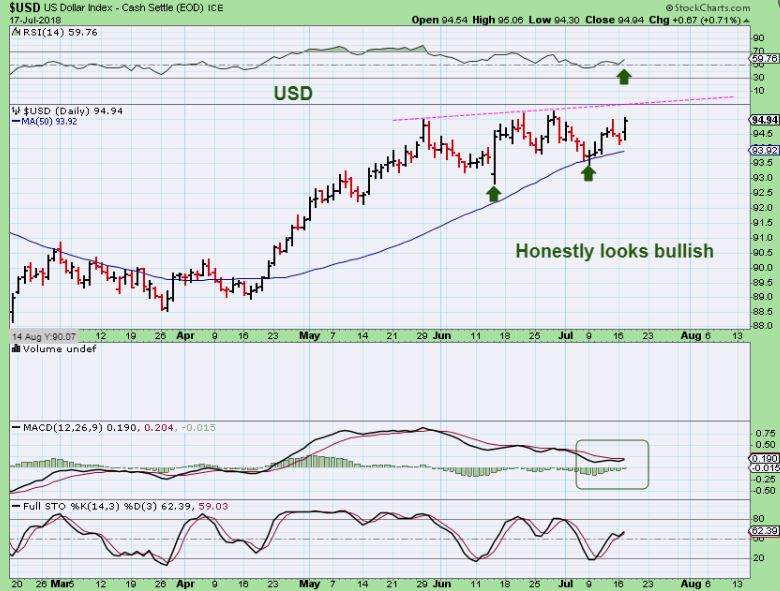
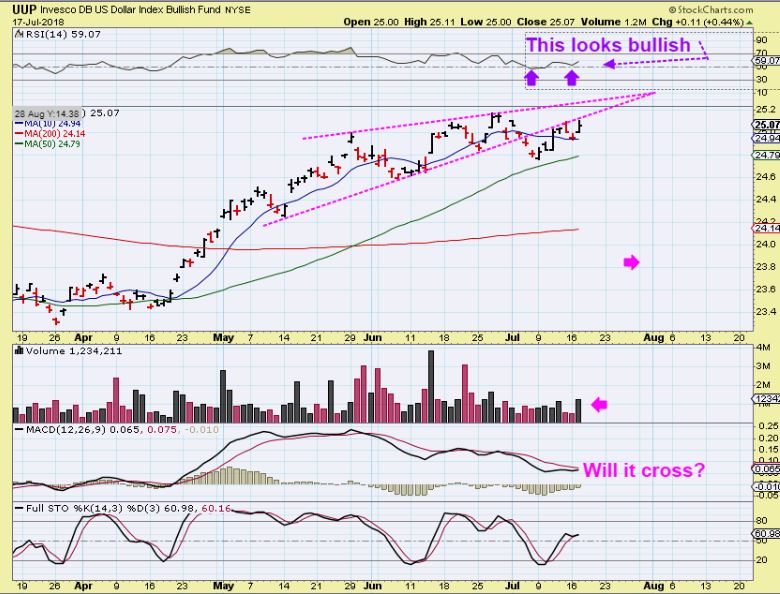
USD – To be honest, the short term looks bullish as it held the 50sma.
UUP- The RSI looks bullish, but I’m seeing a break down & back test on price.
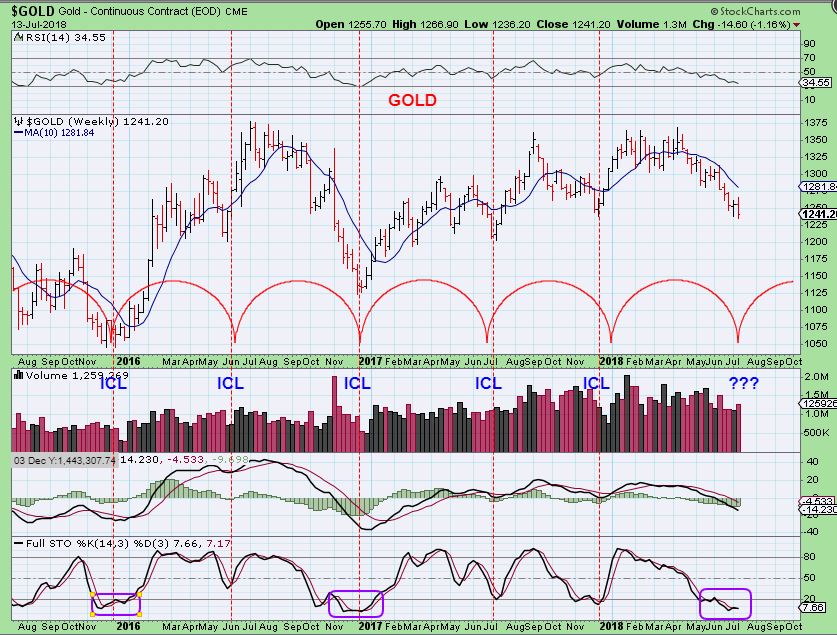
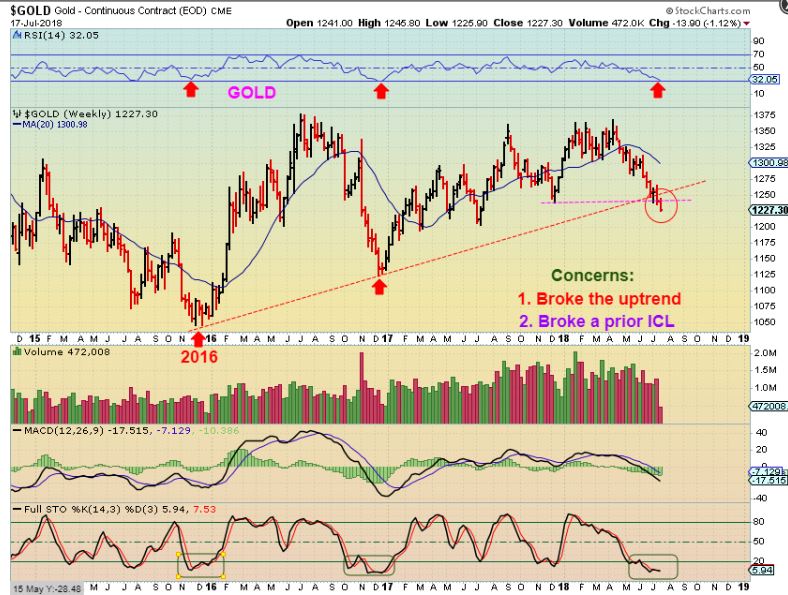
GOLD – On the weekend, I used this Cycle chart to show that we are due for an ICL.
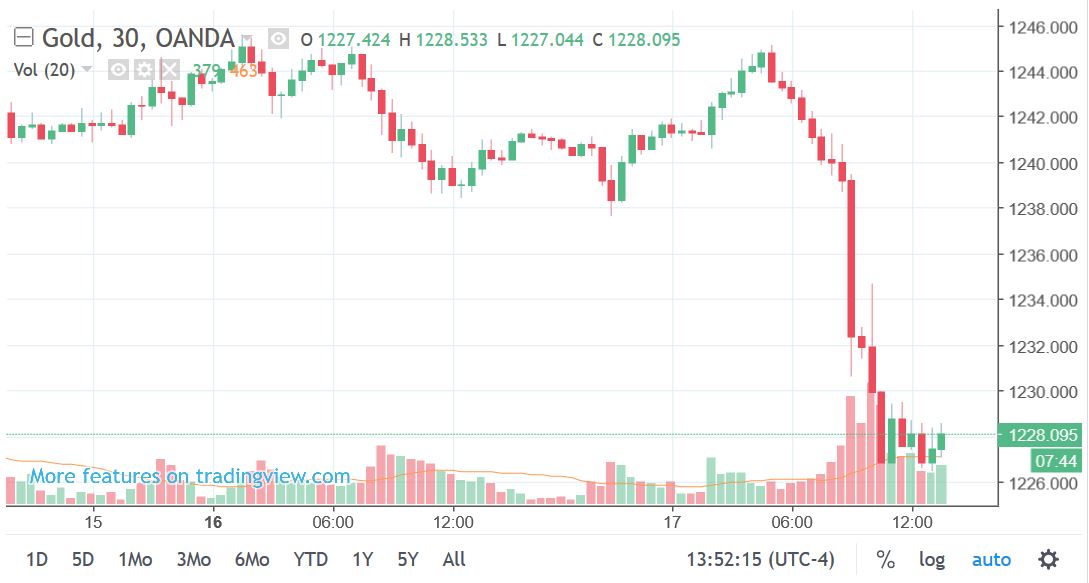
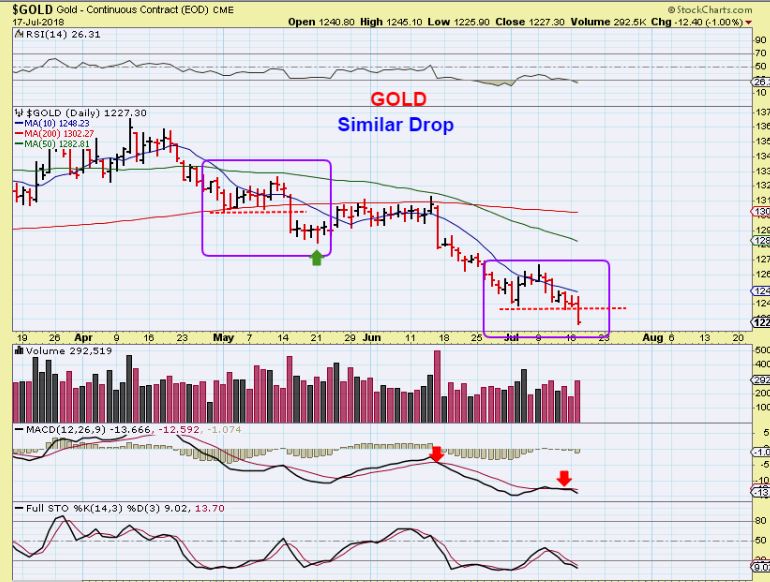
GOLD – So this is the waterfall that we experienced on Tuesday.
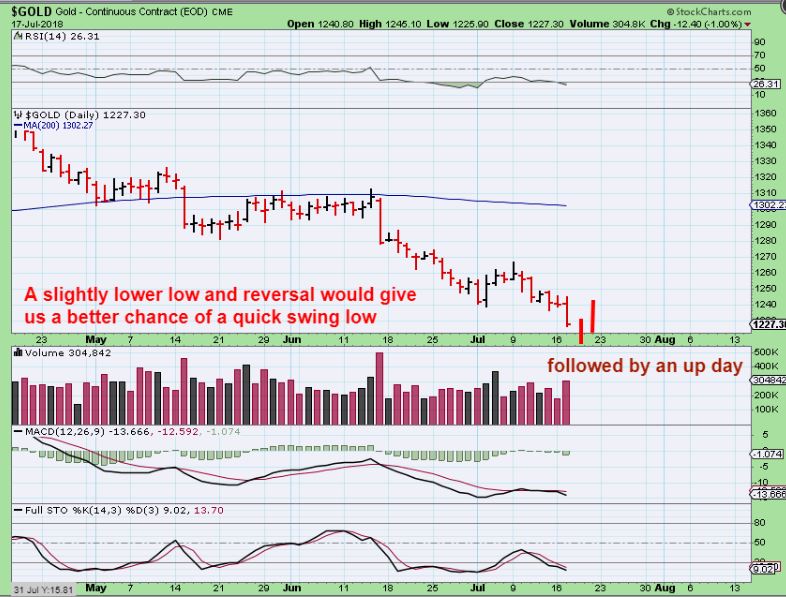
GOLD – A slight undercut would give us smaller parameters for a swing low in the near future, as shown. EDIT: Pre-Market, we have a lower low.
GOLD – That drop on Tuesday looks similar to the Big One Day Drop in May & one in June. The one in May did lead to a dcl ( green arrow) after it stabilized. June sold off. It also looks like the drop in June, so…
GOLD – Could that be a DCL on day 30, and continue like the June drop? Or will this end like the MAY DROP? Only time will tell.
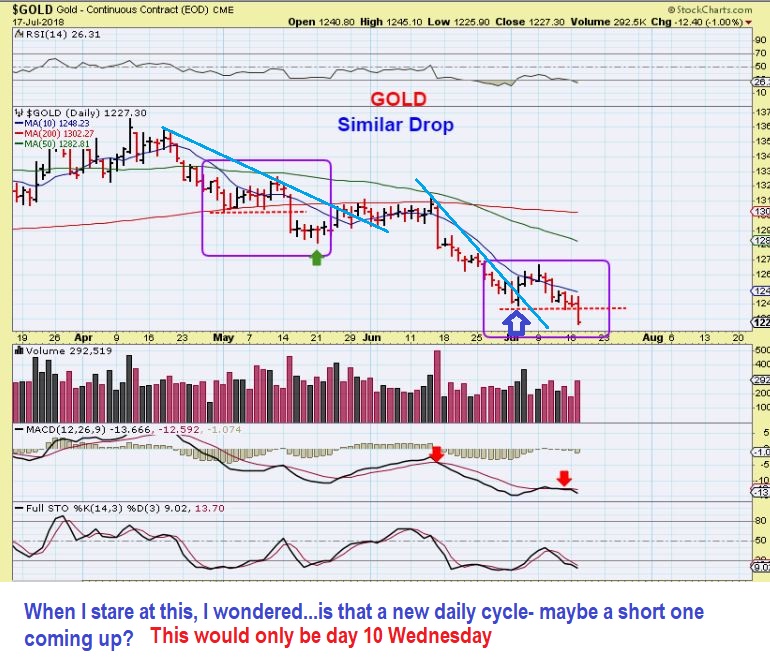
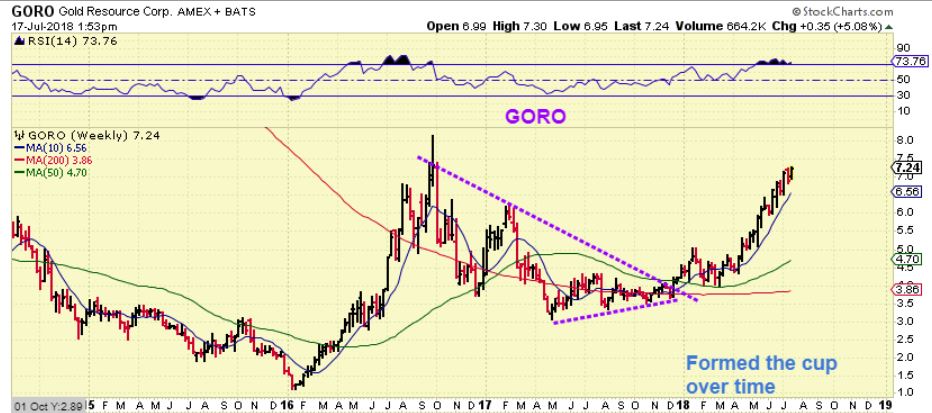
GOLD — I see a wedge forming in Gold. I’d like to see a break out of this wedge upside. That would be bullish. Daily Cycles Lows are really a bit difficult to label here on the drop. Is this daily cycle 4 or starting a short #5? I have 3 daily s in Boxes, then a 4th long one followed?

GOLD- MY LONG TERM CONCERN AS MENTIONED: The Bull Run of higher lows has ended. It may be a shake out to turn people bearish, we’ll examine it after the ICL. The drop now should run stops, but how low will it go? At least Miners are not dropping in the same manner…
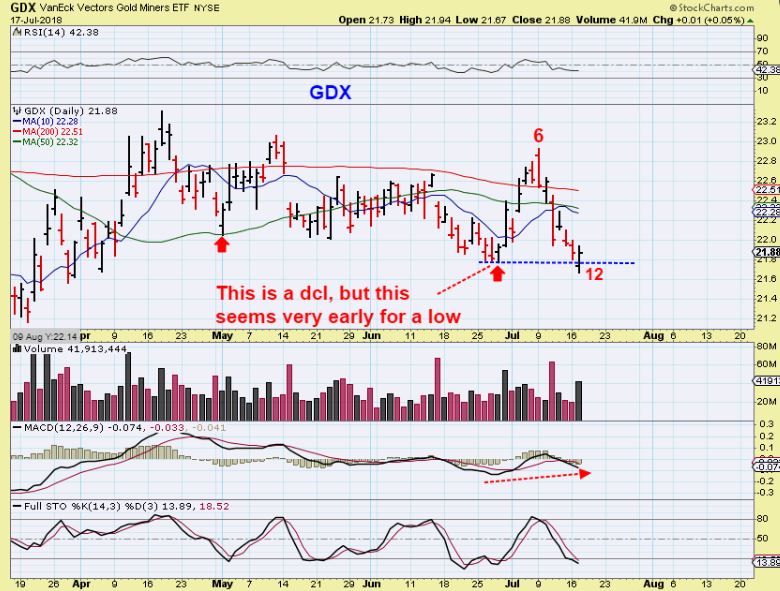
GDX – Miners pretty much held up again, this looks like day 12. GDX & GDXJ dropped, but several Miners turned green shortly into the selling. This DOES look like a dcl failure in GDX, but we could get a short daily cycle if Gold bottoms.
GDXJ – GDXJ could do a false break down, but at this point, and then recover. It has actually done a false break out higher so far.

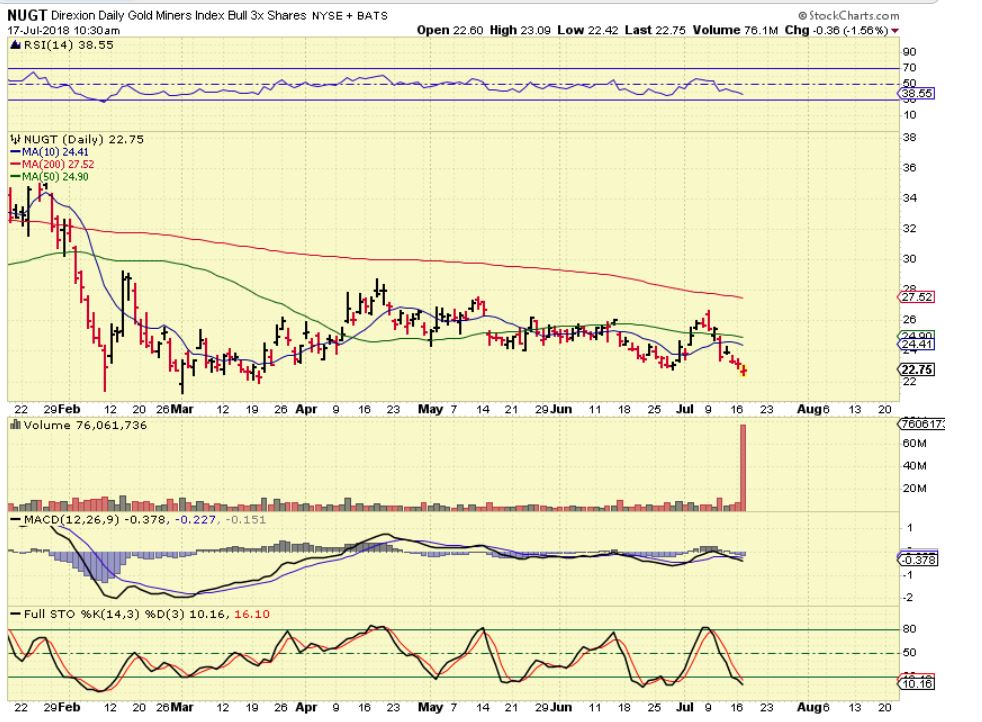
NUGT – 1 hr into trading, NUT had a huge volume spike. It shows up on various platforms and time frames, so was this a LARGE BET on bullish upside? Very hard to tell. It is just too large of a number for that minuscule price move, but everyone is talking about it.
.
What else can I say about this situation: GOLD LOOKS BEARISH, BUT MINERS STILL LOOK BULLISH – Let’s take a look…
.
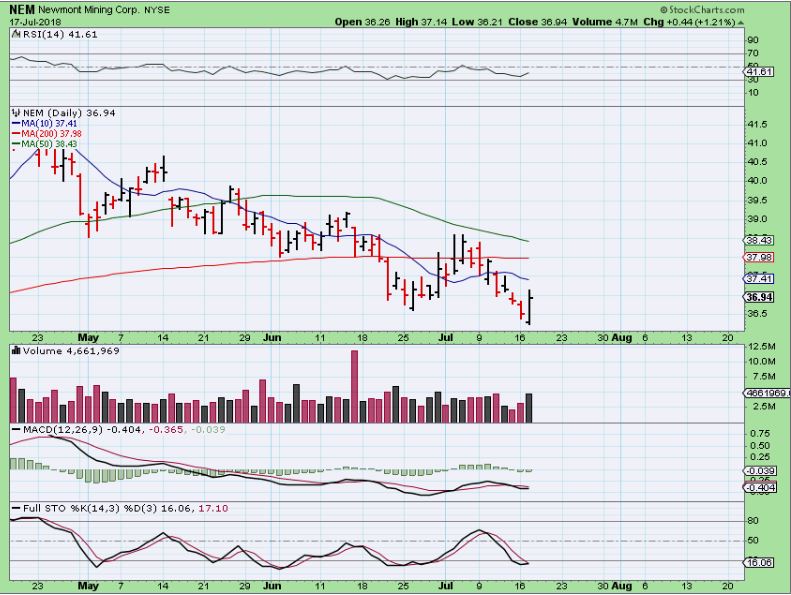
NEM – This was quite Bullish with GOLD Down $13 at new lows. It is normally called a Bullish engulfing & is a reversal. Will it have follow through? I want to see what it does on Wednesday.
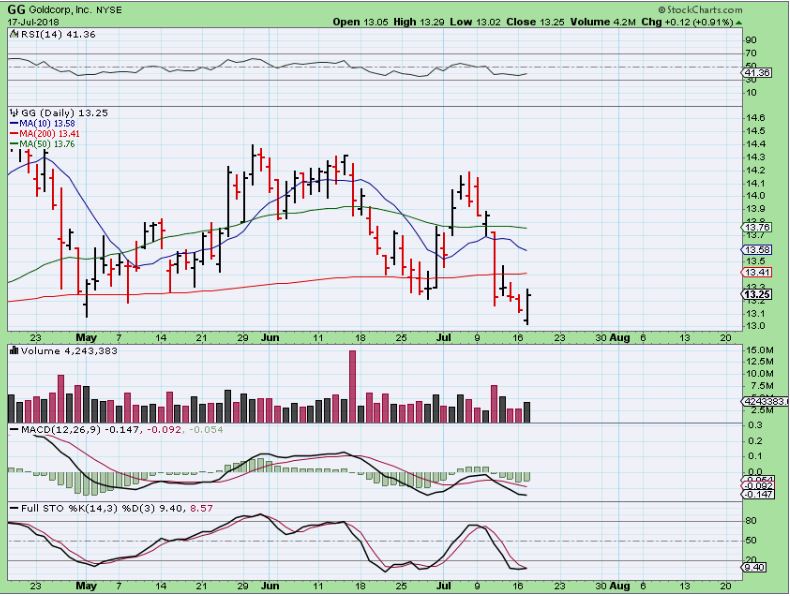
GG – The same with GG. Will it have follow through Wednesday? It is Bullish at this point with Gold plunging for weeks.
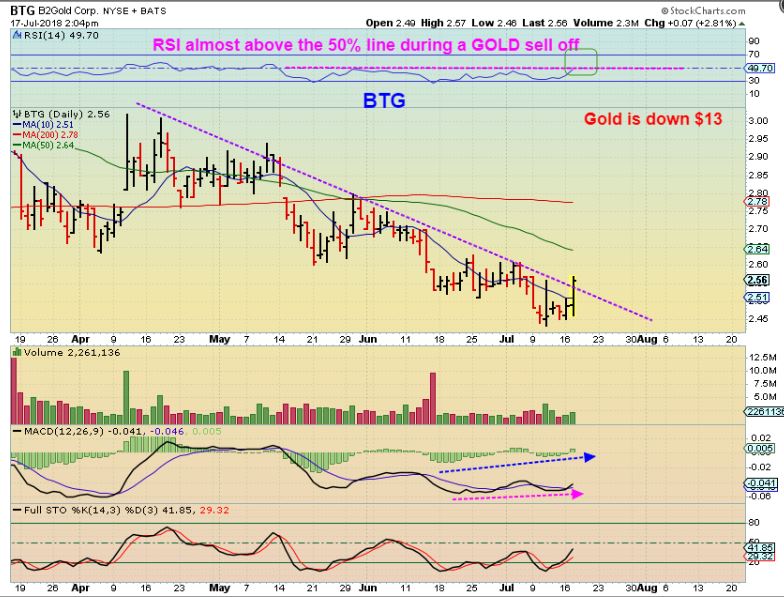
BTG – Gold is down at new lows , breaking Dec 2017 lows, and several Gold stocks were higher? Does it make sense?
Of course GORO & KL hit new 2018 Highs, as gold breaks Dec 2017 Lows. Does it make sense?
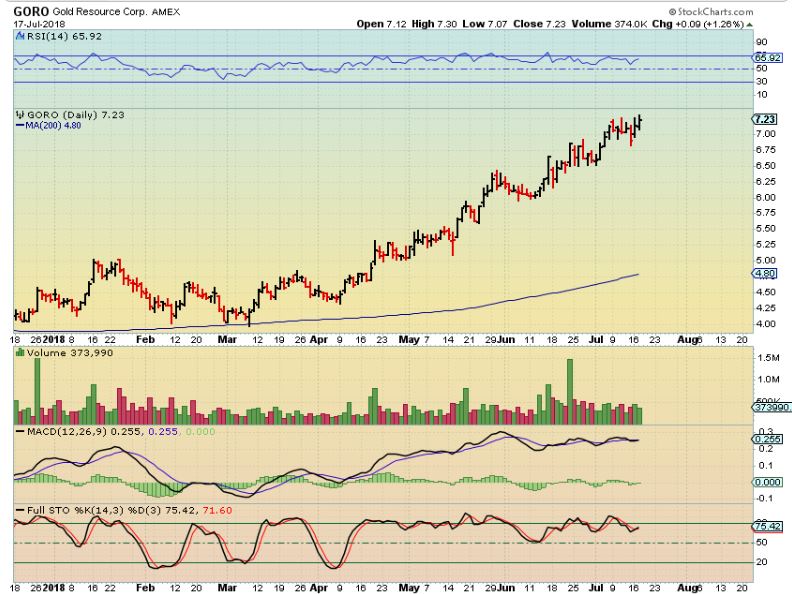
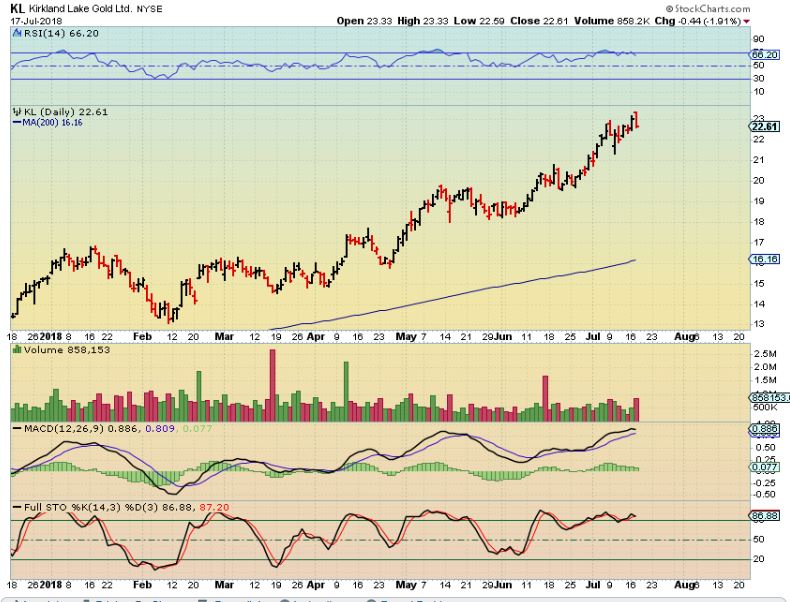
** My readers have obviously signed up here to get my analysis and add it to their own, right? When I analyze this, I have to say that I cannot remember ever seeing Gold sell off for weeks & weeks & weeks, breaking all prior lows, and yet having Gold Stocks holding up like this- some at new yearly highs! It just seems very bullish for the big picture despite Gold breaking prior ICLs. Buyers are buying KL & GORO & other miners, as GOLD breaks down. It is not Normal Precious Metals Market behaivor.
GORO – The bigger pic helps you to see what to look for. Look for break outs from the wedge consolidation
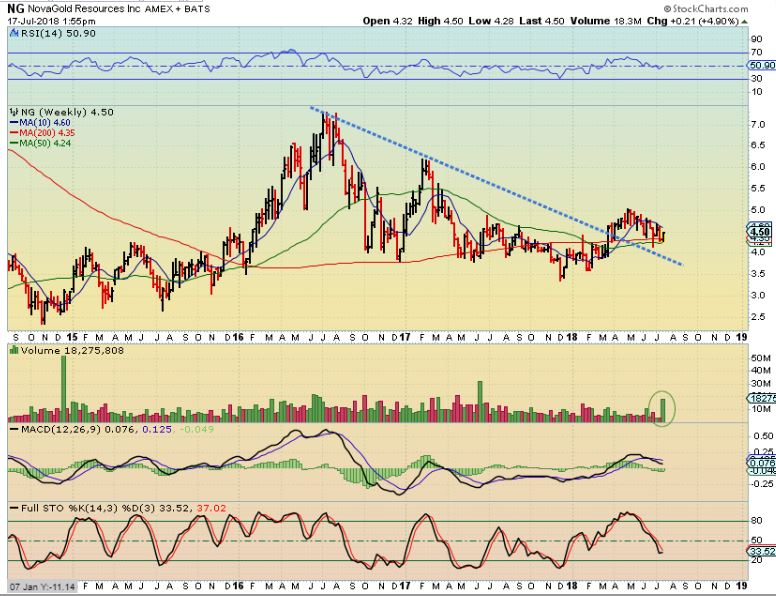
NG– Here is one now, sitting on the 200sma & closed 5% higher on a day when GOLD was, well, you know, crashing.
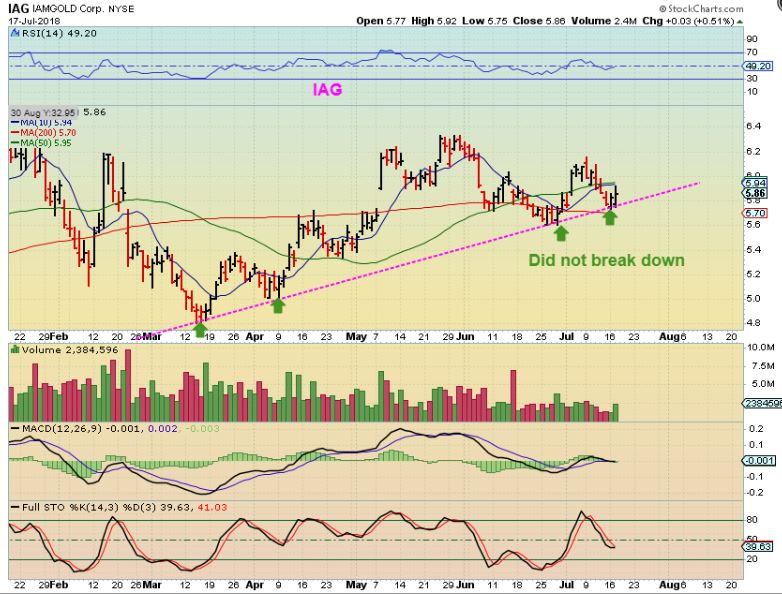
IAG – Bullish or Bearish? Does this make sense with Gold plunging for weeks?
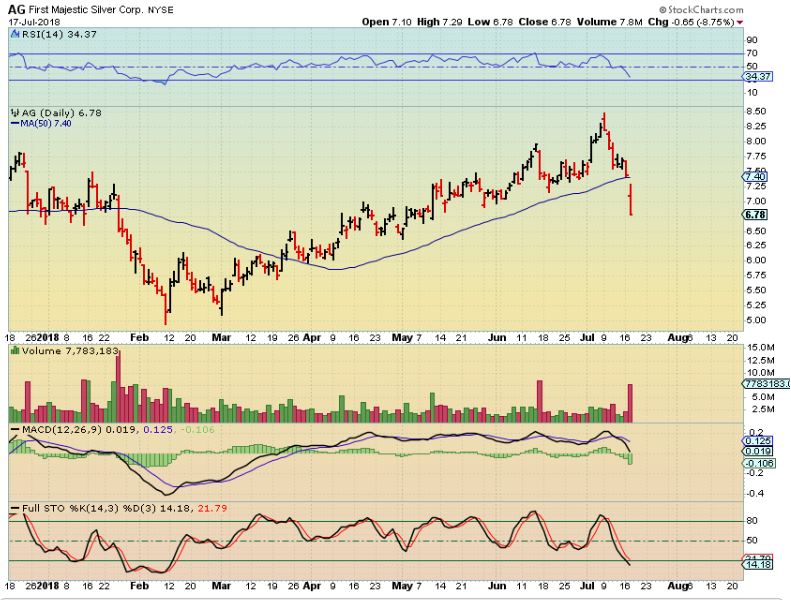
LET’s TALK ABOUT AG
AG #1- Most people will see this chart of AG as a complete failure after the earnings release. It is a bad looking chart at this point, slicing through the 50sma like a hot knife through buttah ( Butter), however…
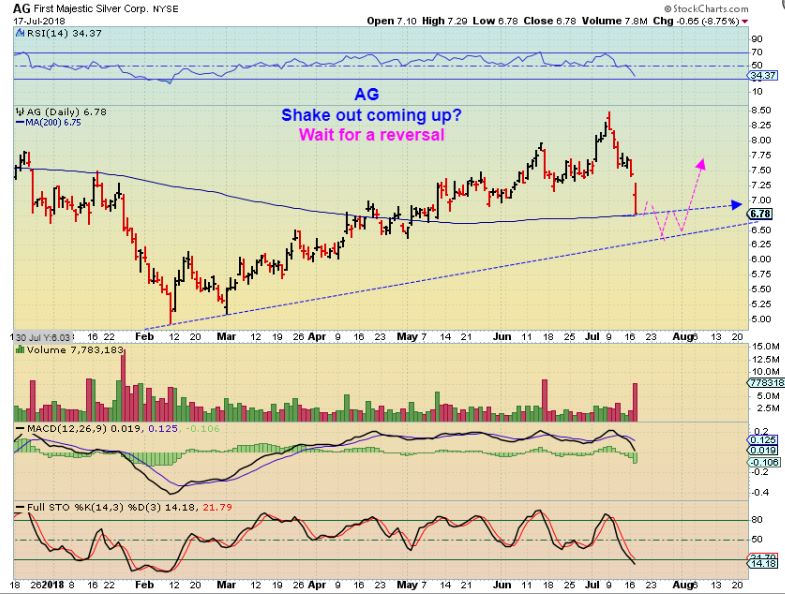
AG #2– It dropped right to the 200sma, and I actually was looking at that possibility. I would look for a possible break down & ‘shake out’ below the 200sma, but I WOULD NOT BUY until we see the reversal. This may be a good buy opportunity in the long run, but it might also need time to consolidate.
What can I say that hasn’t been said already?
1. Many Miners are ignoring GOLDs sell off completely.
2. We do NOT have a swing low in Gold or GDX / GDXJ yet.
3. We now have Gold breaking the prior DEC 2017 Lows, yet several individual Miners are still bullish set ups.
4. KL & GORO mentioned here are at 2018 highs!
5. It really does not make sense, but you can only go by what you see and try to figure out what is happening.
It seems that several Miners are being accumulated as GOLD crashes and scares people to death. We are still waiting for an ICL and a swing low in GOLD & MINERS. Cycle ‘timing’ seems to be familiar, but price action is different between Gold, Silver, and Miners. The ICL is due and Time is running long. Time will tell – STAY FROSTY!
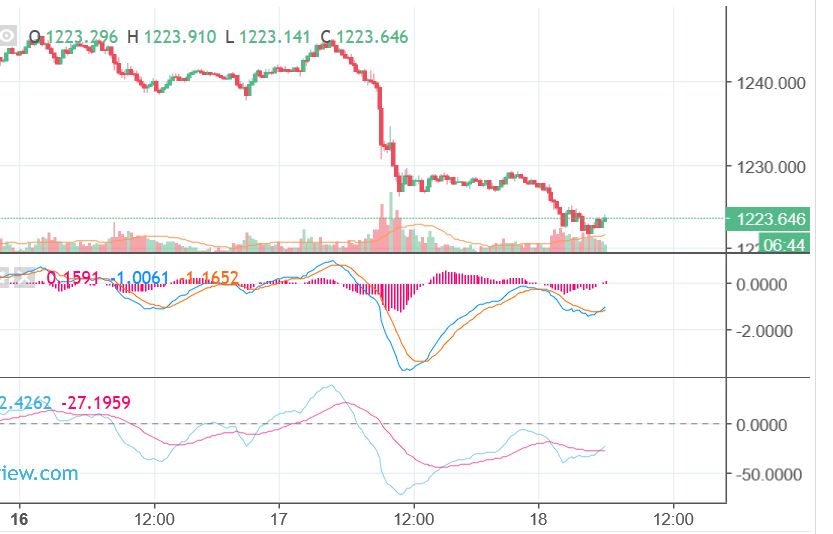
NOTE: THIS MORNING, THERE IS PRETTY STRONG DIVERGENCE IN THE OVERNIGHT GOLD DROP ON THAT MACD. THIS IS A 15 MINUTE CHART, IT SHOWS UP ON ALL TIME FRAMES 60 MINUTES & UNDER
~ALEX
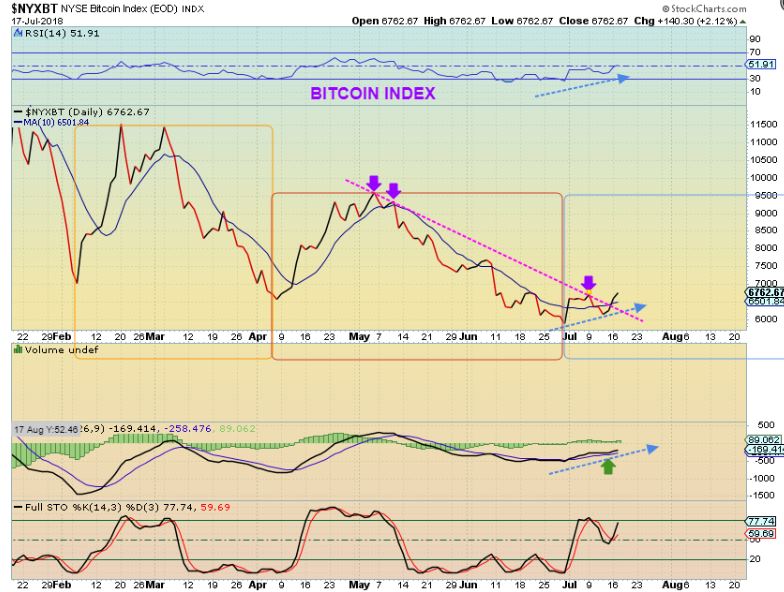
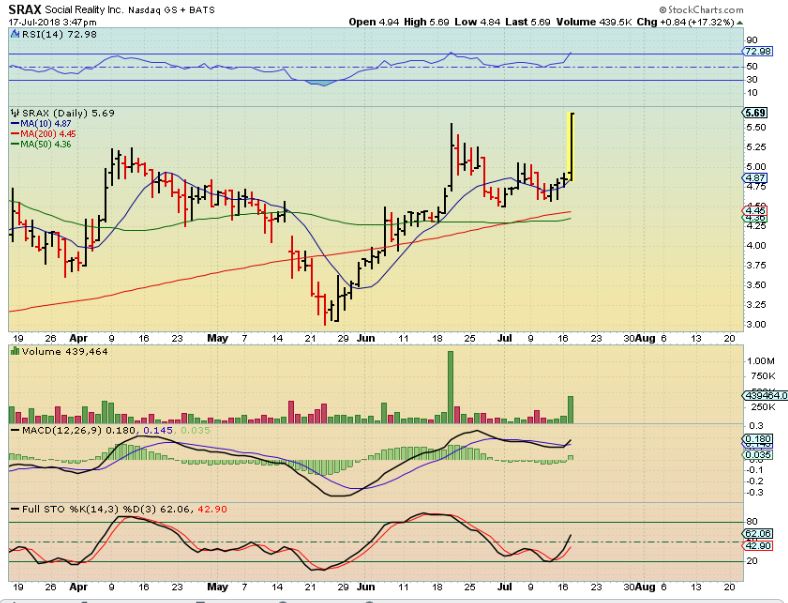
BITCOIN – I mentioned a BITCOIN Bullish set up and Blockchain trades ( SRAX, MARA, DPW, MGTI, etc etc ) often POP & RUN with a bitcoin move higher. This was a BITCOIN break out yesterday, did those trades POP too?
FROM YESTERDAYS REPORT –
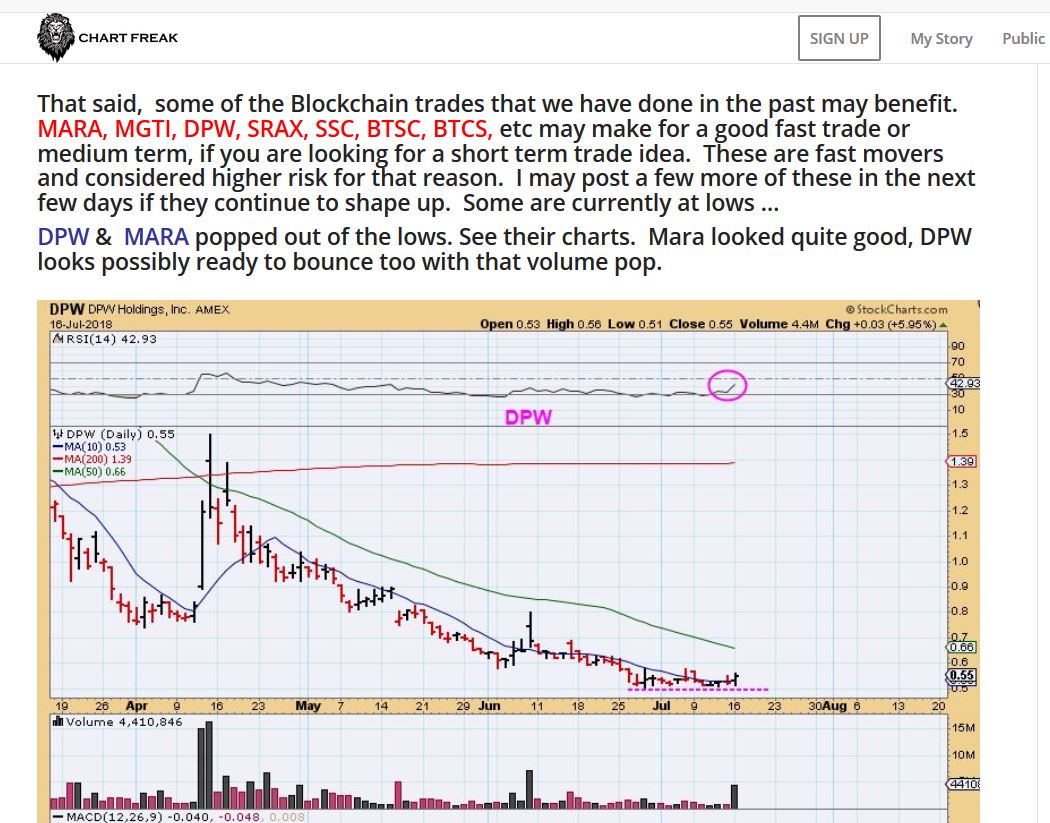
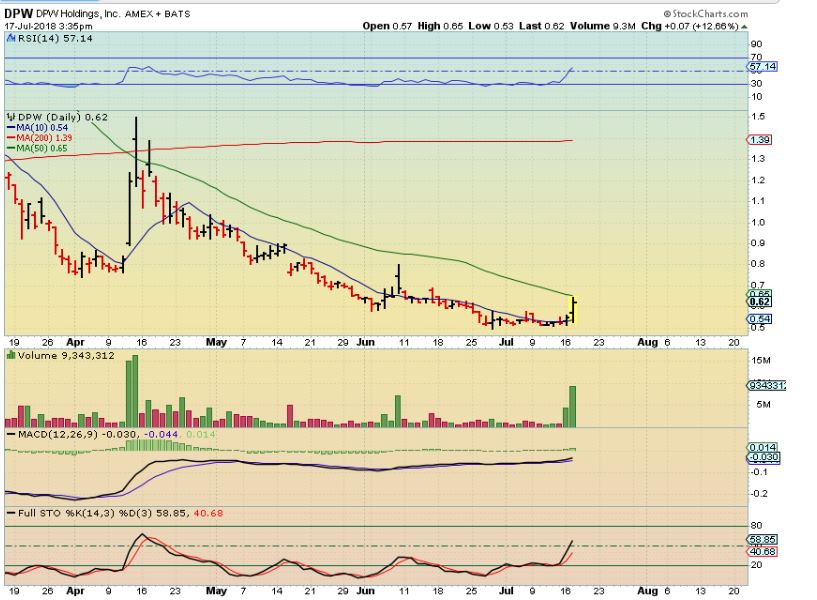
DPW – And the POP. It actually closed up 17%.
SRAX – I posted this as a buy and bought it and DPW…
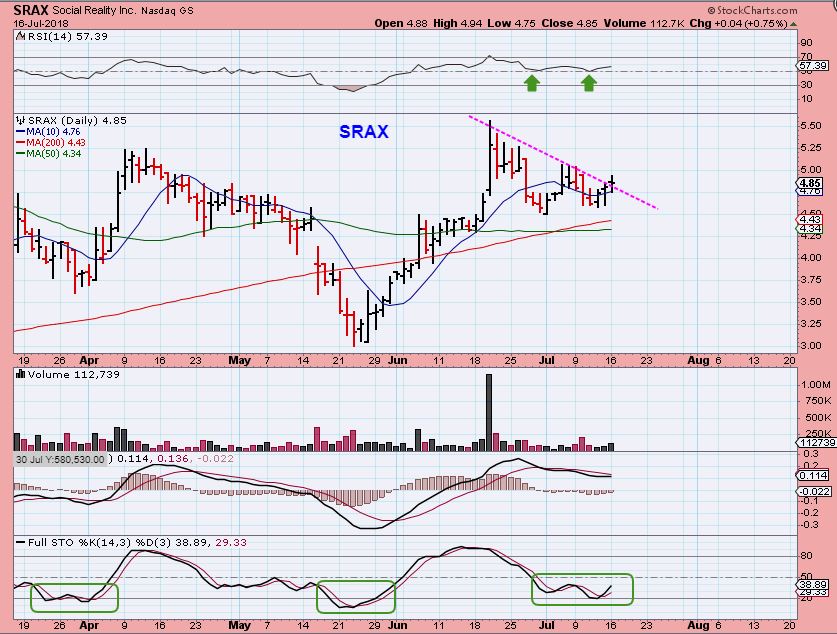
SRAX – It also closed up 17%. These really do move. They do move both directions, so we need to be careful.
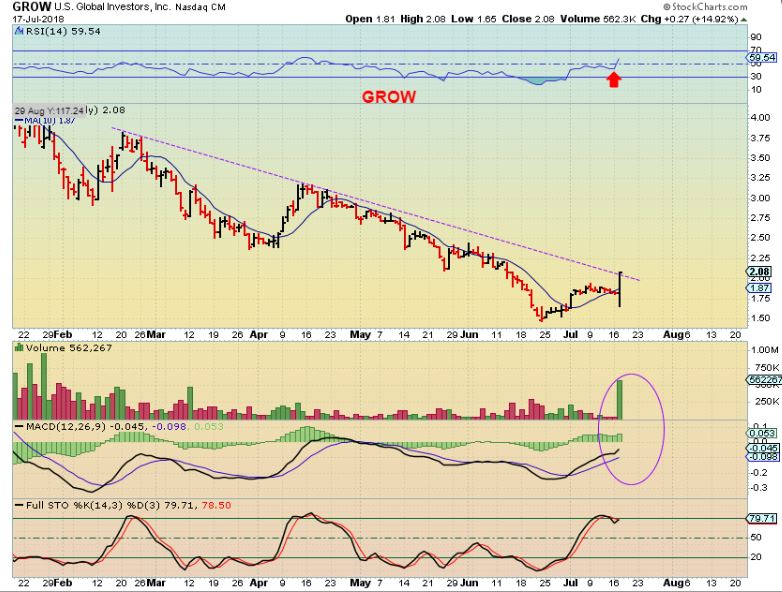
GROW – GROW, MARA, MGTI, NETE, XNET, etc etc all took off, Grow was actually down at the end of the day & then did a final surge higher. so…
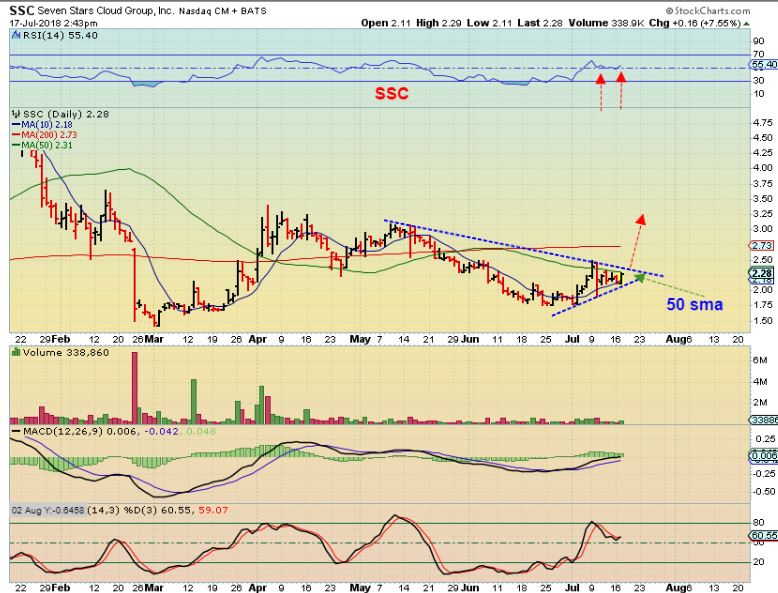
SSC – This one is pinched in this area & did NOT participate. I bought it near the close just in case it is ready to go higher too. I grabbed this chart before the final hour of trading, and it actually dropped back a bit before the close, so if Bitcoin is up premarket, these should continue & this can be bought at a good price (a stop below the blue line is reasonable).
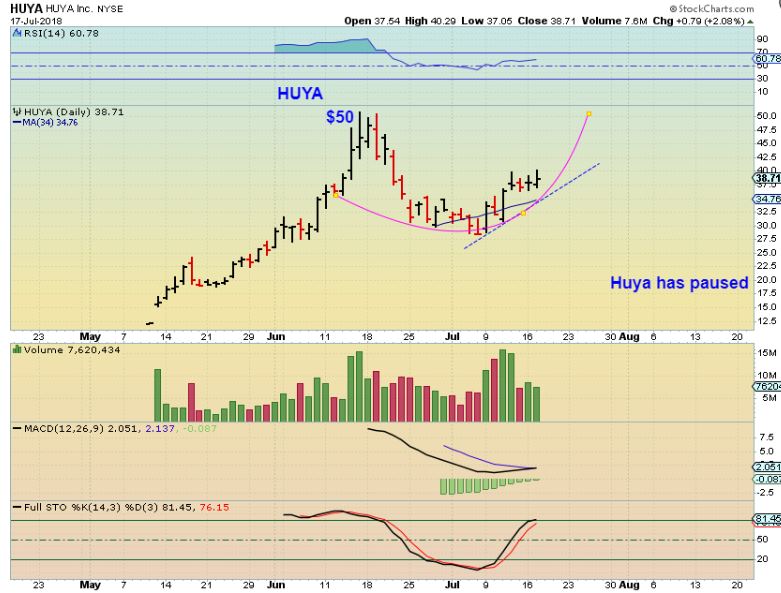
HUYA – Recommended a as buy at the break out July 9
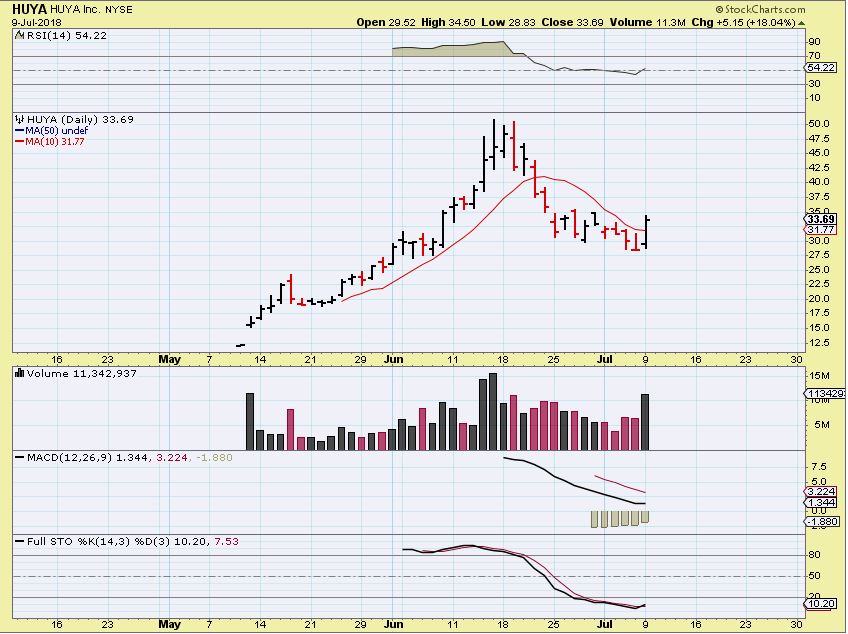
HUYA – It has paused and is waiting for you if you want to risk it.
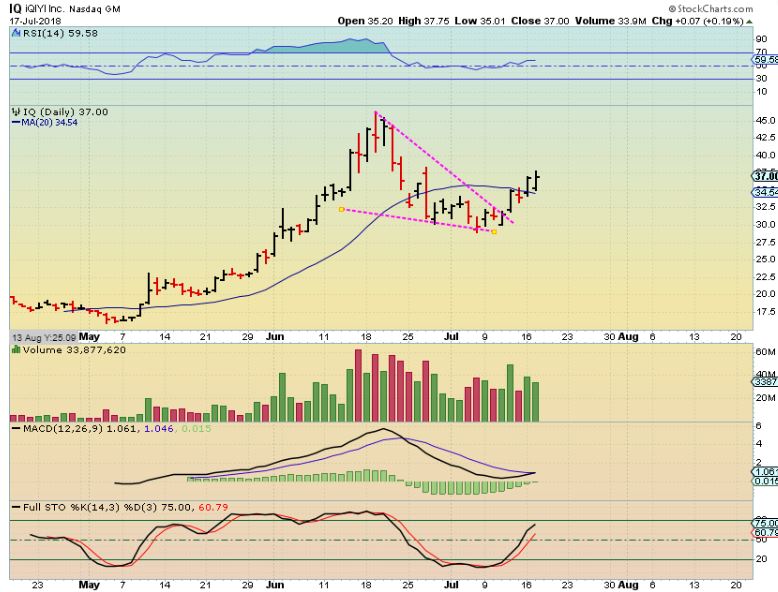
IQ – Also July 9 , Buy before the break ( or after). these COULD run to former highs.
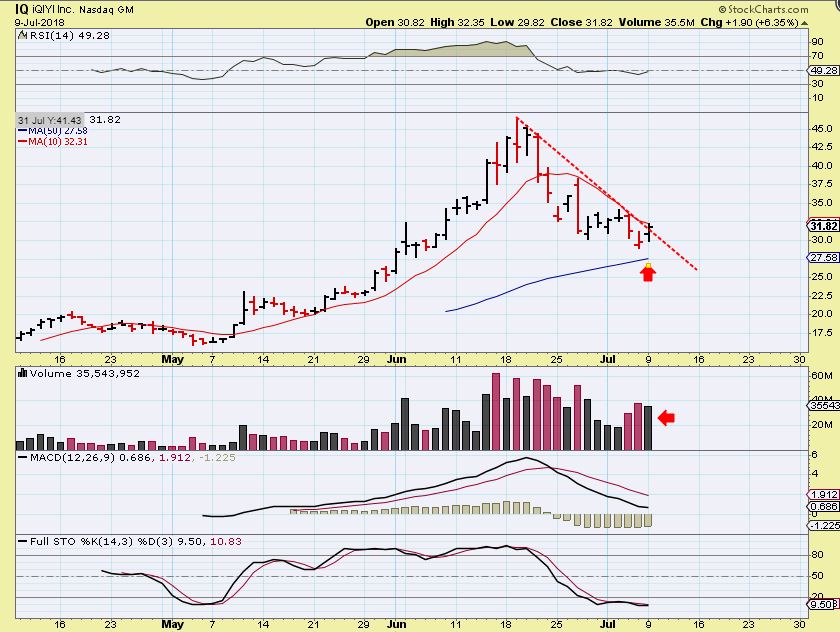
IQ – gradually doing well. These can climb to former highs and form a cup.
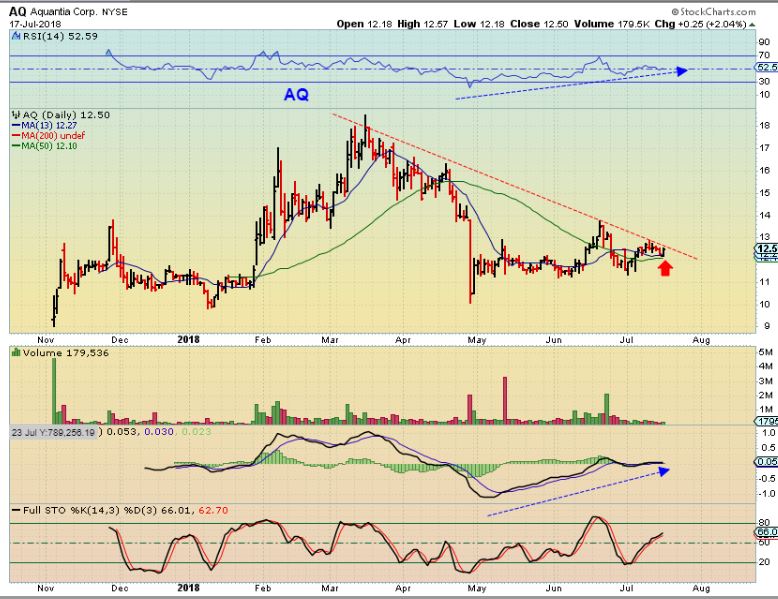
AQ– This one looks almost ready to go higher too. You could buy since it is on the 50sma, or just Keep it on your watch list.
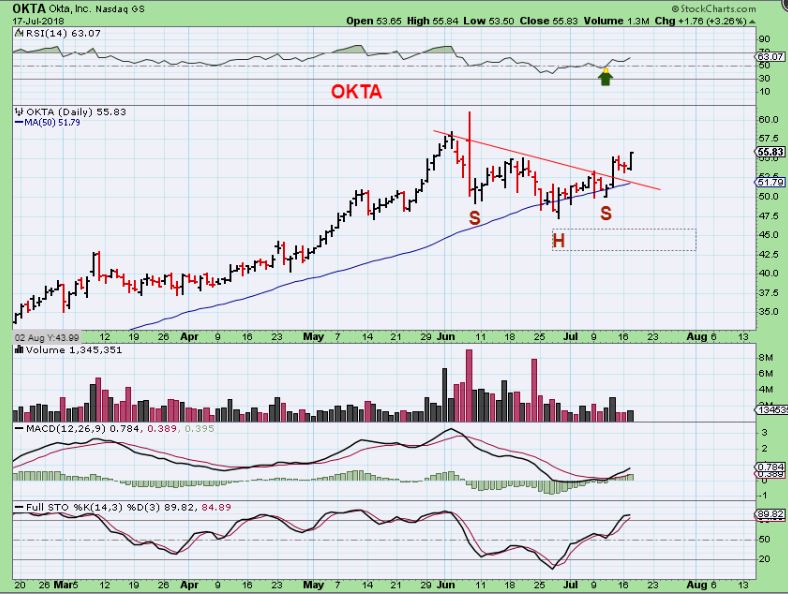
mentioned by Bay Trader in the comments- OKTA , I see an inverse H&S break out, rides the 50sma, breaks out & formed a mini bull flag, now moving higher again. There are SO MANY set ups like this out there. Bullish set ups .
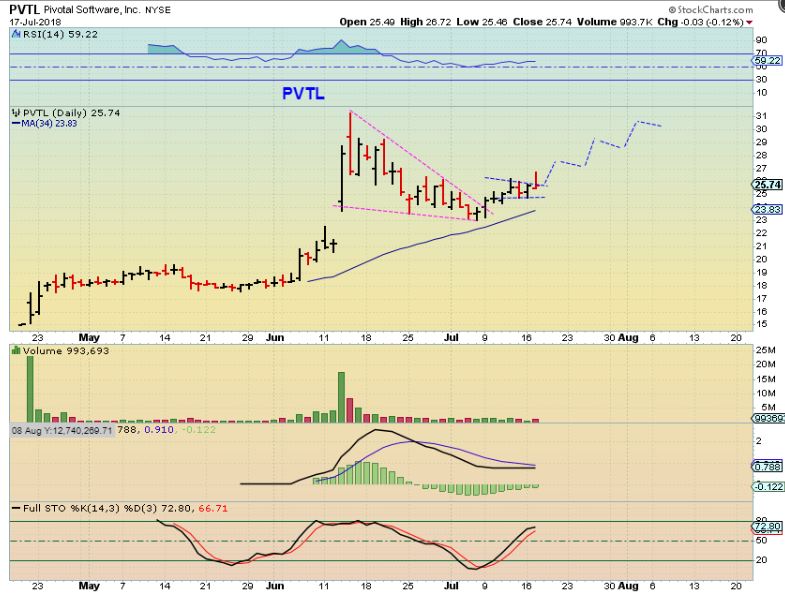
PVTL _ Break out and pause here too. Gradual climb higher ?
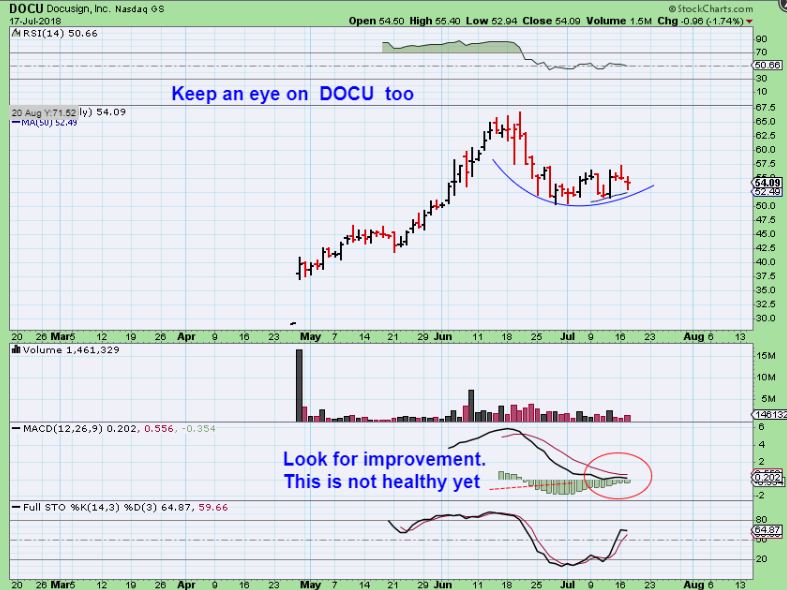
DOCU – This had a strong run from $37 to $67, and pulled back. It seems to be one of those IPOs that now forms a cup? I dont like the MACD on this yet, but the base of the cup can improve that. This is sitting on the 50sma, so could be bought with a tight stop & see how it plays out.