July 14th – Let’s Go, I’m Ready Already!
I’m sure that by now, you are ready too! Well, I have some good news on the ‘Waiting for an ICL in Gold’ part, but first let’s cover all of the markets, including something very interesting that I noticed about The EEM. To The Charts!!
.
I have been mentioning that with the General Markets, I would be ‘long’ out of recent lows, but cautious after maybe 15 days off of the recent lows, because I think we are due for a DCL that could become a bigger pull back ( Icl type drop). THAT DOES NOT MEAN THE END OF THE BULL in the Big Picture. I like to take things step by step here, so let’s look at some charts.
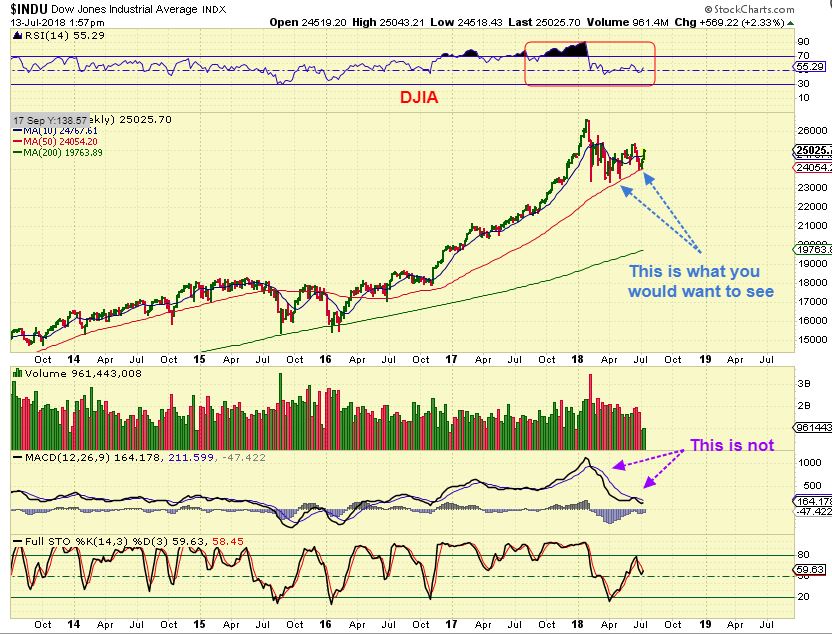
DJIA- I love that DJIA found support right on the weekly 50sma. That is a buy & at a glance looks very good. The analyst in me does see need for caution, though. The MACD is horrible and we cannot say that this is showing a ‘sign of strength‘ in that RSI either right? This has really looked weak, while the TECH and Small Caps have looked better. Let’s continue…
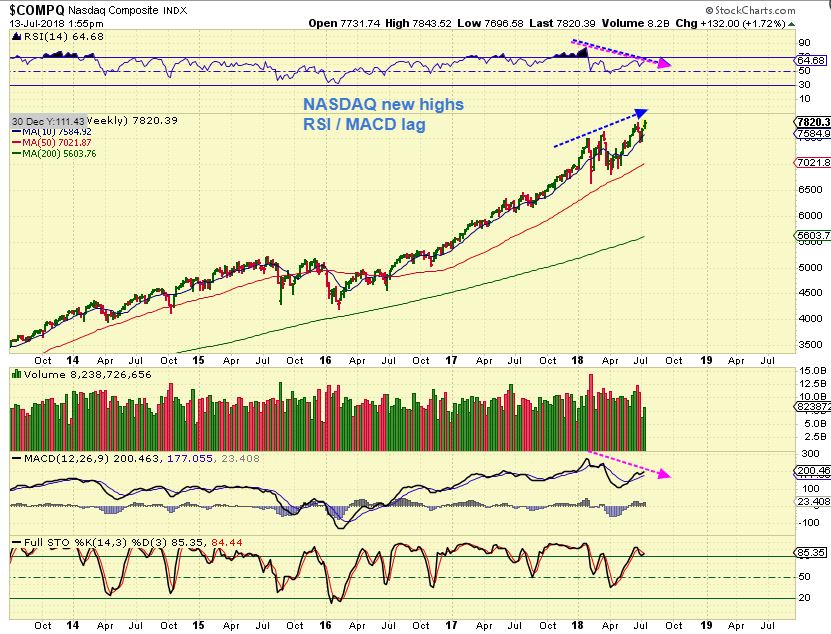
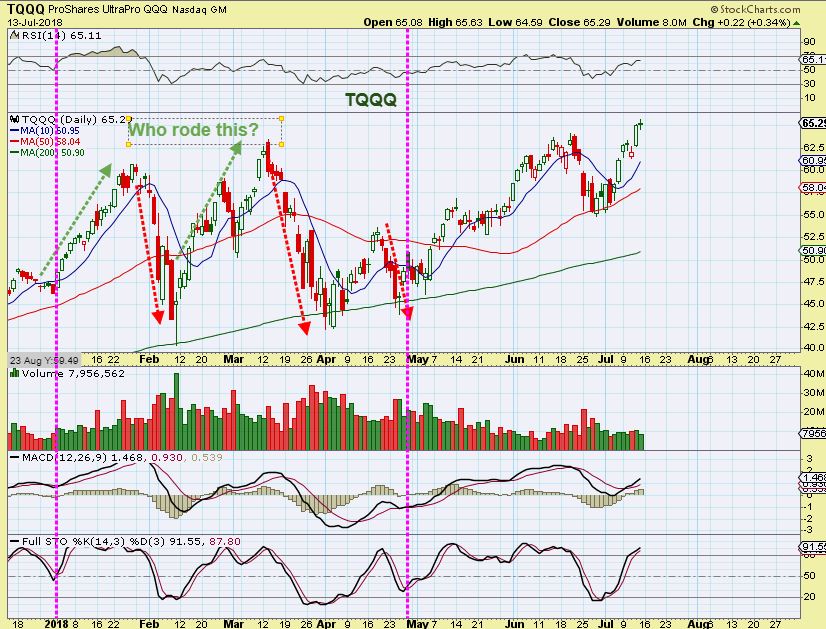
NASDAQ – The Nasdaq hit new highs as expected. Tech stocks are continuing to out perform, but we don’t want to have selective memory. When they come due for a dip, they can & do drop too. Right now plenty of stocks in Tech are definitely acting correctly, some are again hitting new highs, but that doesn’t mean that they can’t or won’t pull back. Last January Markets hit new highs, and crashed down in Feb and again in March February, and so did all of the Good Tech stocks. That said, I say be ‘Long’ , but raise stops and be ready, especially since many ride Leverage TQQQ, UPRO, etc. Take a look at the RSI & MACD as we hit new highs on the weekly. We may need to pause soon.
I had this chart in the comments section. In early 2018 we had WEEKS of some very difficult drops from January-Feb and then again March into April. Aril bottomed & bounced, but also almost gave 100% of that bounce back. This was NOT an easy ride for months as the NASDAQ consolidated and pulled back. This is just a good reminder that all markets, even Bull Markets, have dips & will consolidate at times. Some are big, some are brief. I think we may be due for a bit more of a brief one soon, so “be long, but use a stop unless you can just ride it out”. That is a doji at the highs.
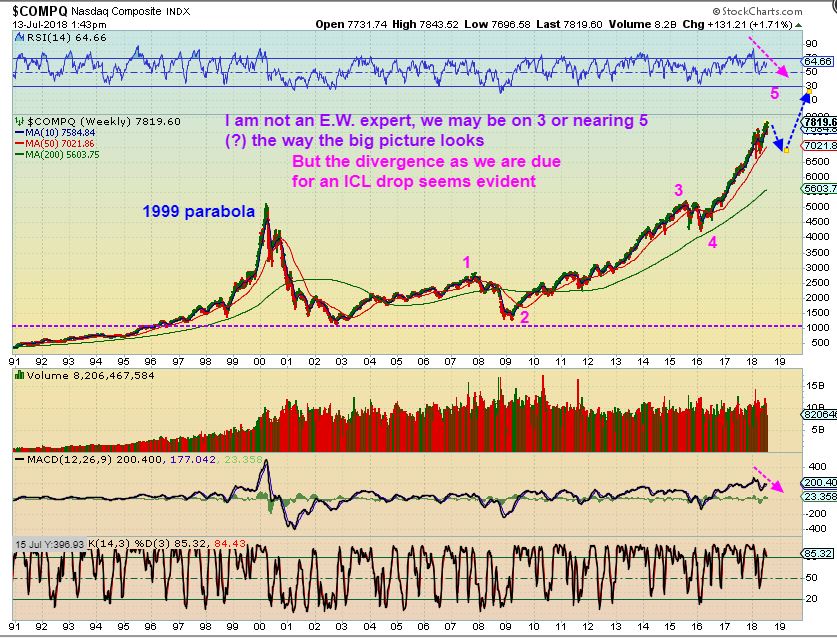
As for the LONG TERM- I have said that I am not an E.W. expert, because I am really not familiar with all of the nuances, but BIG PICTURE, I see this. A parabolic run into 1999 top, then a low in 2002. I admit that this currently could be a continuation of a long wave 3, which means plenty of room to run to a wave 5 top. I have drawn it basically as though we saw 3 and 4, and this is 5? I cant say for sure, but this is a gorgeous chart any way you look at it. TECH has been aggressive or strong since the 3-4 consolidation. That said, I still see divergence here at these weekly highs though (Magenta arrows). This is Not excessively alarming, because on a weekly chart, things can continue for weeks, but I point it out for my readers anyway. What I see, you should see.
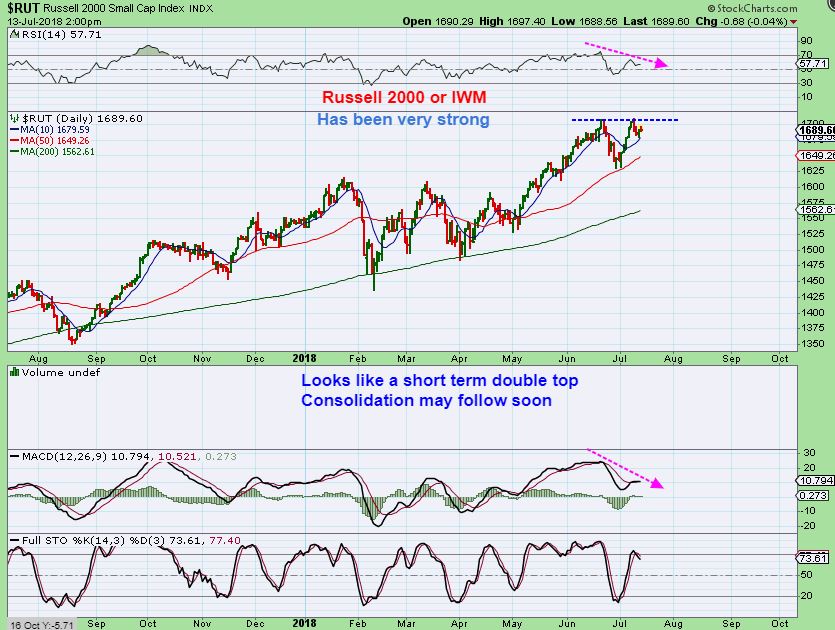
RUT or IWN– I’m using a daily here. Small Caps have been making a strong run out of that consolidation of Jan – May 2018 ( you will see this chart again later) . A drop to the 50 held as support in June, but now I see a bit of divergence at double top highs. That tells me that a dip or a sideways stall move may be coming. In other words: THIS IS NOT A SIGN OF STRENGTH SHORT TERM. Look at the RSI & MACD with price at new highs last week.
SO THE GENERAL MARKETS HAVE HAD A NICE RUN OUT OF THE LOWS. I SEE DIVERGENCE FORMING, SO WE COULD STALL OR DROP AT ANY TIME. STOPS CAN BE RAISED, BUT NOT TOO TIGHT, AND WE’LL WATCH THINGS UNFOLD FROM THERE.
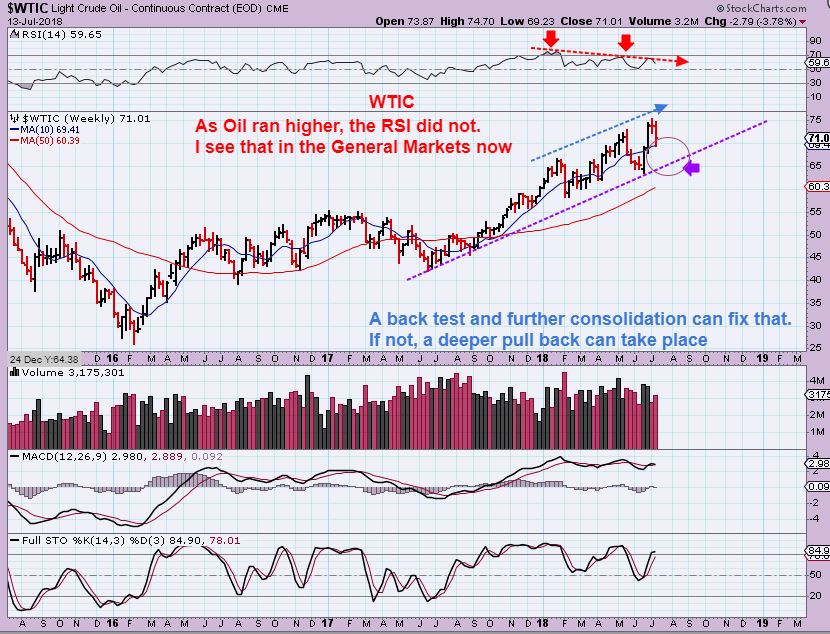
WTIC WEEKLY – I was pointing out that the XLE was NOT follow Oil to new highs, and I began expecting a drop in Oil for various reasons, divergence also started to show up in Oil.
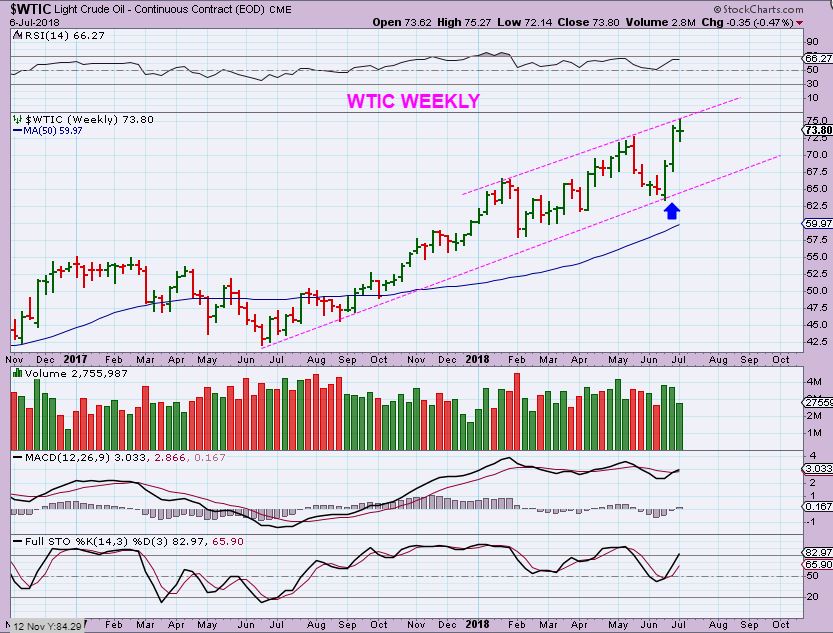
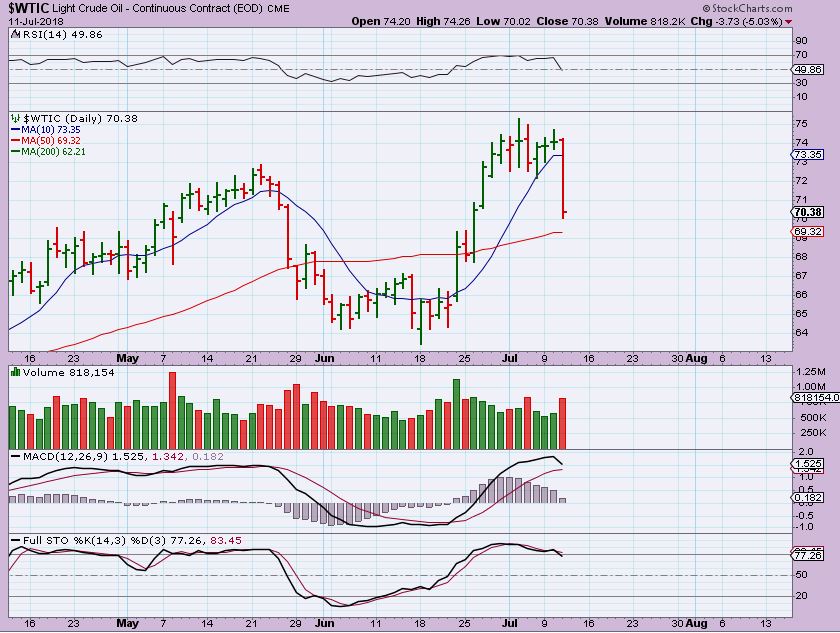
We got the drop Wednesday with the inventory report, and it was BIG. 5% for oil is very big in 1 day. REMEMBER: OILs daily cycles can be 40+ days long, and this looks to have topped on day 11? That is 3-4 weeks of seeking a dcl ahead. Let’s now look at the current weekly chart.
WTIC WEEKLY – Please Read the Chart, We COULD see the purple line tagged.
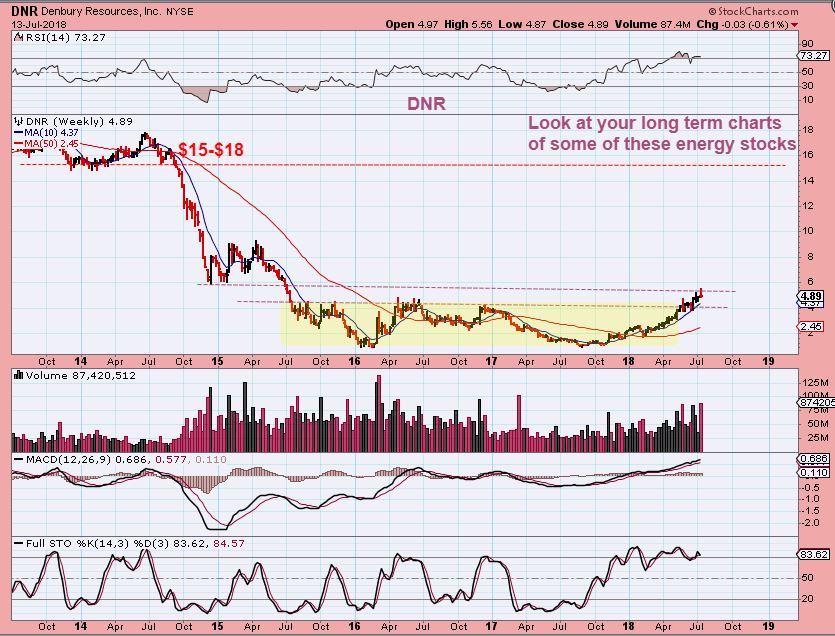
XLE WEEKLY HAS NOT CHANGED MUCH, so I began looking at Long Term charts of OAS, WPX, DNR, CPE, VLO, MRO, etc etc – They are bullish and as Oil dips down, they may set up for future buy opportunities. DNR for example, is breaking from a multi year base following a bear market crash in oil.
.
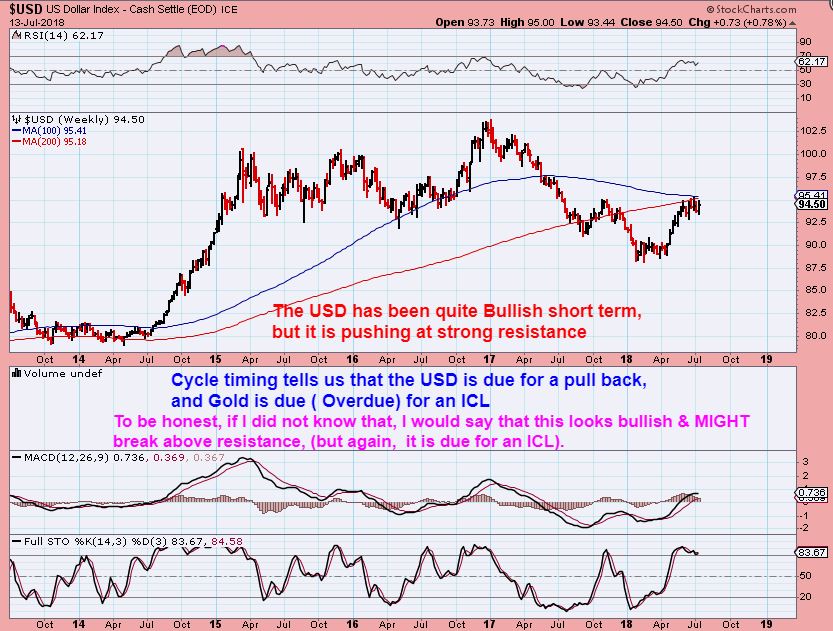
USD WEEKLY – Please read the chart
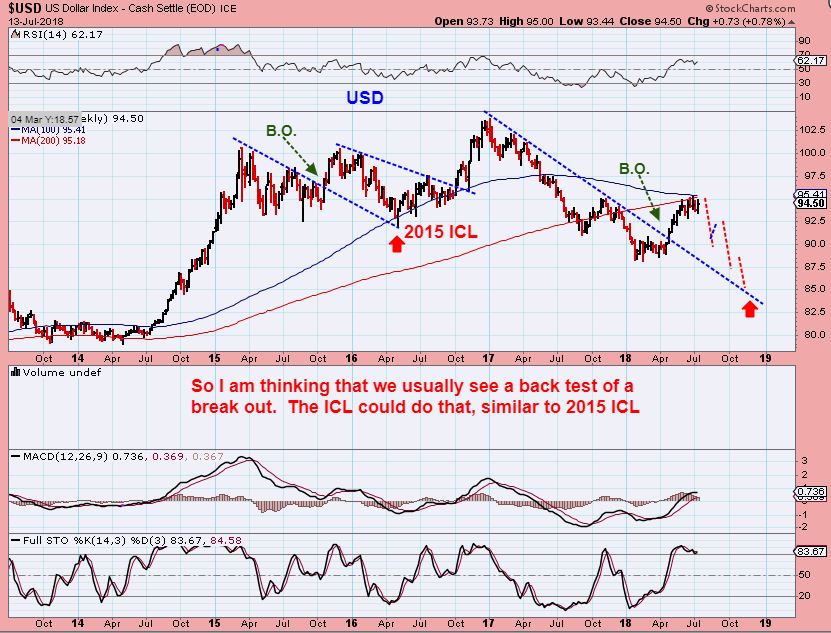
USD WEEKLY CLOSE UP – I like to try to make sense of what I am expecting, So lets say that resistance holds and the USD sells off. What could that look like, and does it make sense? I see that it could be a BACKTEST of the recent break out. See the chart.
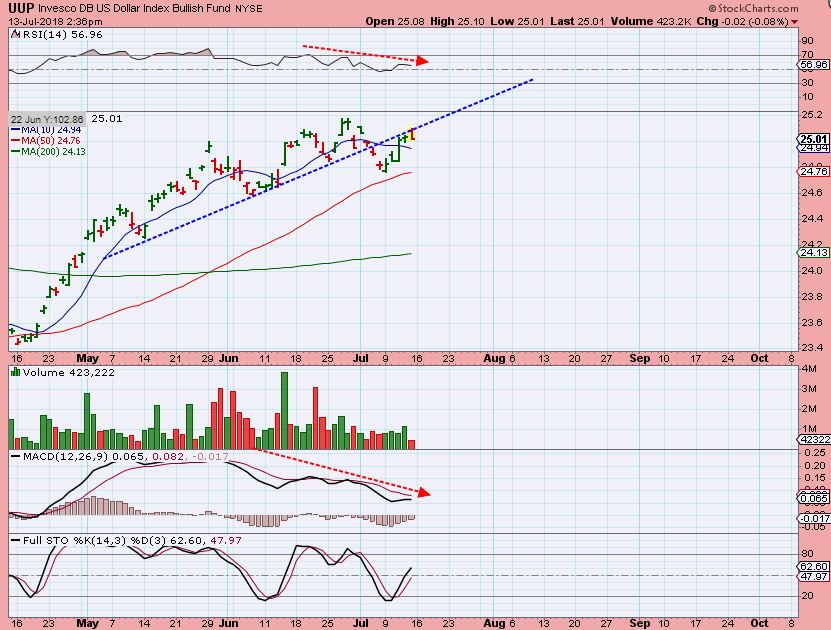
UUP- Short term the UUP MACD is dropping and this could have been a back test Friday & may be ready to drop. The USD on a daily should form L.T.
IN THE NEXT 2 CHARTS, I FOUND SOMETHING THAT I THOUGHT WAS VERY INTERESTING – MAYBE THEY WILL BE FOR YOU TOO
.
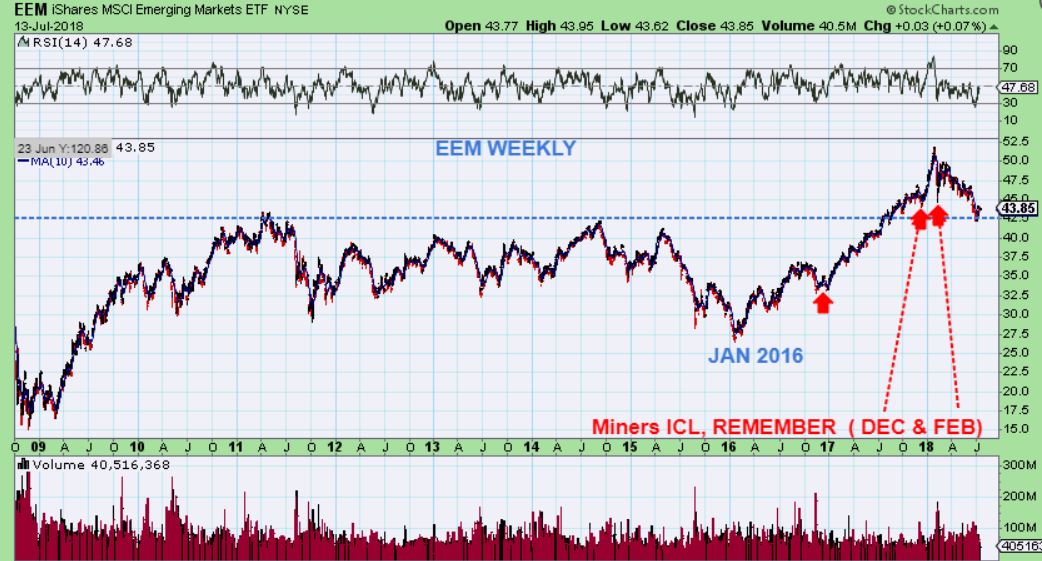
EEM DAILY – Check this out, and the 2nd chart really highlights it. Please read the chart.
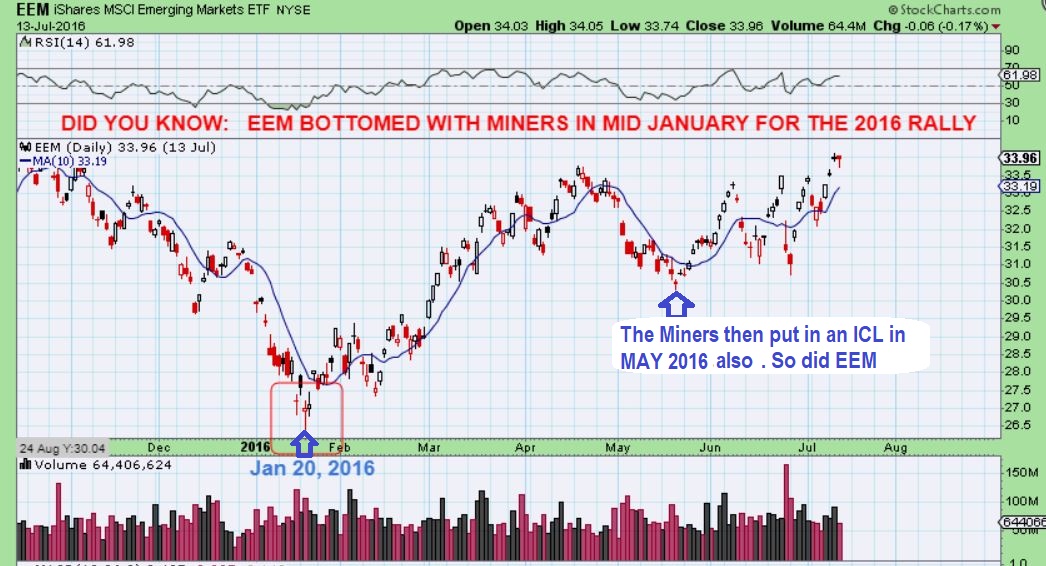
EEM – 1. On the 1 hand, I am going to say that EEM is a BUY now for the long term with this back test ICL. Someone asked me about Emerging Markets in the comments last week, and I mentioned that it looked to be putting in an ICL. I still believe that, and there are leveraged ETFS for EEM.
2. ** Then I started looking at more charts of the EEM and noticed that MINERS seem to bottom at a similar times. The charts price action isn’t the same, but the LOWS tend to have been forming at the same time.
3. We all remember the Miners bottomed JAN 2016. Look at JAN 2016 for EEM. And then May 2016. Dec 2016. Dec 2017, and FEB 2018 when I pointed out that GDX broke to new lows, and EEM sold down sharply too. So IF EEM JUST BOTTOMED WITH AN ICL, WHAT CONCLUSION DOES THAT LEAD ME TO MAKE? THAT MINERS HAVE OR WILL BOTTOM VERY SOON.
.
PRECIOUS METALS- I KNOW WHAT YOU MAY BE THINKING 🙂
Both SILVER & THE MINERS were holding up very well, yet now they began sinking. Lets look at The Precious Metals charts.
.
OOOPS, Wrong chart, Same concept, but that’s a ‘charter boat’ and not a ‘chart’, we’ll try again…

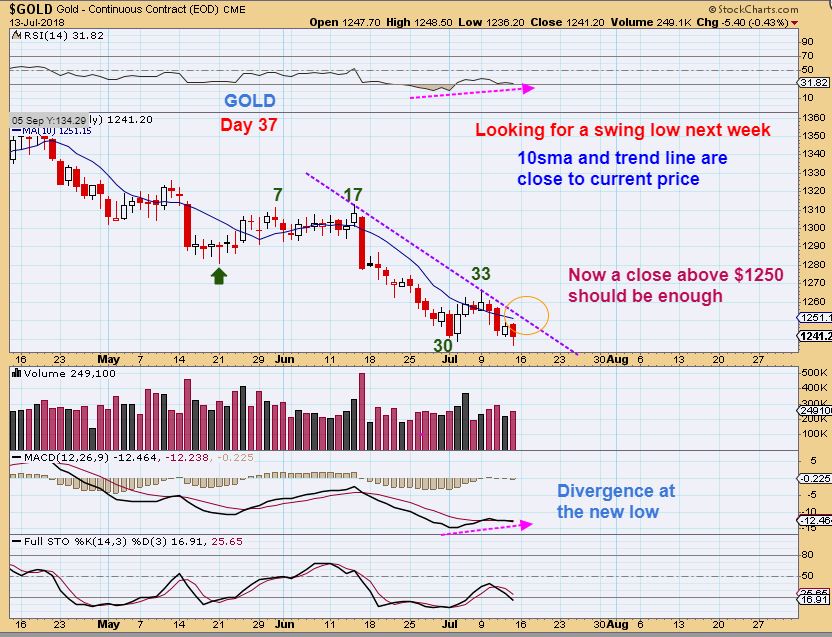
GOLD DAILY #1 – Bullish divergence appears as we make yet another low Friday. Please read the chart.
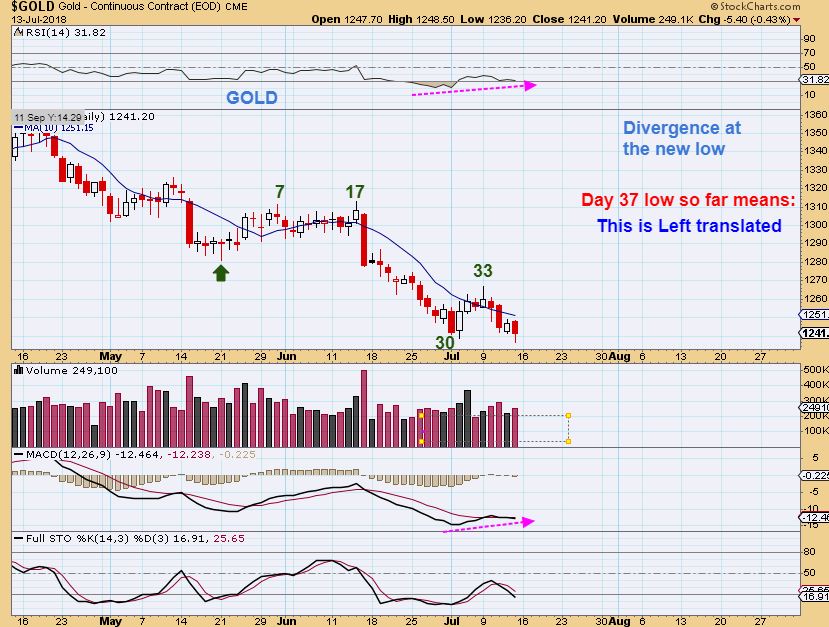
GOLD DAILY #2– It would be very easy to get what should be a confirmed swing low. We have both the 10sma & the trend line close to price, and it is day 37. Friday MIGHT have been the lows, though a deeper undercut would have been much better for a shake out.
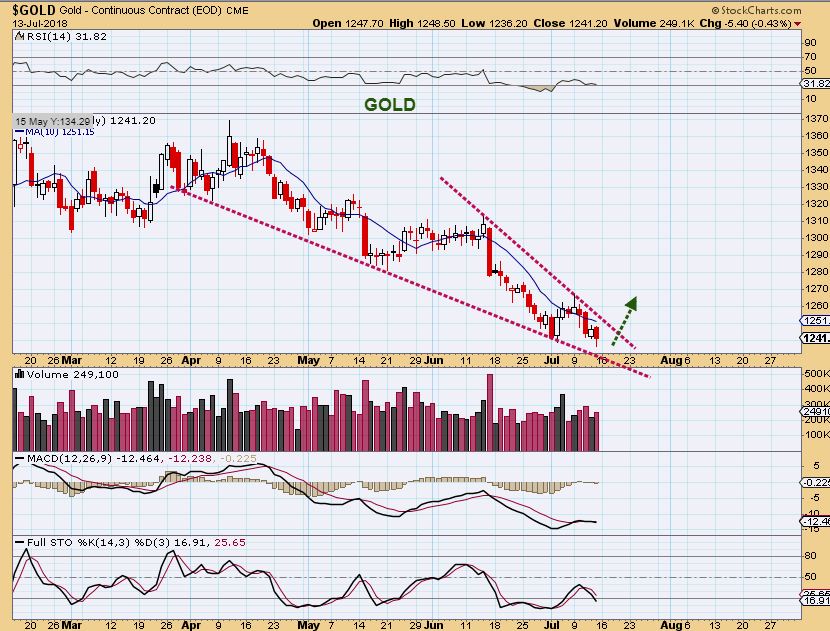
GOLD DAILY #3 – In Technical Analysis we also have a wedge and a break out is bullish there too.
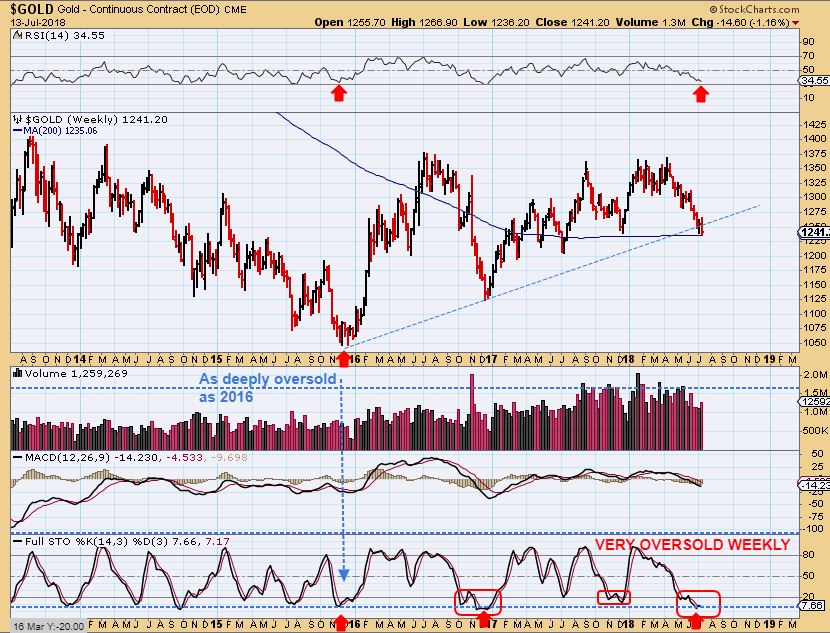
GOLD WEEKLY – Notice the 200 weekly ma & Stochastics. I really didn’t expect that uptrend line to break, but for now it could act as a shake out for this ICL.
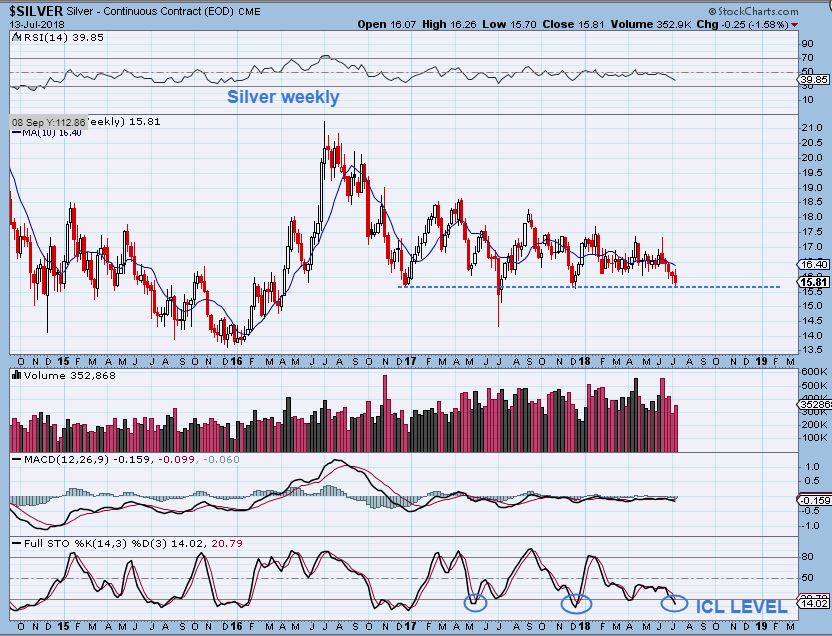
SILVER – Silver finally dropped, but it is at prior support. It is also finally oversold.
.
GDX #1 – The Million Dollar Question: Do Miners need to break down further? It is not oversold & Support is still below, similar to Silvers support.
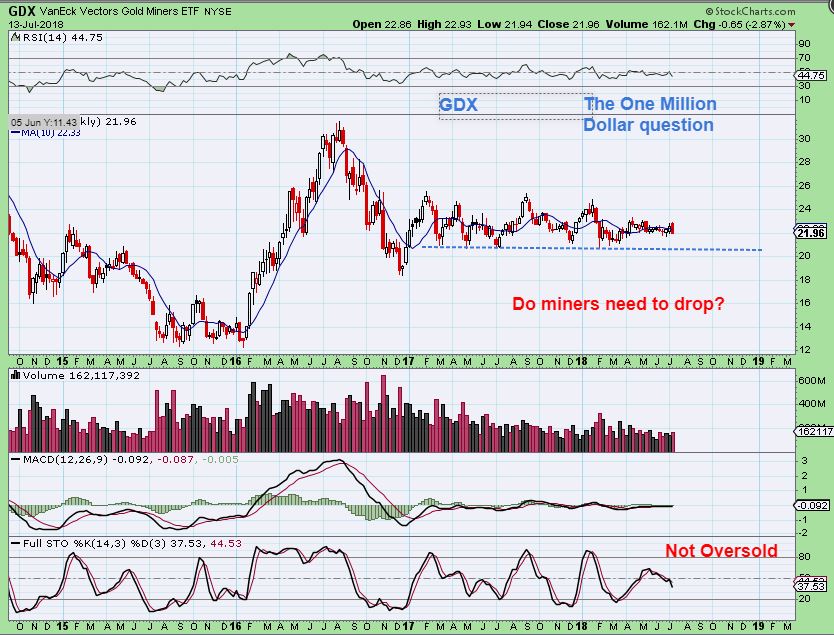
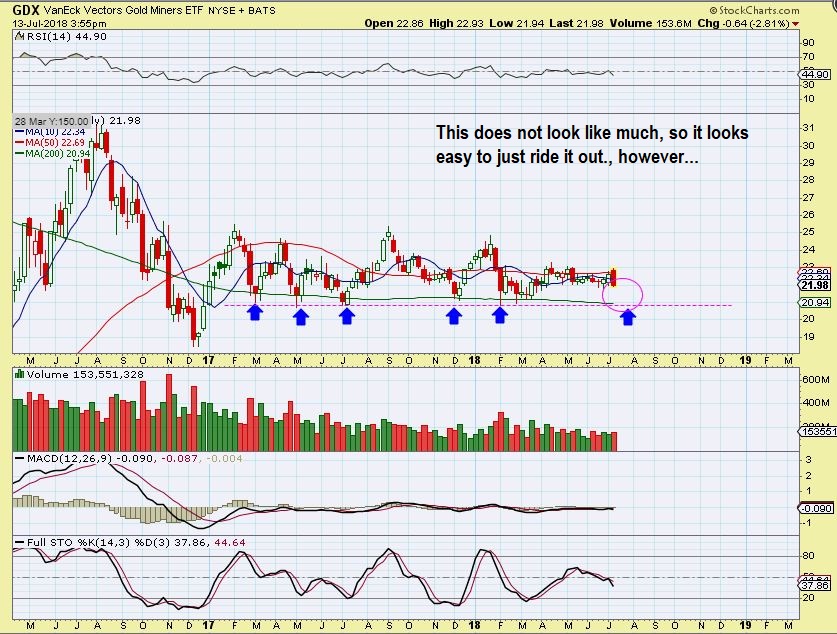
GDX #2 – Again, It is not oversold & Support is still below, similar to Silvers support. Yes, Miners CAN drop. Next week should be when we find out for sure whether they can keep resisting the sell down or not.
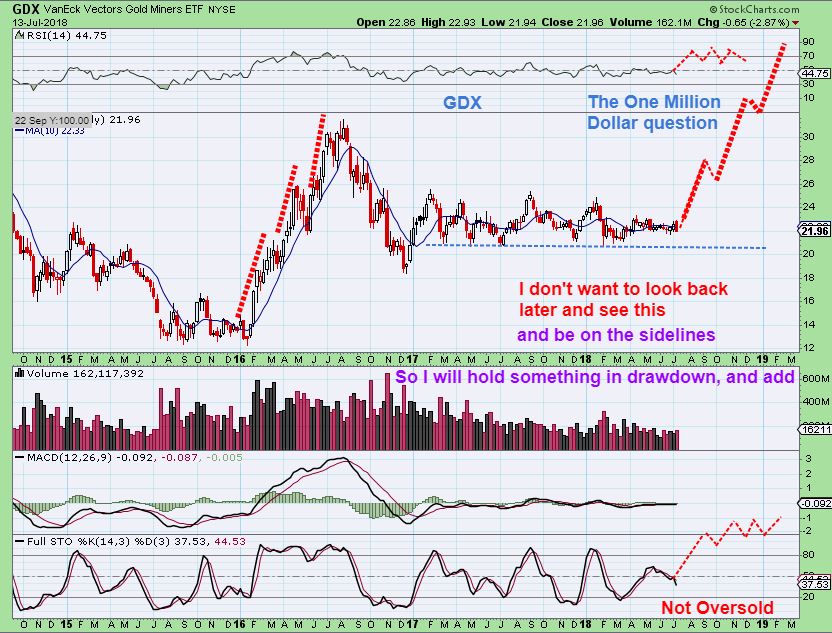
GDX #3 – As mentioned, I sold a few Miners earlier last week, but I am still holding a few positions in case we just take off. Yes, I do own some JNUG, so I will discuss JNUG too. Please understand that JNUG is not for everyone- it can be Very Difficult to endure during choppy times.
JNUG WILL NOT BE AN EASY RIDE IF WE SELL DOWN TO A QUICK DCL IN MINERS. EVEN A SHARP 4 DAY DROP CAN WEAKEN YOUR KNEES. LET ME EXPLAIN.
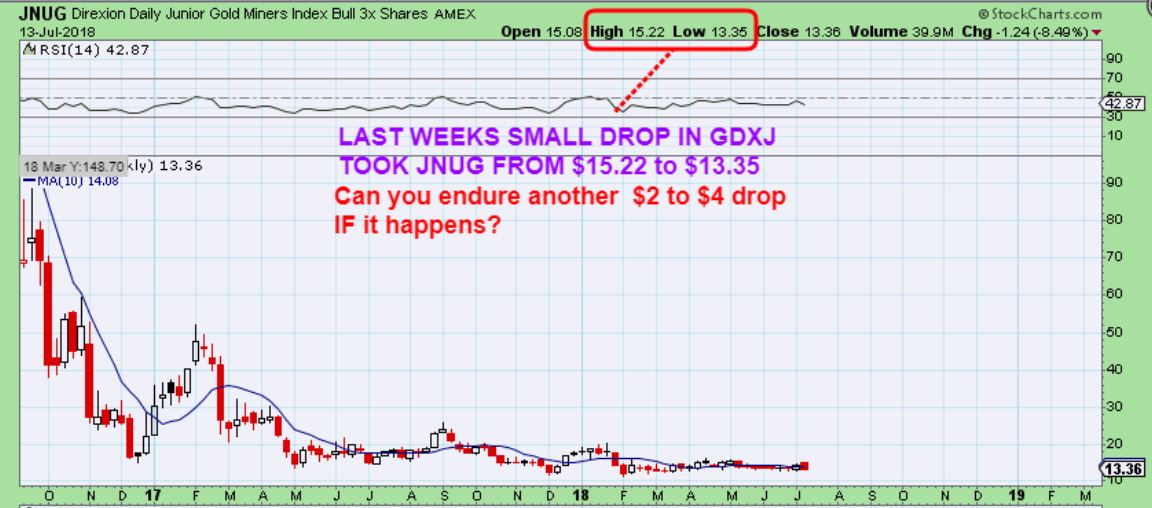
JNUG #1 – It is NOT for everyone. The small dip last week in GDXJ caused JNUG to drop from $15.22 to $13.35. 1000 shares lost $2000.00 2000 shares gave back $4000.00, etc . Read the chart…
JNUG #2 -In 2016 JNUGs final sell off from its ‘peak to low cut positions in half – WOW! Then of course it ran from $8 to $73 , and then $121 ( This may be split adjusted, but the % s are the same). My point is that until we get the lows in place, how far JNUG can drop is unknown and can be costly. ICLs in Miners can be rough.
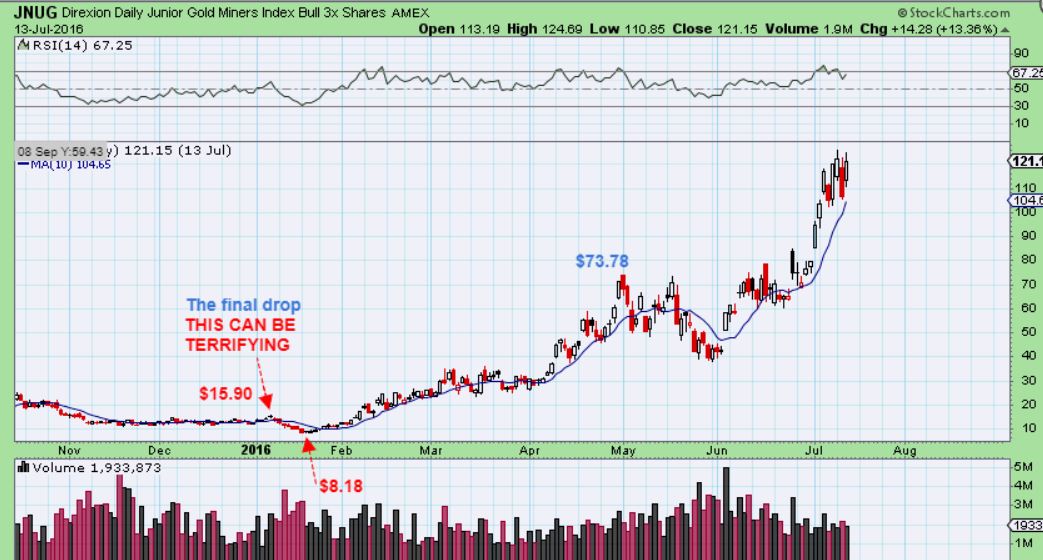
The benefits of JNUG after the lows are not a secret, I just dont like to get people too invested in these, for fear that they will hang on and lose so much on the dips. I have heard absolute Horror stories, seriously!
.
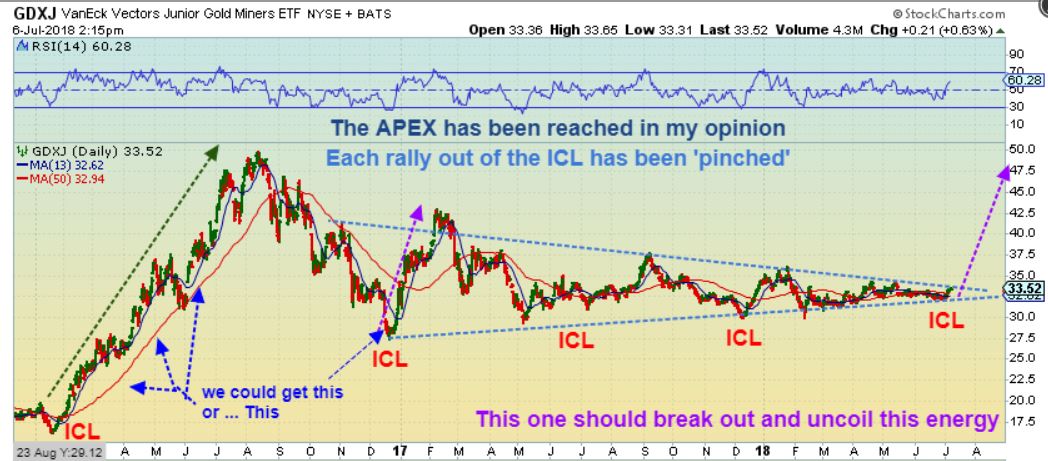
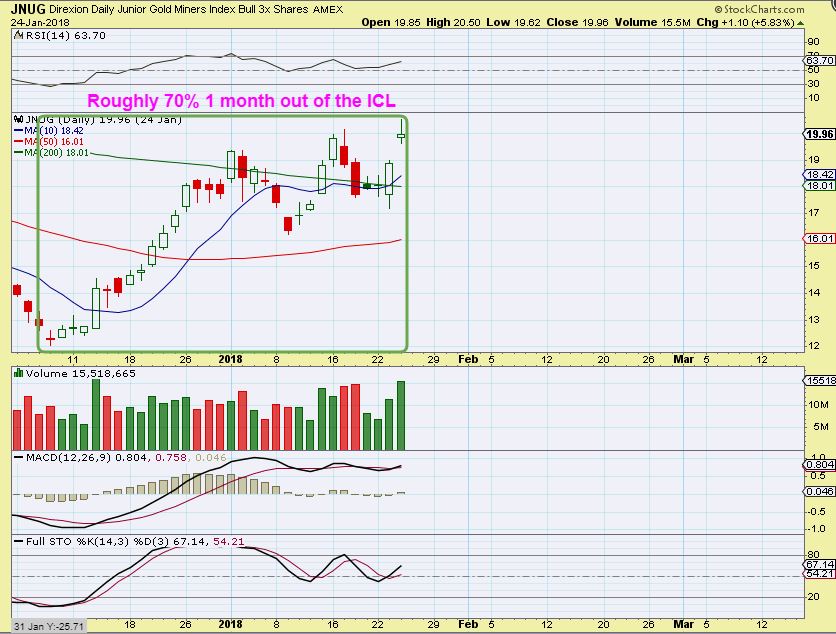
JNUG – Even though the last run up from the last ICL was short lived, due to the PINCH of the APEX on the GDXJ triangle, JUNG still gained 70% in 1 month. I am holding on to some JNUG now, and I plan on adding after the ICL is in place.
CONCLUSION: I have been focused on Precious Metals mainly in my detailed analysis. I have to be focused to help everyone here to also stay focused. I know that with each week that goes by, we have discussed the ‘Timing’ and the ‘set up’ in Precious Metals as being due for an ICL, and it may get wearisome waiting for things to play out. The rewards of riding out of that low, however, are usually exceptionally good.
Last week I expected to see that we either had a day 30 Low in place, or maybe a sharp break down & a quick recovery. At this point, we MIGHT have that low from Fridays dip, but it was a smaller break down than I would have liked to have seen to shake out the Bulls. 1 more sharp deeper jab at the lows CANNOT be ruled out, but we are closer to rallying out of the lows with each passing day.
And “HEY!”
Speaking of ‘Was that the lows with Fridays drop & reversal?”, CALs note showed that MANY ICLs actually came on Friday.
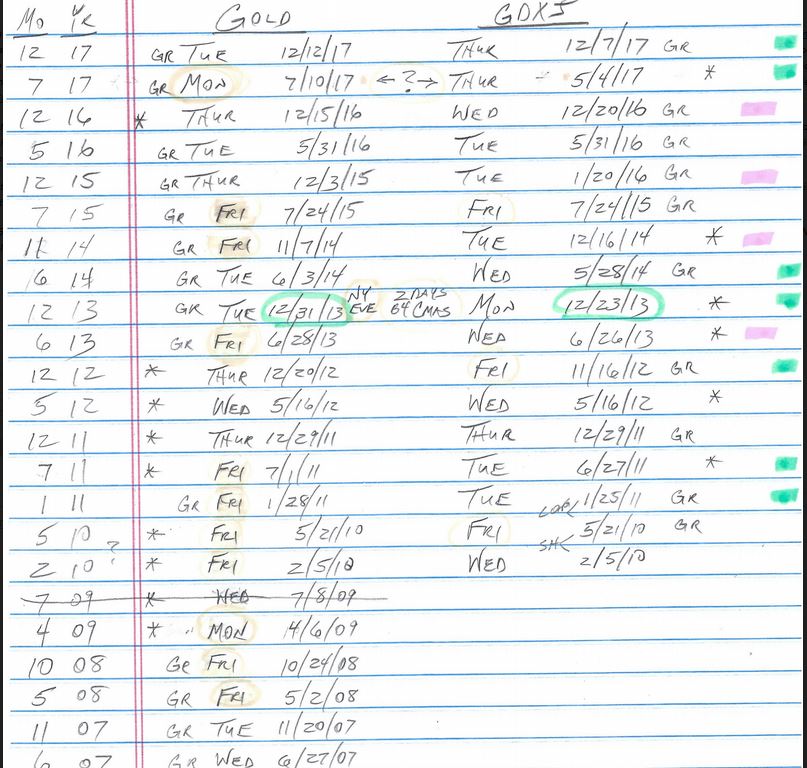
I thought about that and wondered if there was a psychology to that. Maybe a shake out low on Friday prevents buyers from entering before a weekend, thinking ” I don’t want to be long just in case Gold drops Sunday night into Monday“. And then off it goes when Buyers step in on Monday & shorts cover? Well, whether that is the case or whether it is just a coincidence doesn’t really matter. We are close and we’ll see what next week brings.
.
Enjoy the rest of your weekend, and thanks for being a chartfreak with me!
.
~ALEX
.
RUT WEEKLY TRIANGLE – I wanted to go back to this to show how these Triangle consolidations can break out & run higher, with all of that energy built up. The RUT Triangle was so textbook, that it even paused to back test the triangle. That can be a nice entry point for ‘adding to position’. Why review this?…
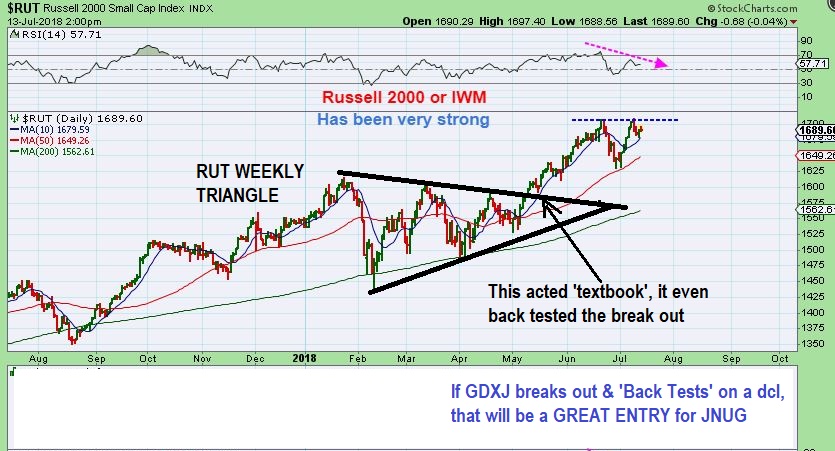
IF THIS GINAT TRIANGLE BREAKS, THE RUN COULD BE EXCEPTIONAL. I WANT US TO BE BE READY FOR THE NEXT TRIANGLE BREAK & RUN.
🙂