Tuesday June 5th
Since the weekend report, there really isn’t a lot of change here, so let’s do a quick review…
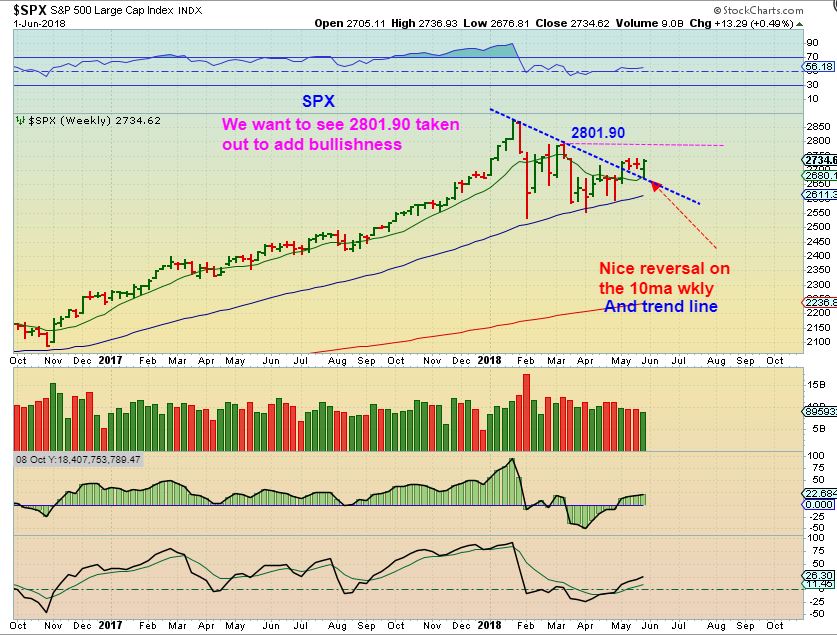
SPX – From the weekend, the General Markets looked to be the bullish set up after breaking out from a down trend and reversing off of the 10ma.
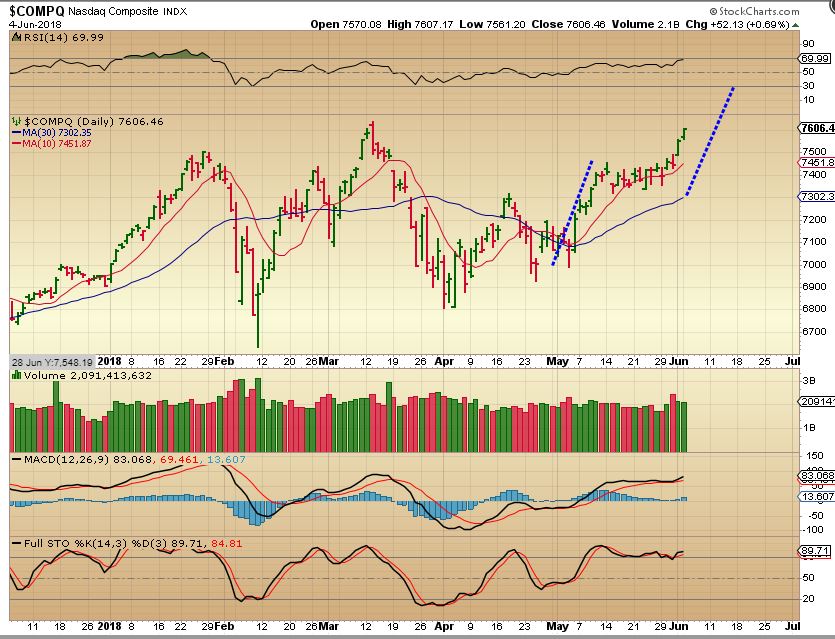
NASDAQ – We continue to see follow through after what looks like a consolidation at a 1/2 way point.
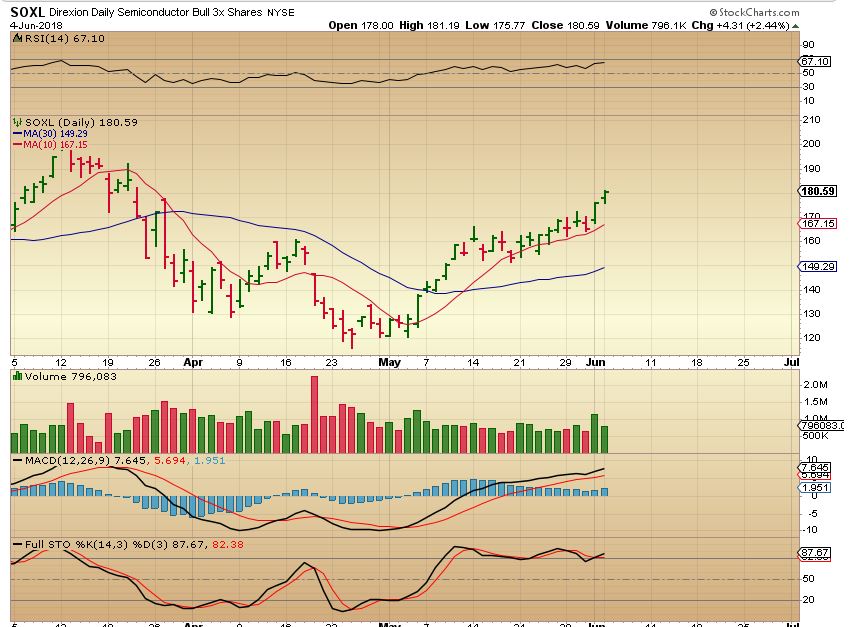
Last week this chart was posted showing that on JUNE 1 SOX or SOXL & SEMICONDUCTORS continued to be a Buy for the same reason
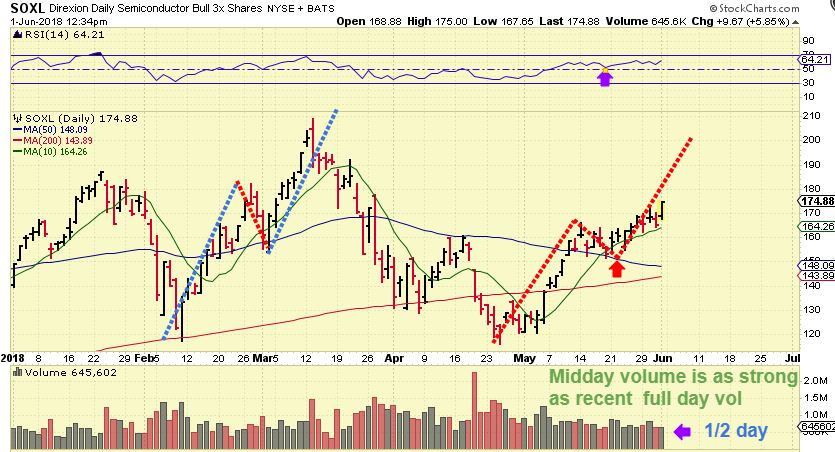
SOXL YESTERDAY – We have follow through and more upside is expected, I mentioned SOXL hitting 200 as an expectation.
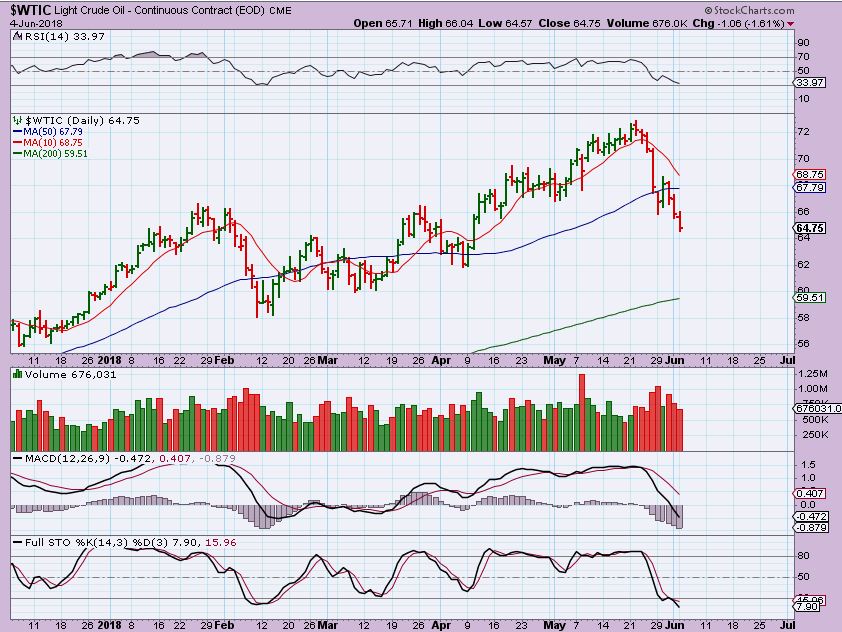
WTIC – Oil continued to pull back and showed no reversal yet, I have expected more of an a-b-c type drop like we see here, rather than allowing that reversal last week draw us back to the long side. The selling is starting to dry up volume-wise, and a reversal may be close.
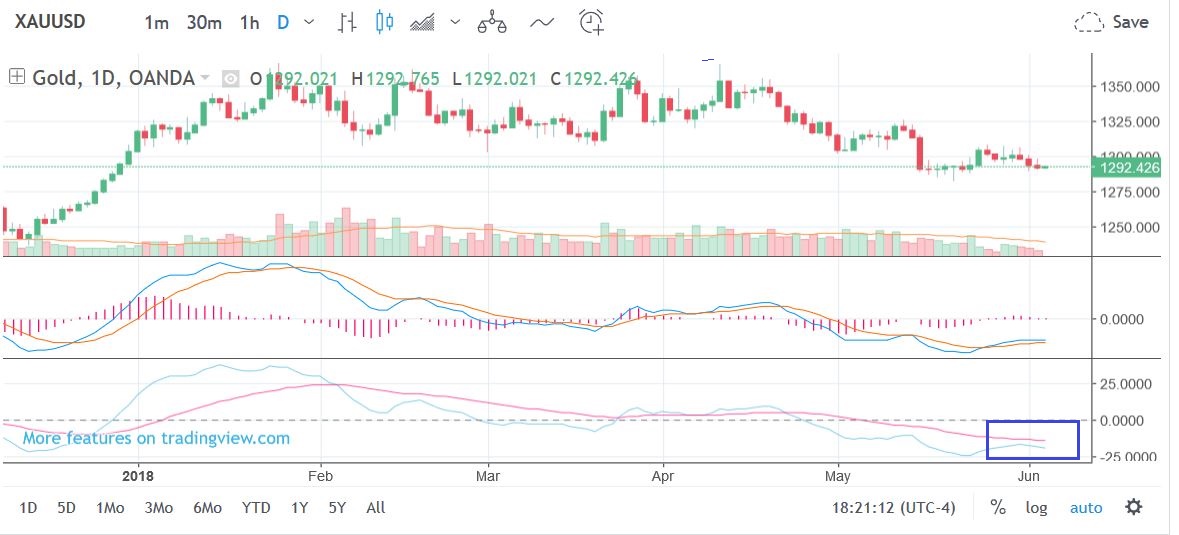
GOLD is still doing absolutely nothing helpful. 🙂 It is drifting sideways for now. My lower indicator is curling down at this point.
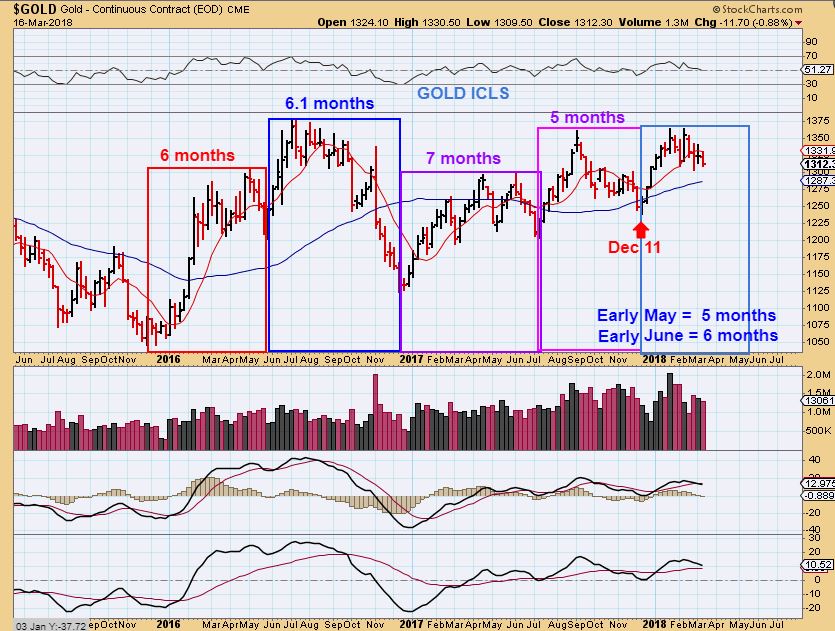
GOLD- We must just look at this so far as simply “Gold in a down trend”. It is lower highs and lower lows, trapped under the 50sma, and that down trend line has not convincingly been broken. With that in mind…
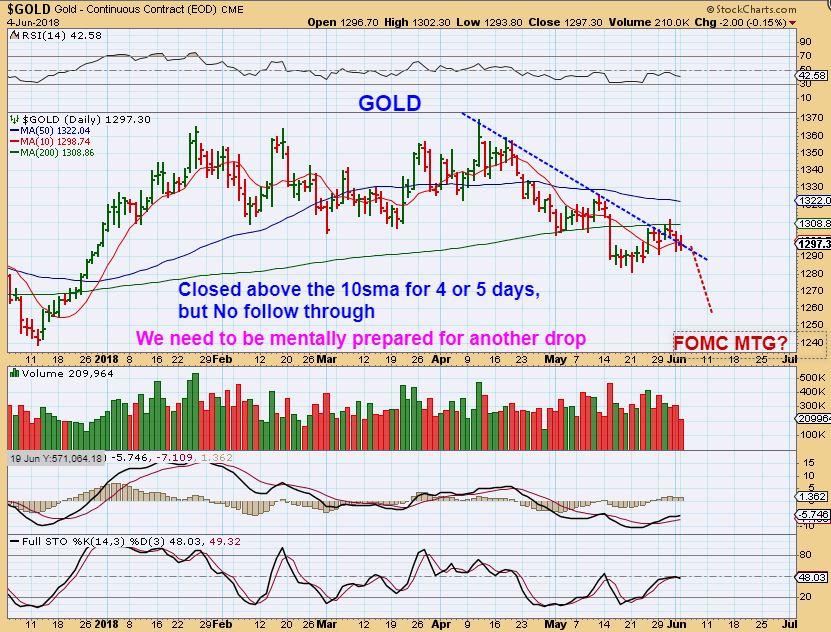
With that in mind… This is an older chart from Mid May and I am anticipating a meaningful low sometime soon. We know that Gold bottoms into an ICL every 5,6,or 7 months, and that timing falls into May, June, or July.
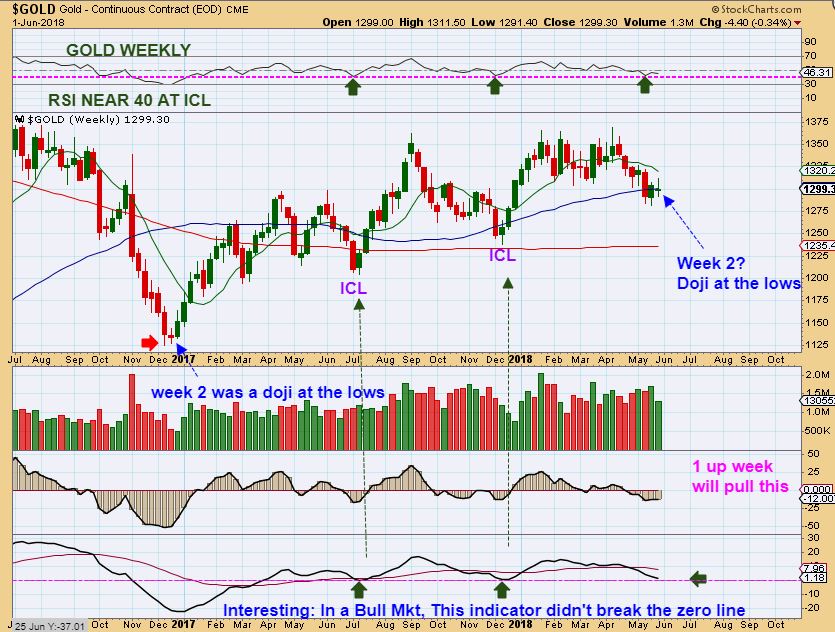
The WEEKLY CHART this weekend shows us how very close we are, we just need to be patient to allow GOLD to tell us when to go long. We may get another drop in Gold & Miners heading into the FOMC Mtg NEXT WEEK- OR THIS SECTOR COULD BOTTOM EARLIER, JUST AHEAD OF THAT MTG. I am watching this area closely, I expect a nice run in Miners when the ‘time is right. Soon!
Below I will have a few interesting charts. I am still trying to hold mostly cash for the Miners, but as a trader for a living, I do trade some Bullish looking set ups, so I will post a few more trade ideas below. After consolidation periods, leaders often pop & run higher. Enjoy your Tuesday trading!
~ALEX
I WANT TO RELEASE THIS at 7:30 a.m. Eastern Time, SO I WILL DO THAT NOW AND PROOF READ THIS AND FIX MISTAKES AFTER.
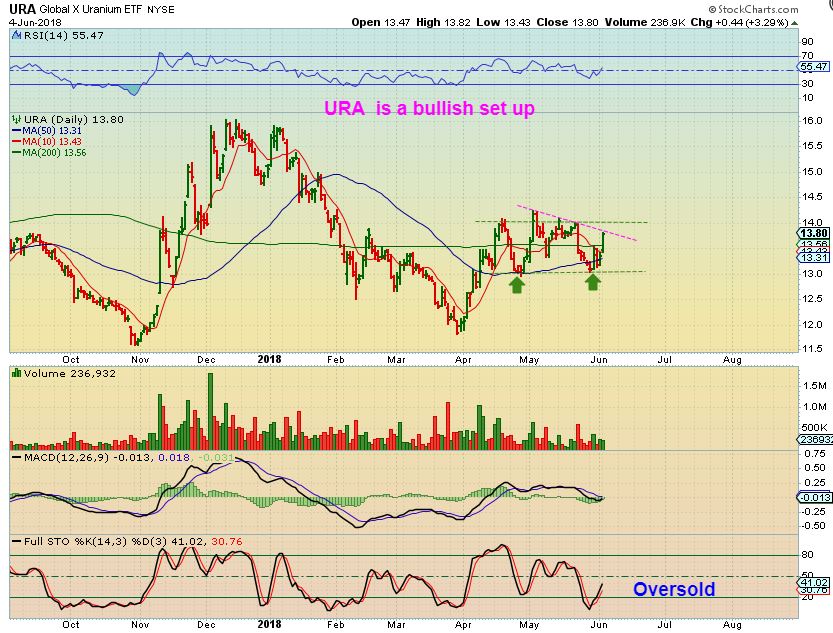
I wanted to mention that Uranium STOCKS AND URA ( etf) were Bullish set ups and I wrote that in a recent section of a report. They ran higher but started going sideways or consolidating those gains. They do look ready to go again, and this sector may be becoming longer term Bullish. Let’s take a look at these stocks again. They include stocks like CCJ, DXE, UEC, URG, UUUU, DNN, etc
URA – The ETF has a bullish set up with this consolidation. It closed above the 50sma and 200sma yesterday. It is a BUY with a break of the Magenta line.
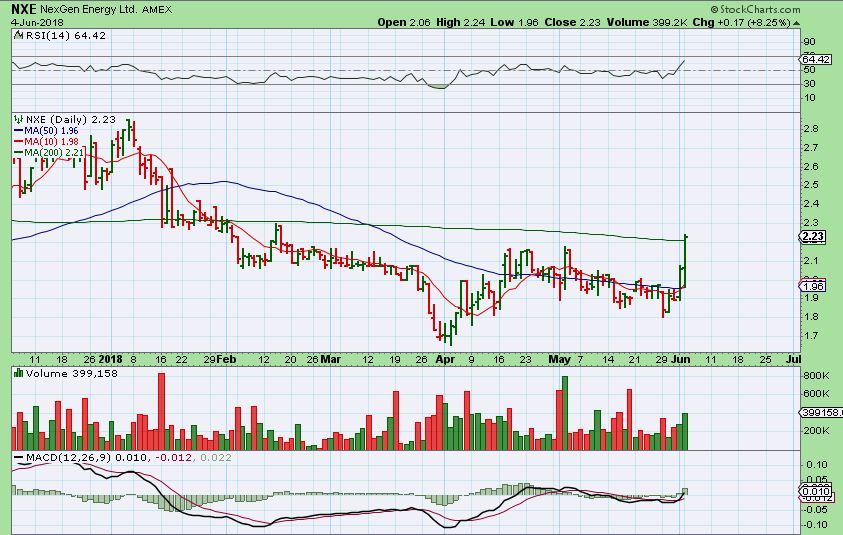
NXE this broke above the 50sma last Friday- This was midday yesterday and you can see the strength, so…
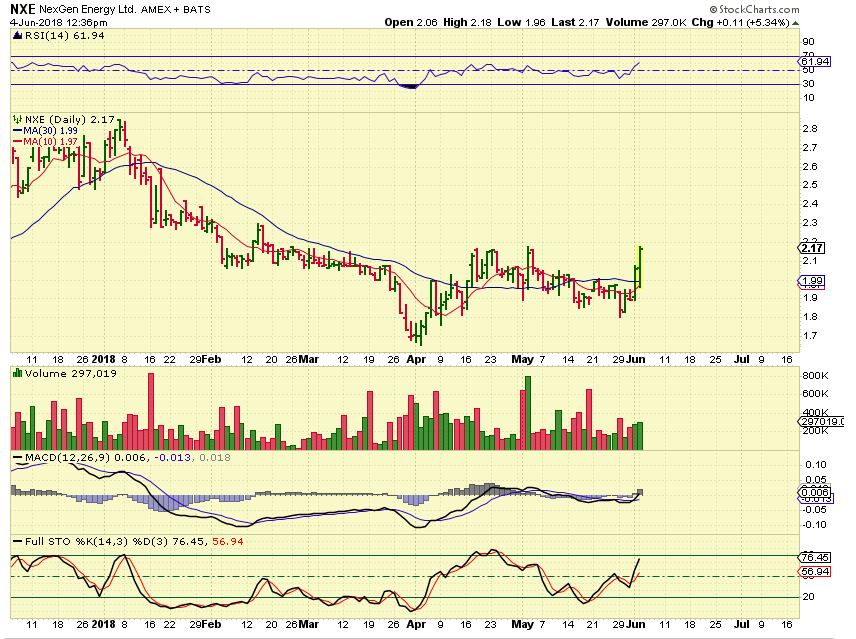
NXE at the close- It closed above both the 50 & 200sma. This could just run higher, but it would be best to put it on a watch list and see if it back tests or crawls along the 200sma.
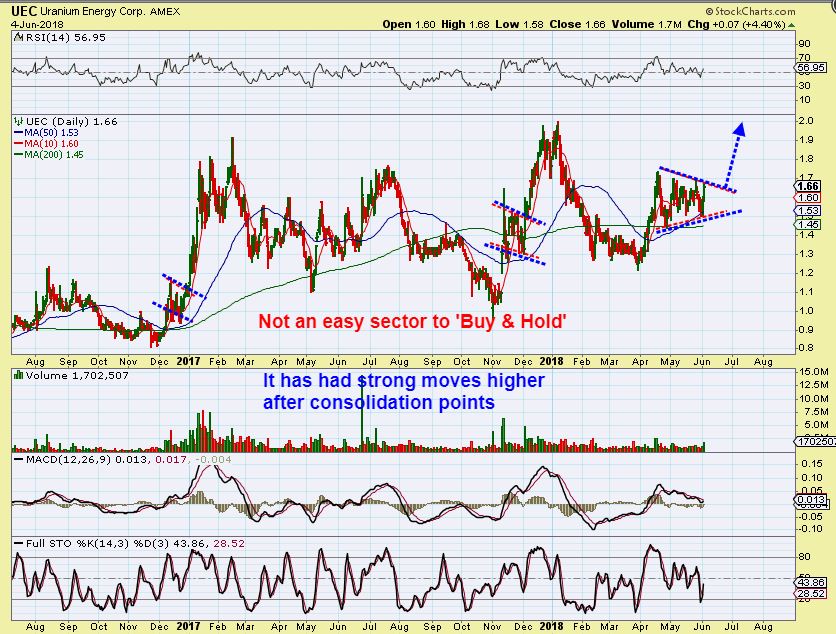
SAME SECTOR, JUST GETTING GOING
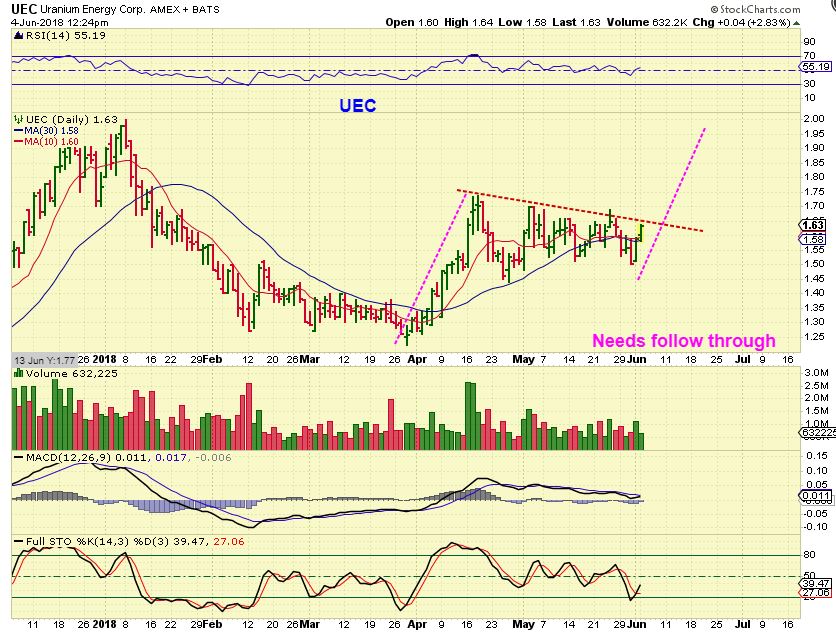
UEC – This has been churning for weeks and almost 2 months, but it may be ready to break out & run higher.
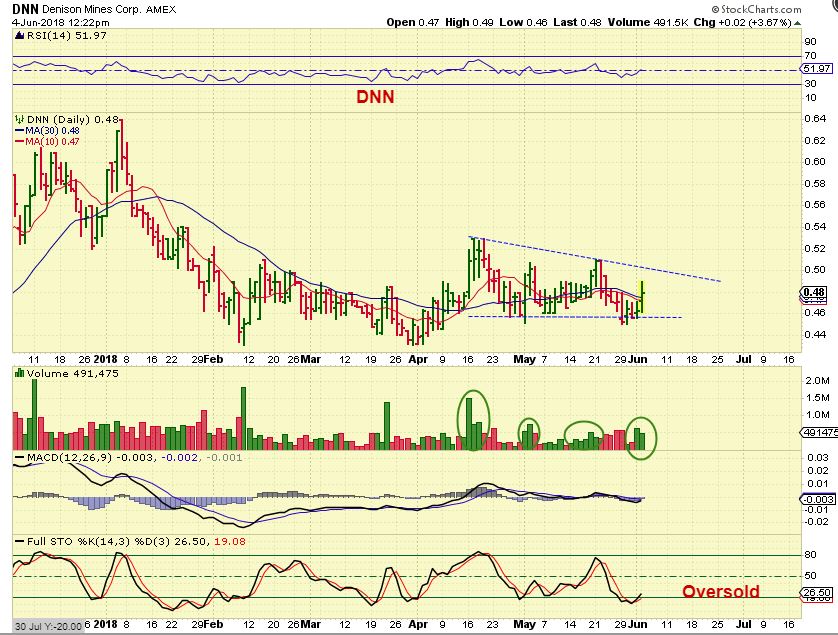
DNN – This one is still at the lows of its consolidation and has formed a long base. I owned it inside of this consolidation, but I sold it when it did not break out. It may be ready now, since the sector looks good.
UEC– This may be ready to break out here, or it could dip to the lower line & then break out, but this is a bullish consolidation. Buy the break out, or if it drops, you could have it on a watch list and buy at the lows on a reversal.
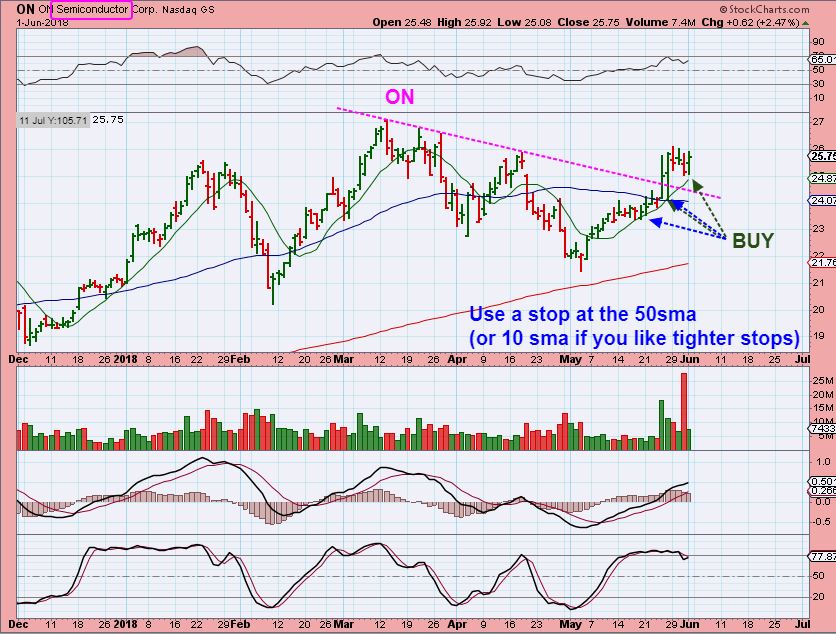
ON– From the weekend report – I like the semiconductors. This one had a bull Flag that seems to have formed after a break out
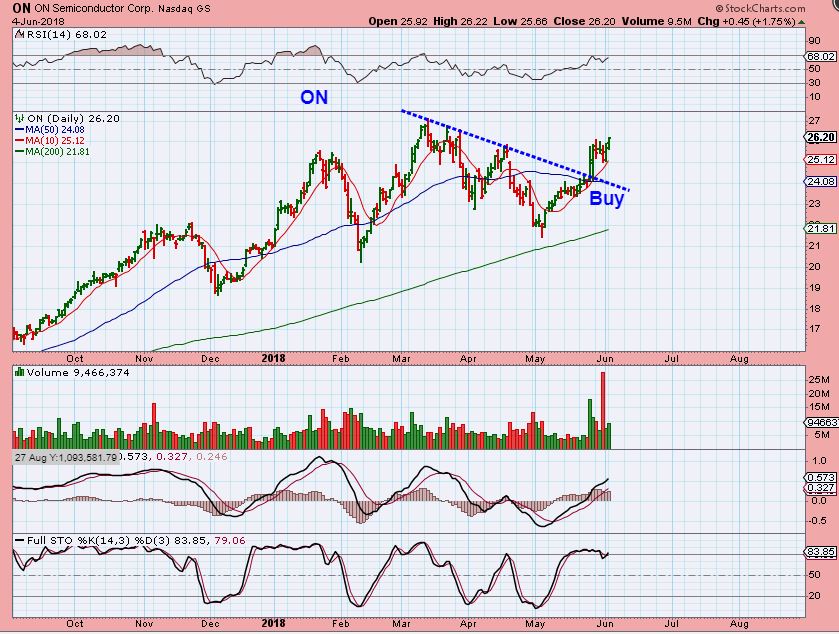
ON from yesterday, it is finding some follow through and may break to new highs
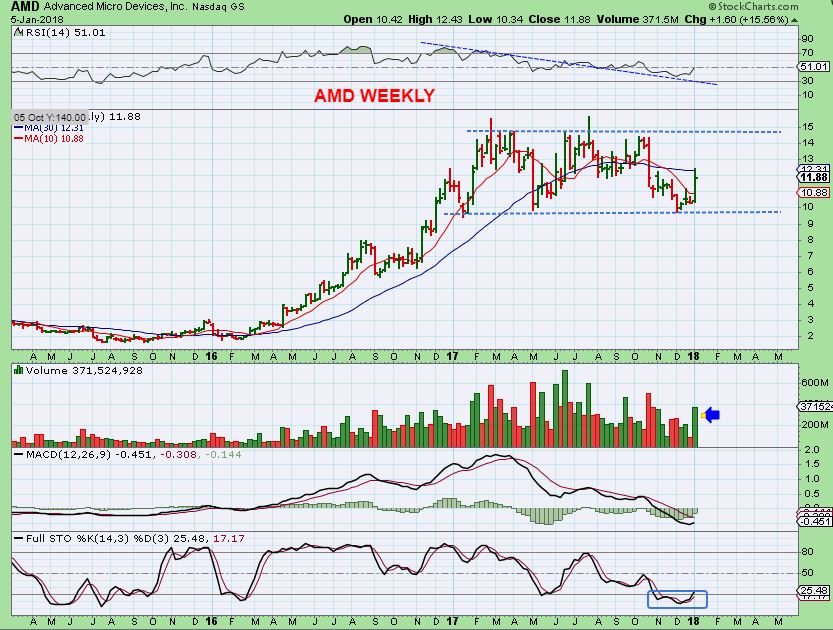
Does anyone remember me saying that you should buy AMD at $9 & sell at $15 in the past, due to this massive consolidation range? I also mentioned that IF IT BREAKS THAT $15 top, it could run into the $20’s
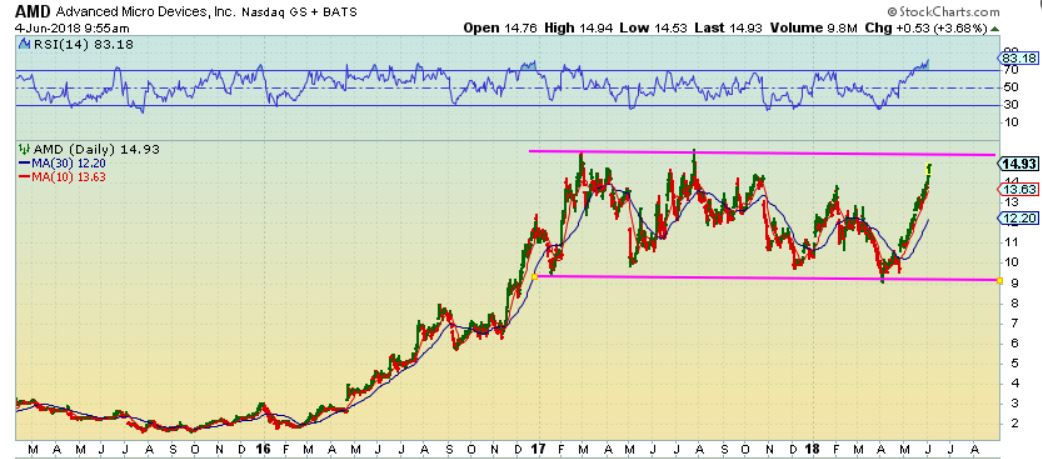
AMD is heading for that $15 area again. The February sell off interfered with the last run toward $15, but it is now running straight up. I’d put this on a watch list, it could crawl at $15, or break out & back test, etc- OR – It remains in this range .
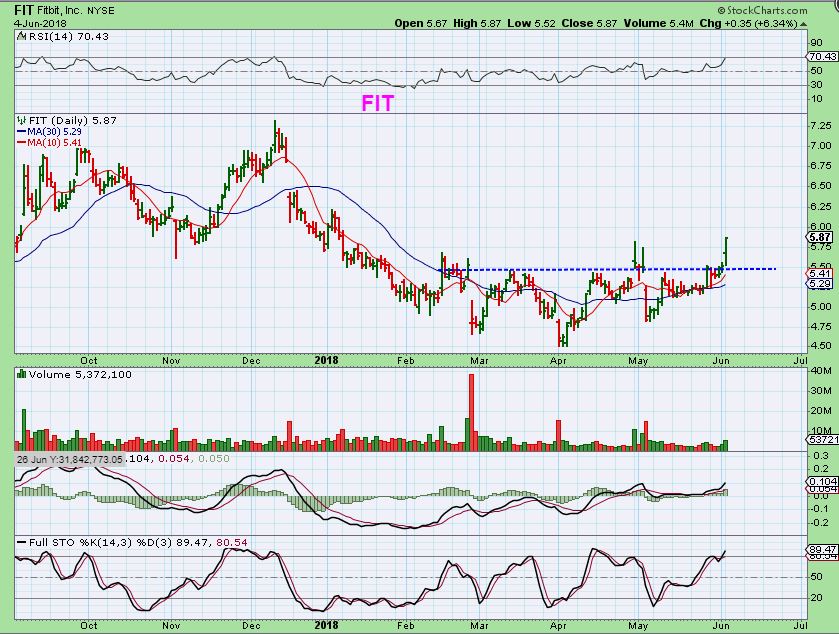
FIT is breaking out from a base that looks like an inverse H&S. It has tried to break out in this area in early May , but struggled when sellers stepped in. It may be ready to run to $7.25 now. This was a ‘break out buy’, and if it dips back to test the blue line, it would be a buy with a stop.
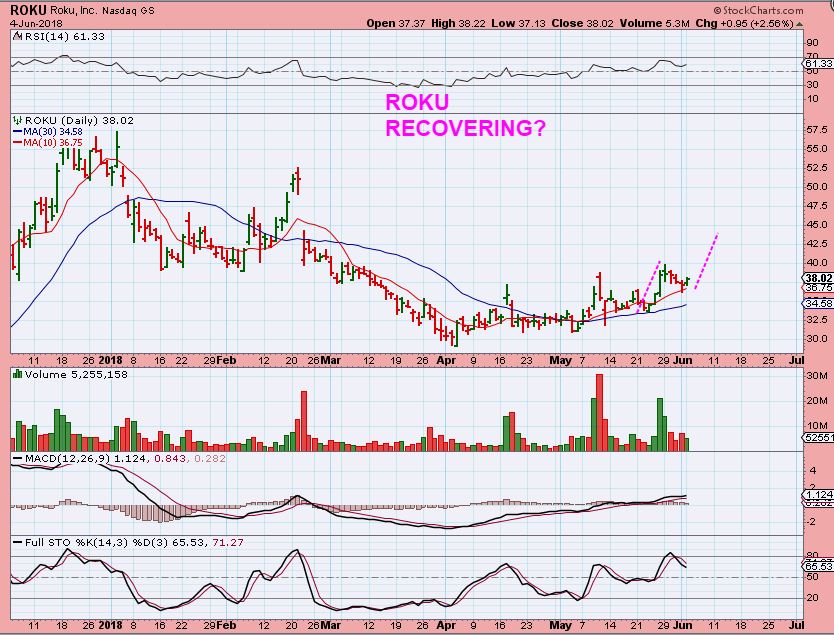
ROKU looks like a low risk buy right here, since it sits on the 10sma after a small run higher. It is slowly making higher lows, higher highs.
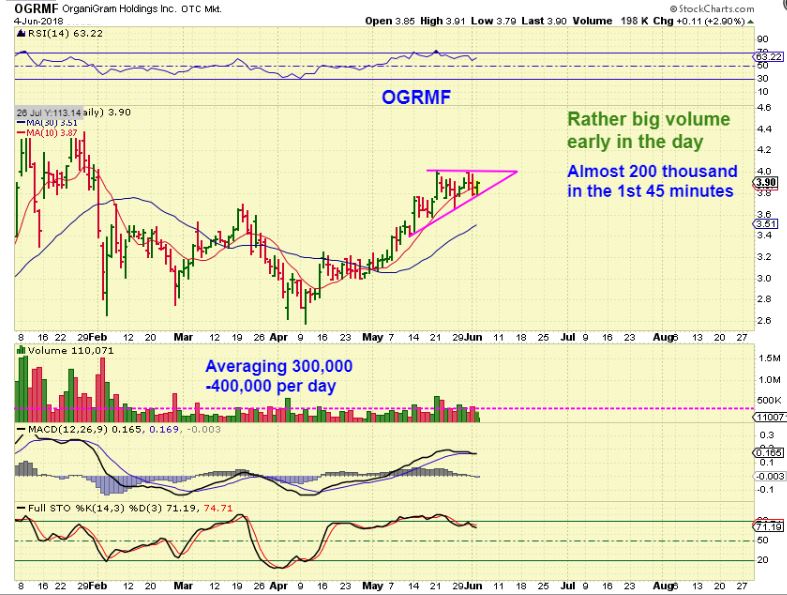
OGRMF- I Still own this and it should continue higher
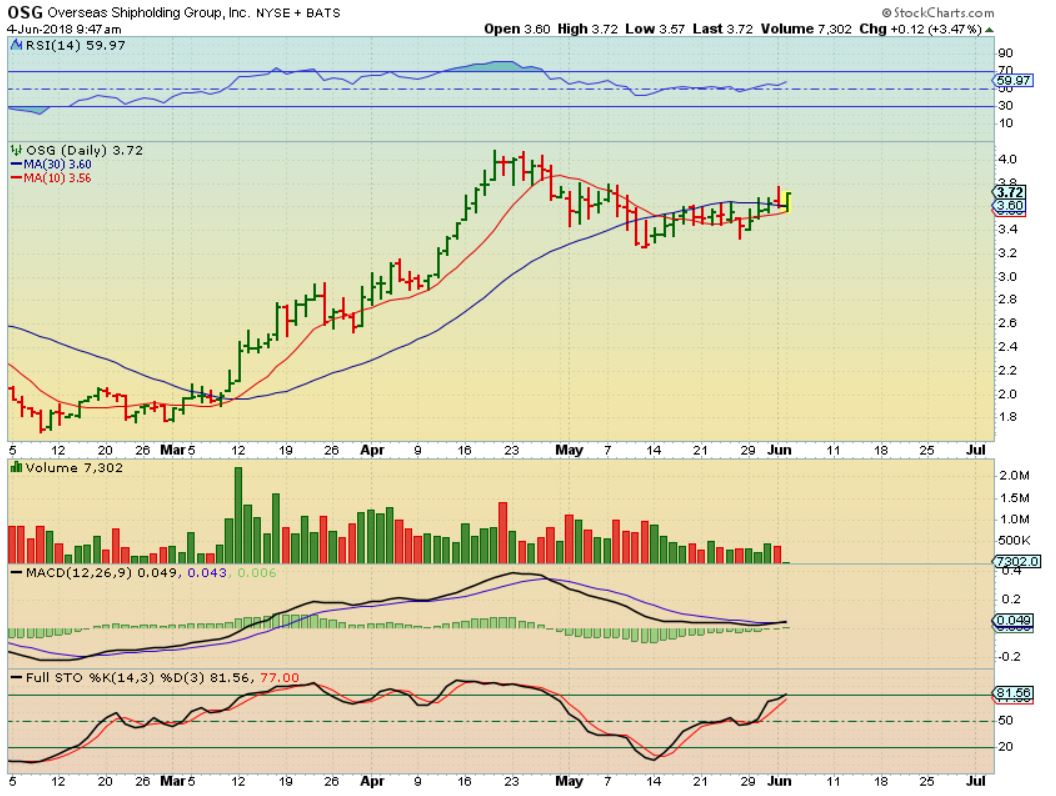
OSG – I bought this yesterday when I noticed that it landed on the 10sma ( red line) . This chart has the 30sma, but the 50sma is under price . It is a Bullish looking Shipper set up.
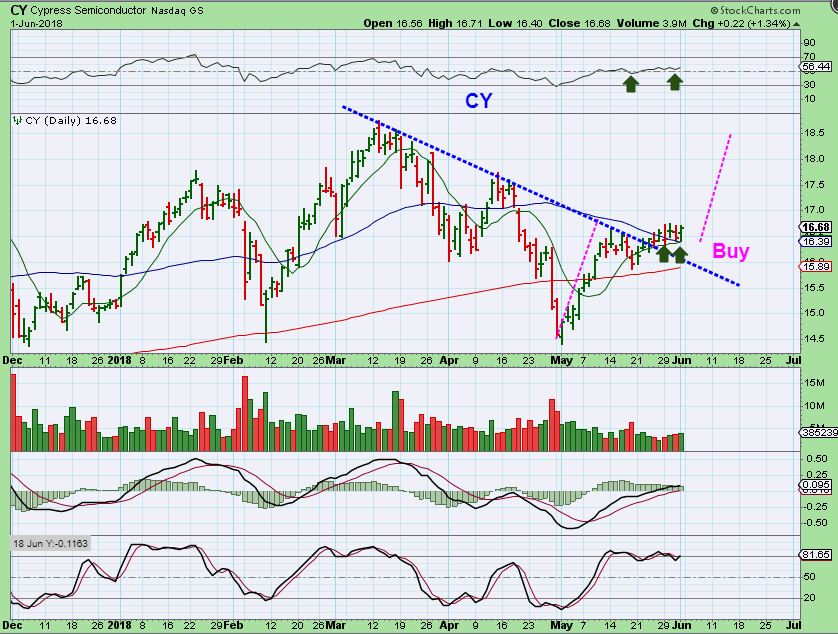
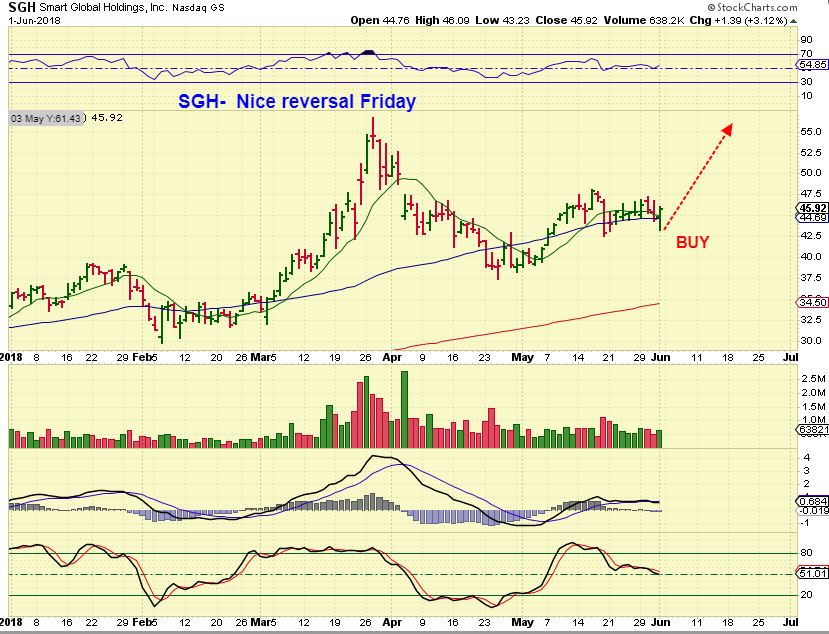
I had some trade set ups in the weekend report too, so keep those on a watch list too. This is an example of a few…
CY
SGH
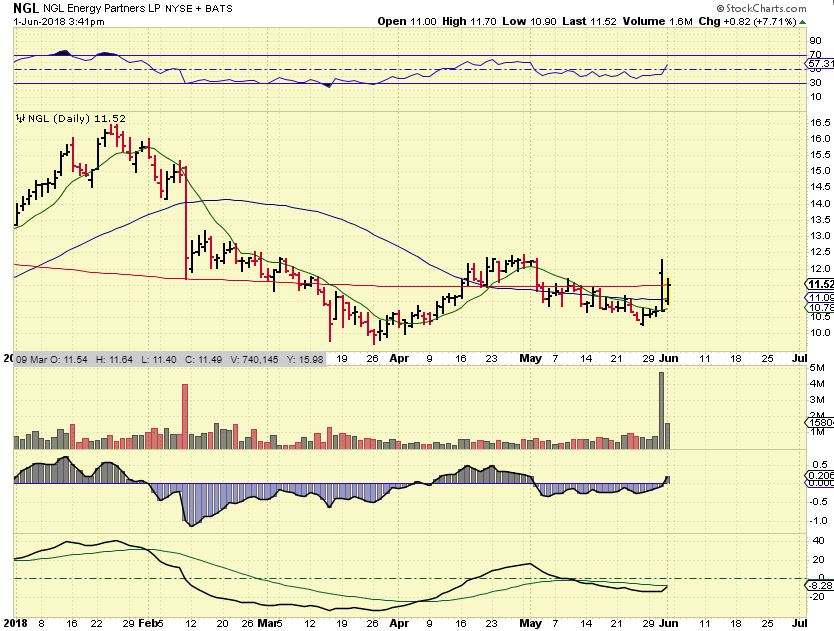
NGL