
Tuesday June 26th – Market Drops Monday
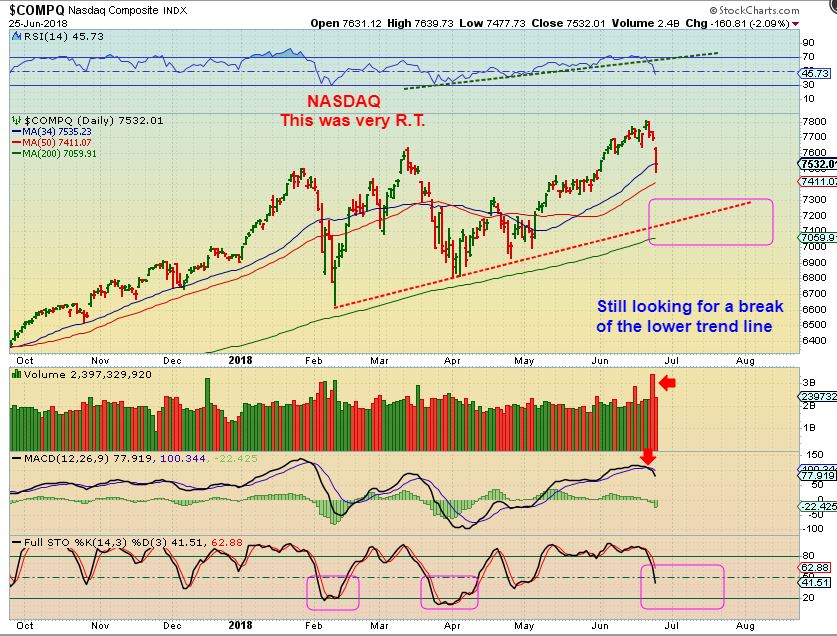
NASDAQ – June 18th, I showed the bearish rising wedge forming on the SPX & NASDAQ . Read the chart.
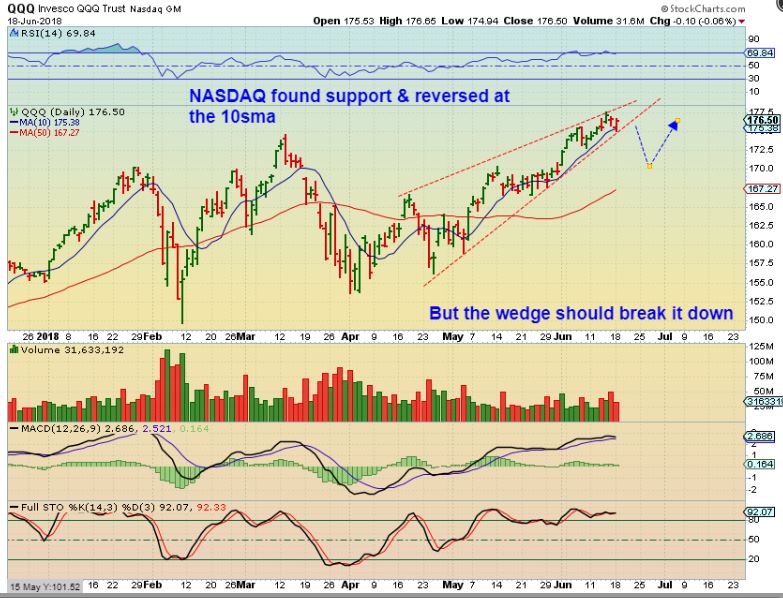
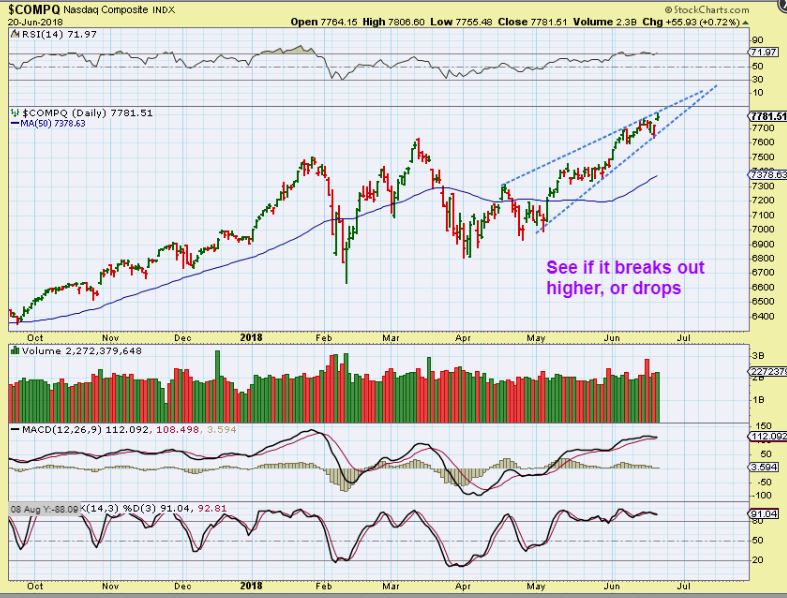
NASDAQ – After 4 drops & reversals higher in a row, we had a POP to new highs. Deceptively strong looking, but the WEDGE was still in tact, so I wrote that “we would see if this bearish rising wedge would break out higher or down” ( They almost always drop down).
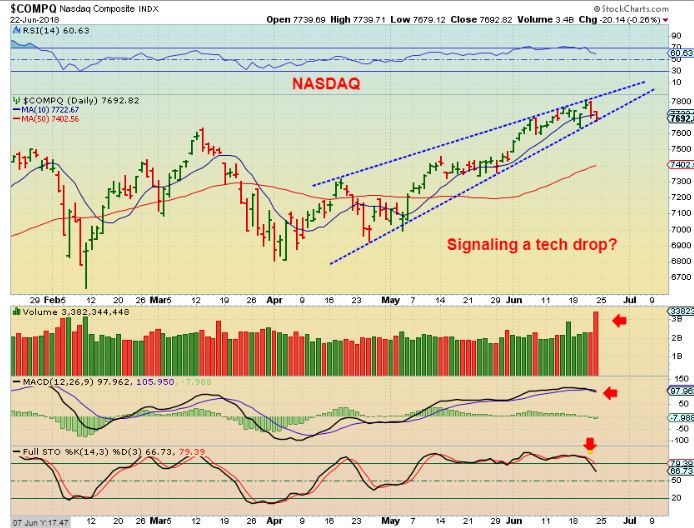
THE WEEKEND REPORT SHOWED THIS WEDGE AGAIN. I SEE A HIGH VOLUME DROP FRIDAY THAT WAS LIKELY POINTING TO A COMING TECH DROP.
NASDAQ – Monday at 10 in the morning , this is how Monday started…
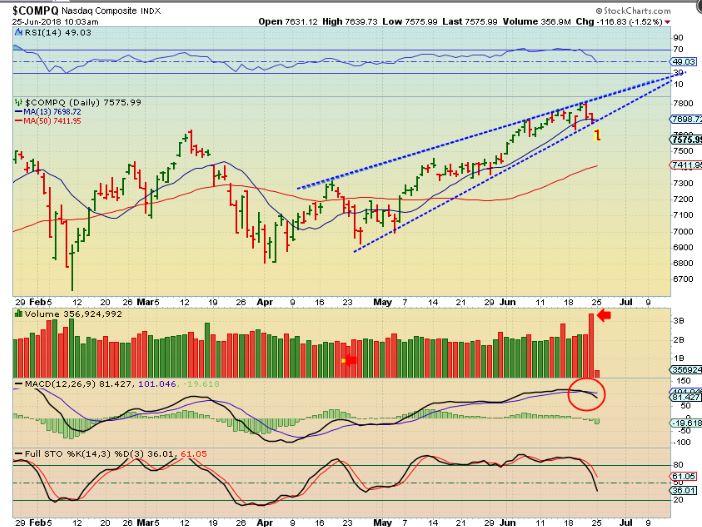
NASDAQ – If we are now heading down into an ICL drop, we should break the lower trend line. The drop could be similar to the rapid drop in January or March if this continues. Notice he stochastic now vs then too. IT IS POSSIBLE that we get a dcl first ( a low & a Bounce), and then the last daily cycle is Left Translated & heads to the trend line.
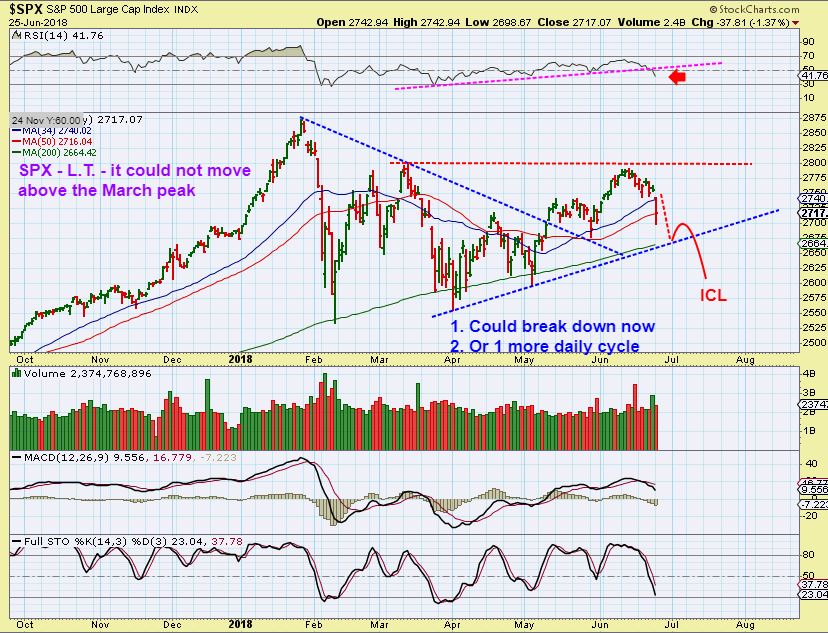
SPX – I had been mentioning in several reports that I wanted the SPX to break above the March highs, or the weakness would bother me. This is why. This has turned into a Left Translated Intermediate Cycle, and should drop to an ICL soon. Read #1 & #2 on the chart.
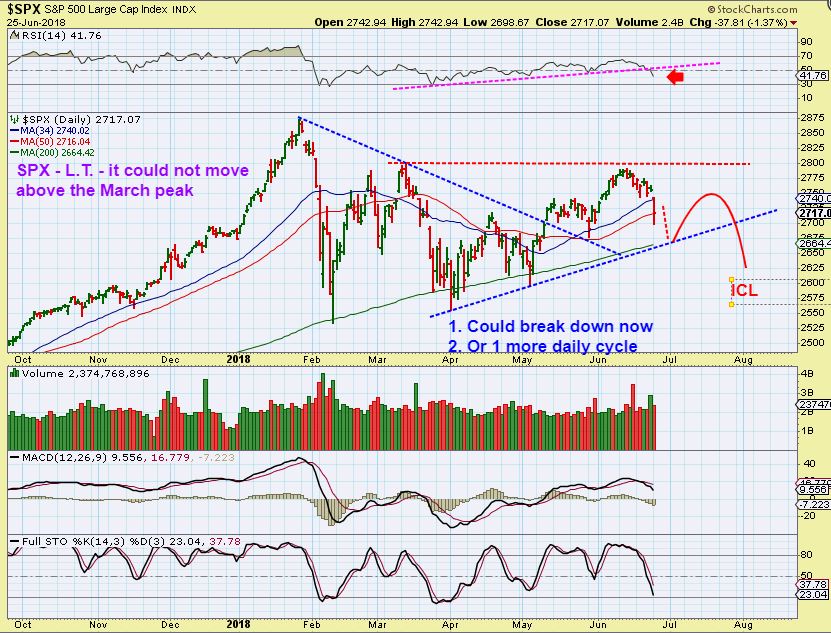
SPX #2 AS A VISUAL: This would roughly be the drop to a dcl, bounce in the last daily cycle, and drop to an ICL.
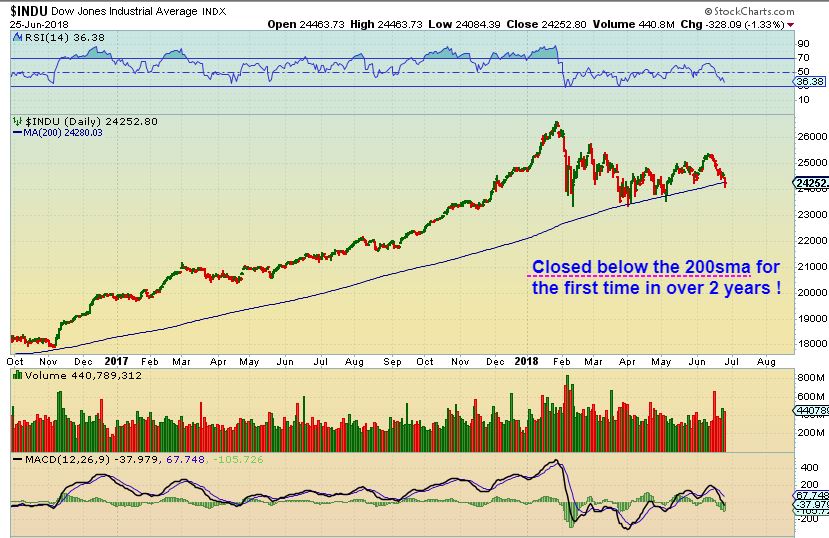
DJIA — FIRST TIME IN 2 YEARS.
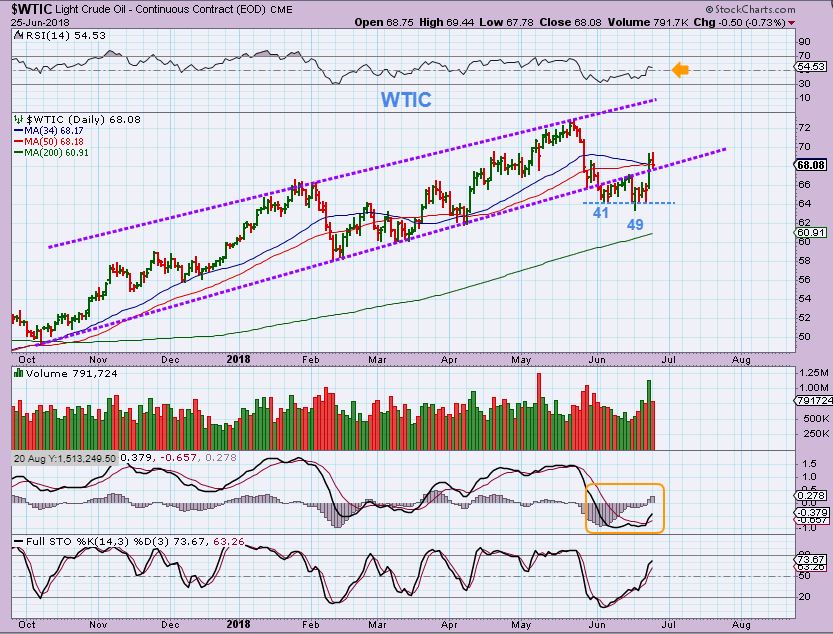
WTIC – Oil actually broke down and recovered, with what looks like a day 49 Low. This fits the criteria for an ICL better than the Feb drop did, so was day 49 an ICL? It is possible, but…
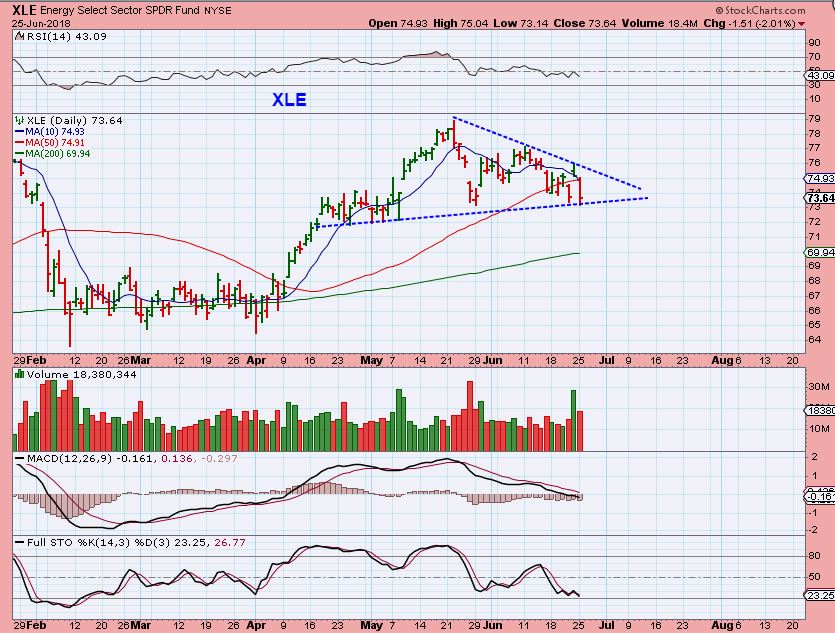
XLE – The XLE is still weak and did not follow OIL higher. That makes me wonder about Oil and whether it is doen selling off too. XLE has the look that it wants to drop further. OAS, WPX, and ERF dropped Monday. SO I am watching Oil & Energy for a bit more clarity, but…
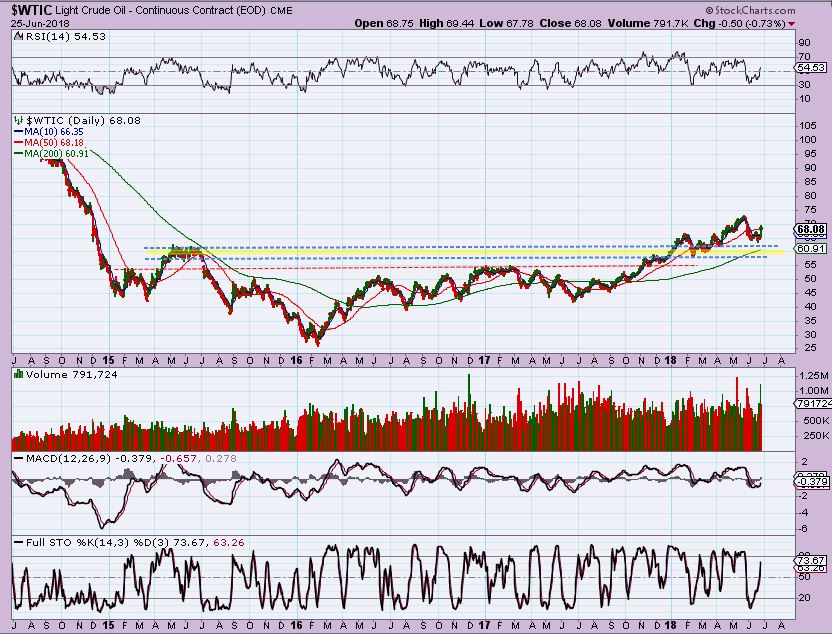
WTIC – This does still look like a very bullish break out and back test on the long term chart. So the long term Oil chart remains very bullish, there are bound to be bumps along the way.
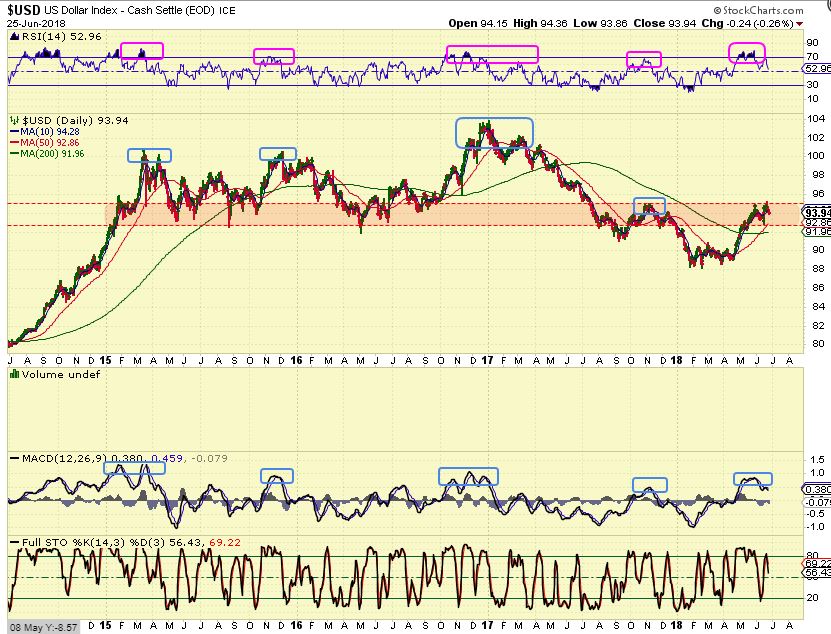
USD – This MACD shows weakness on the last push higher of the USD. This could be a short term double top. With a peak on day 5, this should be the expected L.T. Daily cycle forming.
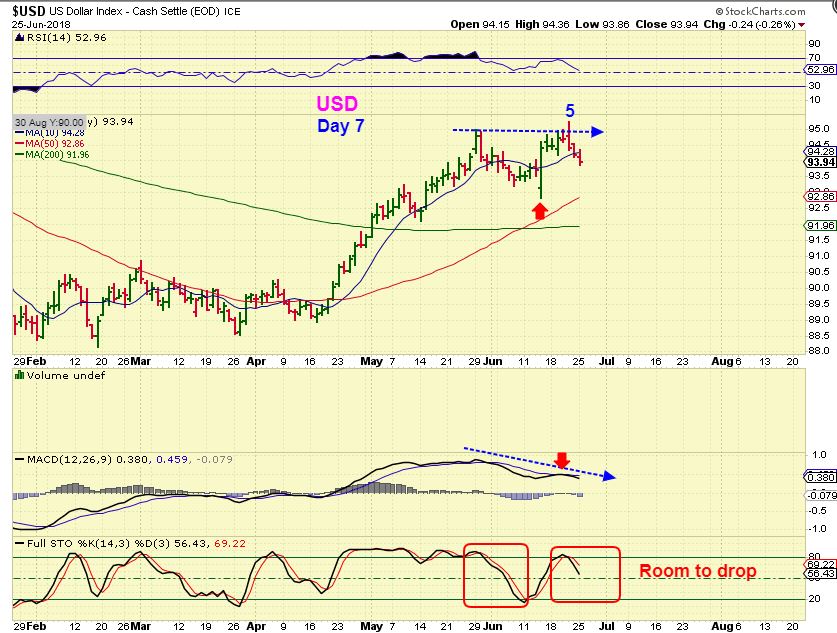
USD BIGGER PIC – The USD is pushing on resistance that topped it out at the end of last year. The good news? This is the same area where the USD topped when GOLD found its ICL in December. We are looking for the ICL in Gold now too.
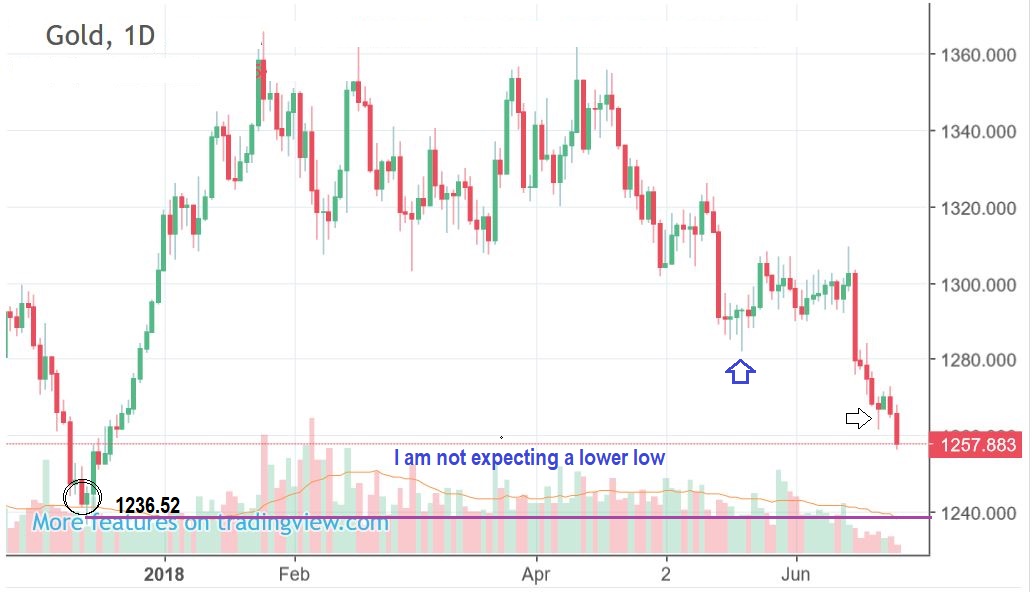
The weekend report highlighted that the weekly chart for Gold was a reversal candle. Now we need follow through higher, and preferably this week.
GOLD – So this would be day 2 if the $1262.40 lows hold. It would be day 24 if that day 22 low is not THE LOWS. The 10sma is currently at $1283.08 for a swing low above the 10sma.
EDIT: I awoke this morning to GOLD at new lows in the 1256 area , so far. This means that GOLD is on day 25 as of Tuesday, and still seeking out that ICL.
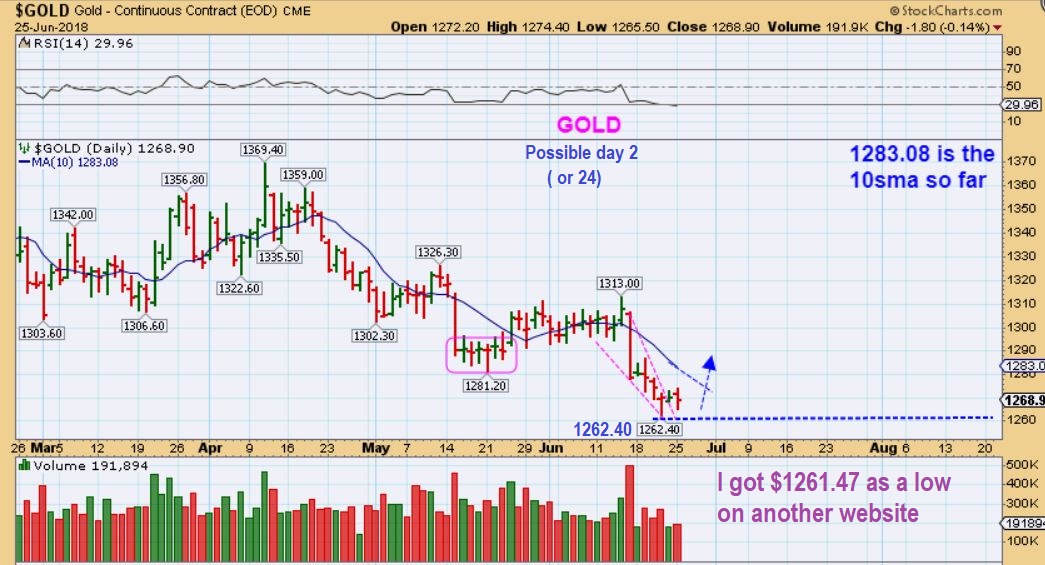
EDIT: So this is Gold as of 6:45 a.m. Eastern Time. On Day 25, this can bottom at any time, and it can drop into the day 30-33 area too. This is why we wait for a proper swing low.
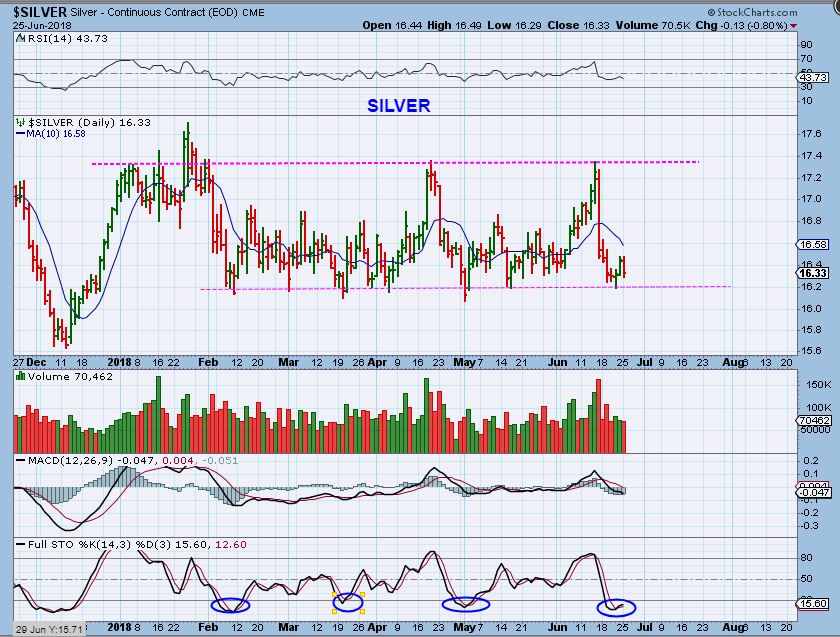
SILVER – Silver is back at the lows of its consolidation and is oversold here too.
GDX – Matching Golds low, GDX put in a reversal 2 days ago too. It is also oversold on the stochastics, and a little more upside follow through would get it above the 10sma again.
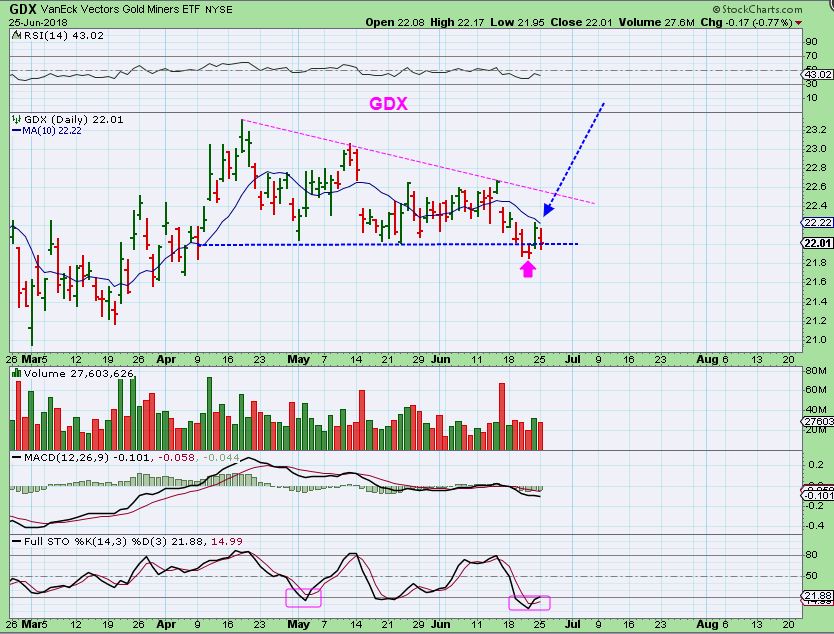
Again, with Gold, Silver & The Miners oversold, some miners have been leading the way and remain bullish. It is good to keep on pointing this out, because pull backs in these Miners would be good buying opportunities if they reach support.
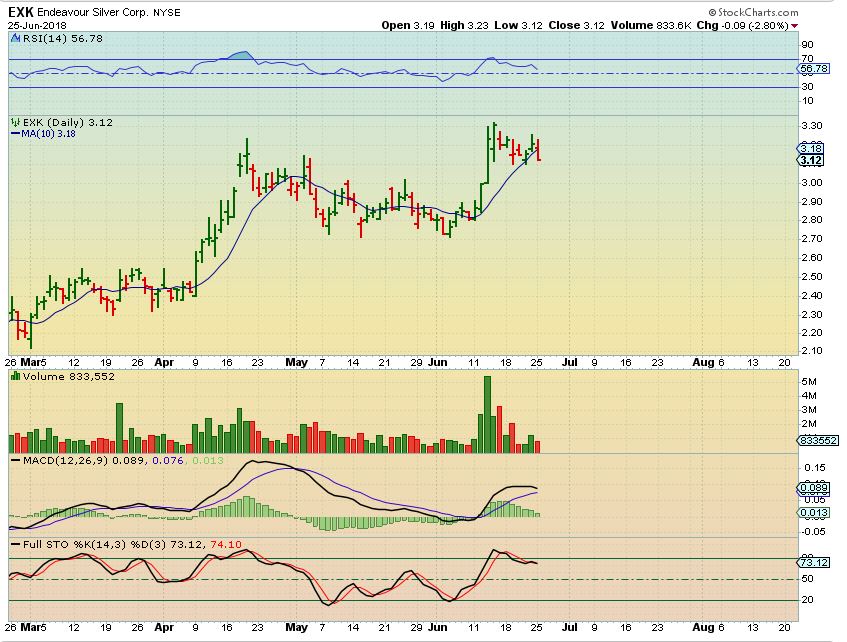
EXK – So EXK looks like it had a nice run in March & April, pulled back or sideways to consolidate gains, and then took off again. When GOLD & SILVER dropped toward their ICL, EXK simply formed a flag so far. Volume is drying up on the flags selling, but what if it drops further?…
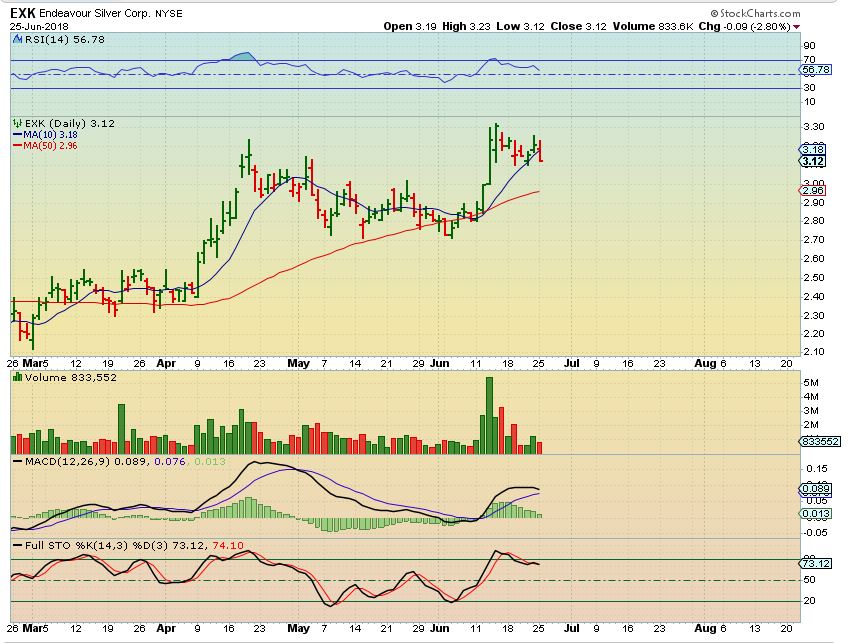
EXK – The 50sma may be a good place to look for a reversal & add.
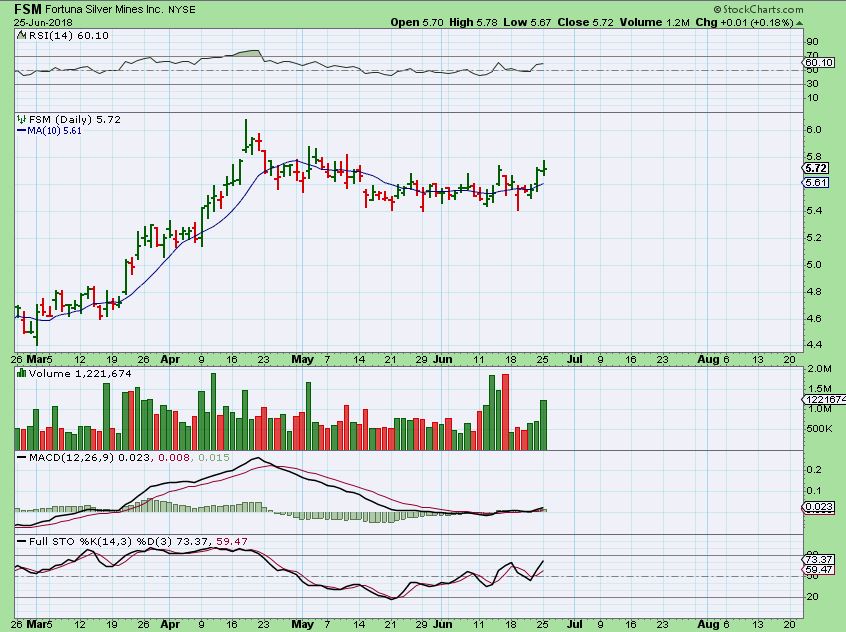
FSM – FSM was green (Barely) Monday, so again, some of the Miners are worth looking at daily to see if they offer an opportunity along the way.
So now we’ll need a little time to see how the selling in he General Markets plays out. We could get a dcl and rally, only to drop into the next ICL later, or we could be heading down there now. Time will tell on that one.
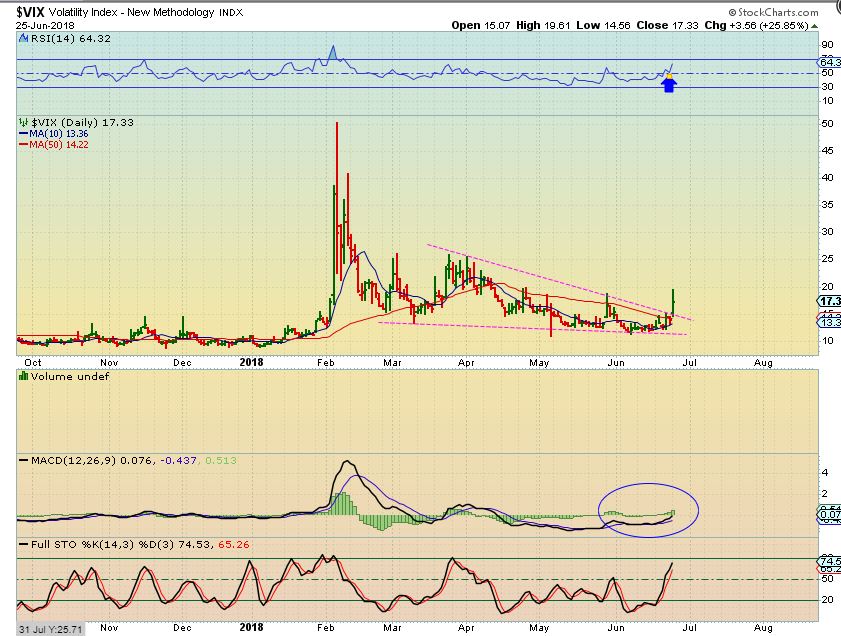
Do you remember me posting the chart of the VIX LAST WEEK along with that rising bearish wedge? This VIX looked like it could POP, since it already Popped & Back tested and the RSI was climbing….

VIX – The VIX popped and the chart is bullish. It does NOT have to stop here, so the markets can drop further as they seek out their ICL.
Today is a good example of why having cycle counts can be helpful.
1. We know that we are getting deep in the timing for an ICL, so using cycles, at least know that we are close.
2. We also know that Gold daily cycles can last into the 30’s,. Since we are on day 25 , we avoid going ‘All in’ before a proper swing low and entering too early in a daily cycle count.
3. For those not using cycles, todays drop would be very frustrating, especially because they wouldn’t know if the lows were really close or is Gold just going back below $1000.
So Using Cycles, at least we know how close the bottom really is, and each passing day brings Gold closer to that ICL. It can occur at any time this deep in the count, but again, it is always safer to wait for a proper confirmed swing low if you cannot take the heat on the downside.
For now, I am holding my positions, I still have cash to buy at the lows, and I’m watching to see how things play out this week.
.
Enjoy your Tuesday trading!
.
~ALEX

