Fed Wednesday-
What Can I Say, that hasn’t already been said? I was thinking about this FOMC WEDNESDAY Report, and basically we have covered it all, so What Else Can I Say? We have been through this FED DAY CHOPPINESS many times too, and so I got to thinking, “The weekend report was written with this FOMC Mtg in mind”. That’s when I decided to take the charts from the weekend report and add them here as a review, along with some newer updated charts. That way we can see what we expected then, and where we are now.
Honestly – expectations remain the same. Let’s take a look…
.
COPY/PASTE FROM THE WEEKEND REPORT:
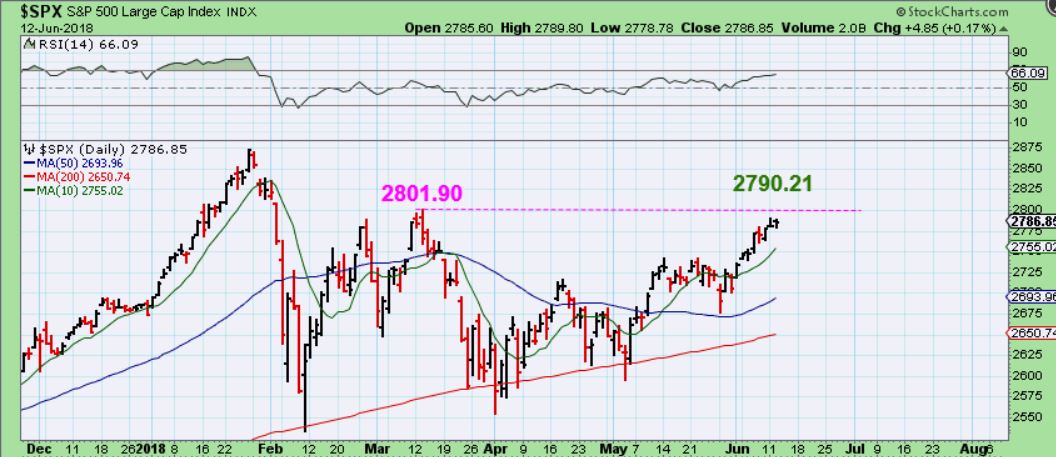
SPX – So far the break out, back test, and follow through higher is playing out. We really want to see 2801.90 taken out to prevent a L.T. Intermediate Cycle. That is only 22.87 higher from Fridays close.

.
UPDATE:
The SPX – Close, but not yet. We did not rise up over that 2801.90 to make me a bit more comfortable. Maybe we’ll get a FED SPIKE? That is only 11.69 points from Mondays highs.
OIL FROM THE WEEKEND REPORT:
.
WTIC DAILY June 1 – I was looking for an a-b-c drop on the daily dip for Oil
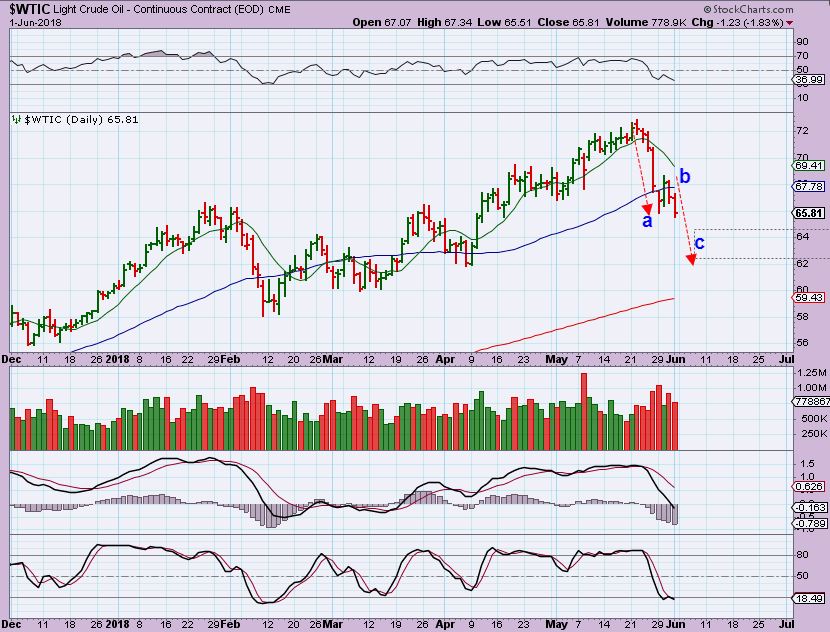
WTIC JUNE 5 – At this point, we did get an a-b-c type drop on the daily, and this was in the timing for a dcl (swing low).
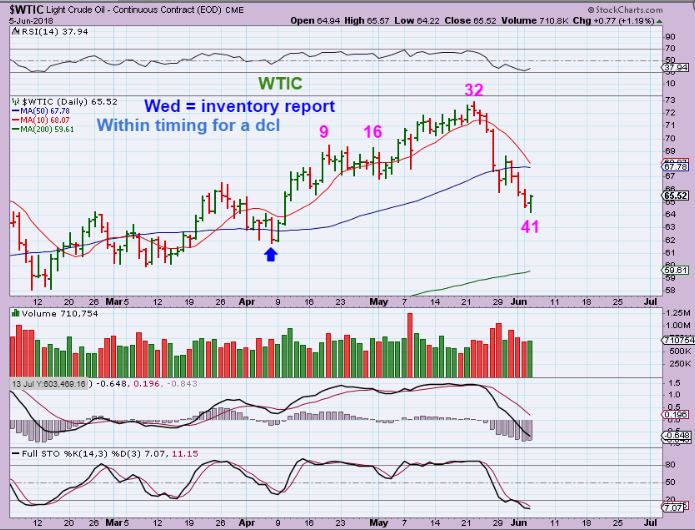
,
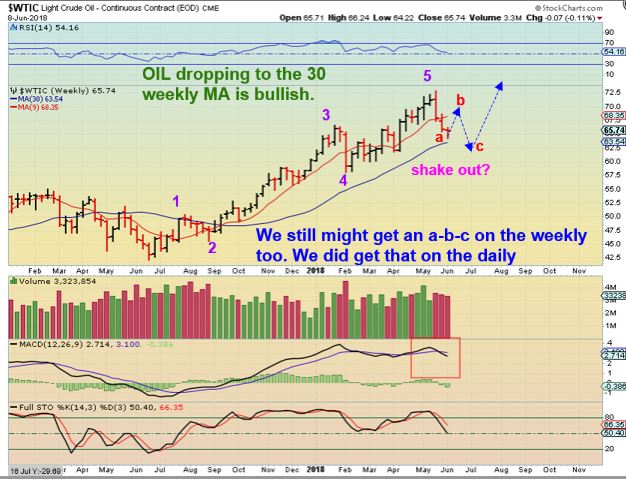
EDIT: I WONDERED THOUGH, COULD WE ALSO GET AN a-b-c DROP ON THE WEEKLY? THAT WOULD REQUIRE ANOTHER DROP LATER, SO I DREW THE FOLLOWING CHART.
WTIC WEEKLY– Could we get an a-b-c type bounce on the weekly too, after a bounce?
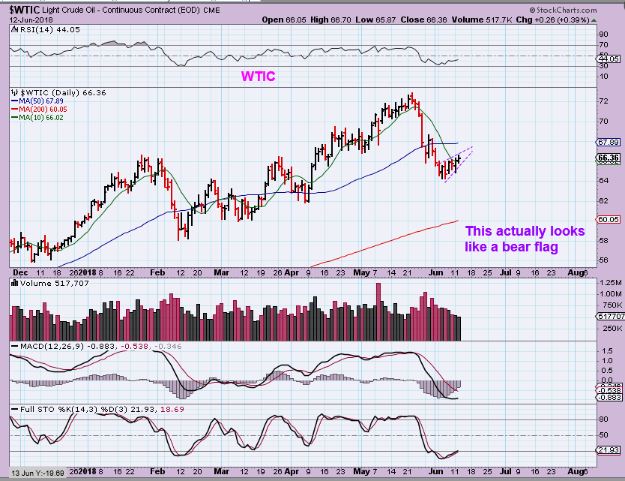
UPDATE: WTIC JUNE 12 / Currently – And right now, this actually looks like it could be a bear flag. Wednesday is Oil Inventory , so we’ll see what happens here. We have a swing low above the 10sma, but it could become L.T. & after tagging the 50sma, we’d see one more drop to the 200sma. Oil still needs watching.
FROM THE WEEKEND REPORT:
GOOD NEWS & BAD NEWS?
.
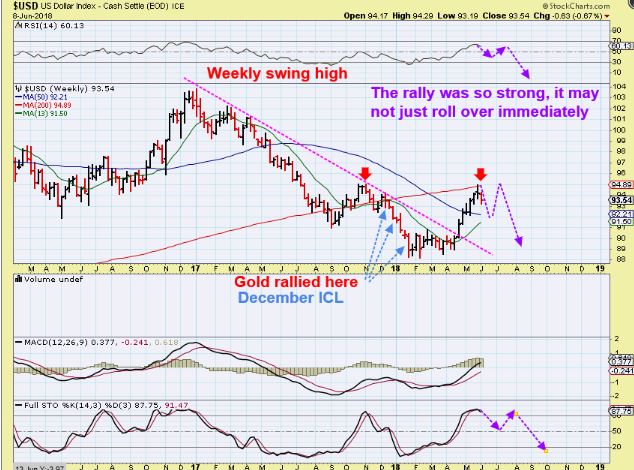
USD WEEKLY #1 – The USD formed a weekly swing high and was rejected at the 200 weekly MA. That is the good news, since we are expecting an ICL in Gold. THAT 200ma could be what Tops the USD.
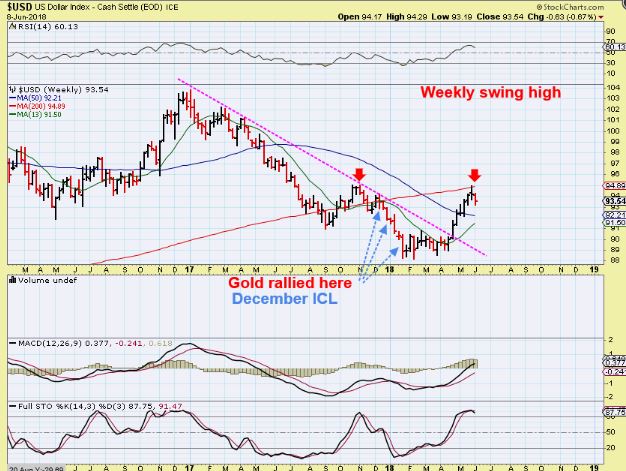
USD WEEKLY #2 – That was a strong rally & right translated, so I would expect a pretty good bounce after the drop & the dcl is in place. That dcl is due now. Is that short term Bad News for Gold? MAYBE, MAYBE NOT. A bounce in the Dollar, as shown, could be ignored by Gold too. We’ll see.
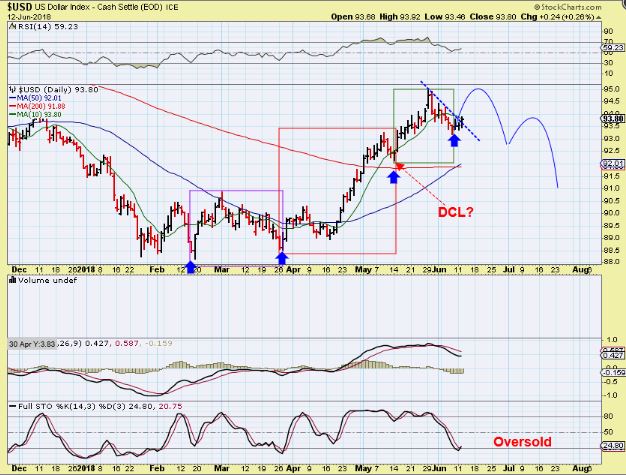
UPDATE OF THE USD: JUNE 12 –
1. A low has formed this week as expected, and
2. the USD is oversold.
3. The last daily cycle was very right translated, so I just have to say this: The USD looks short term bullish heading into the FOMC MTG today. This dollar does look like it wants to at least bounce strongly back toward recent highs. Can GOLD ignore that? Possibly.
.
GOOD NEWS & BAD NEWS?
.
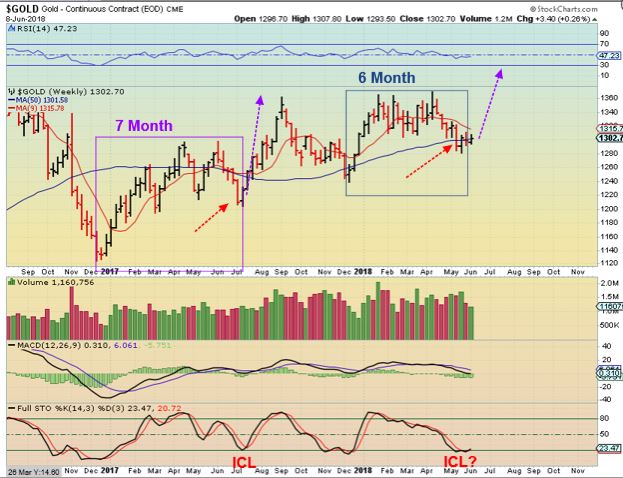
HERE IS OUR GOLD ICL OVERVIEW AGAIN – The Good news? We are currently WITHIN THE NORMAL TIMING FOR AN ICL. The Bad news? The timing can be NOW – or – JULY. Let’s discuss this further…
.
This shows ICLs arriving “roughly’ every 6 months. WE ARE DUE! They can be 5 months apart, they have been 7 months apart on occasion. See the chart below and then one after it…
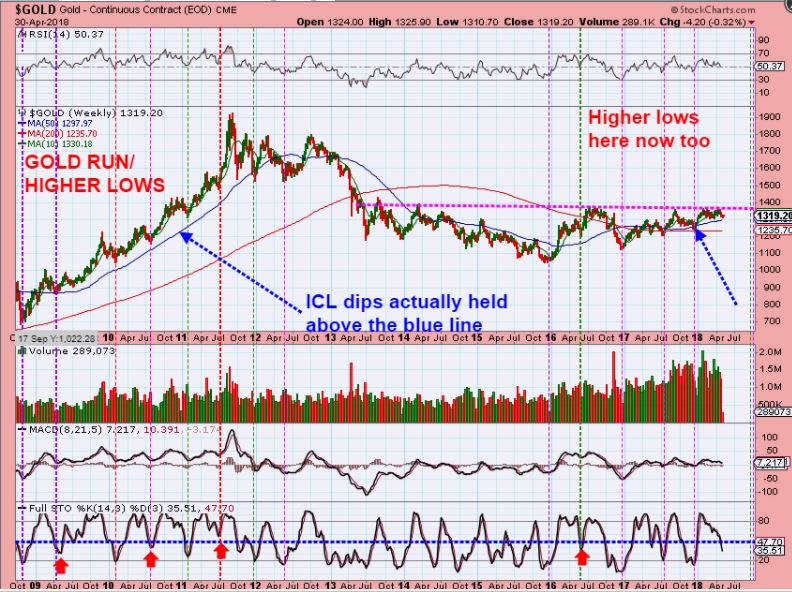
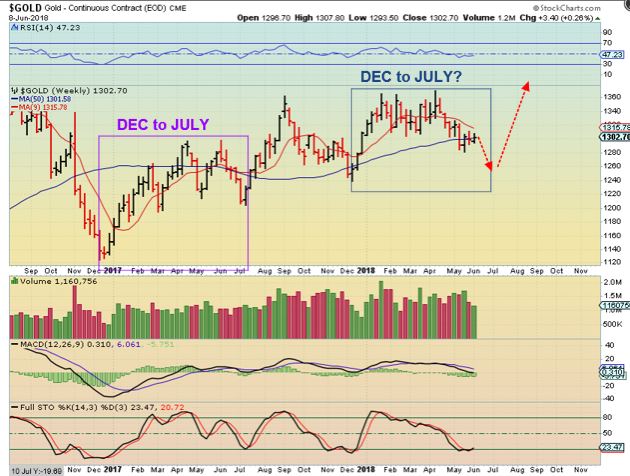
LAST YEAR, we saw a the DEC 2016 ICL and a JULY 2017 ICL, that is 7 months apart. Now we have a DEC 2017 ICL, so will the next one be 6 months ( now) or 7 months again ( July)?
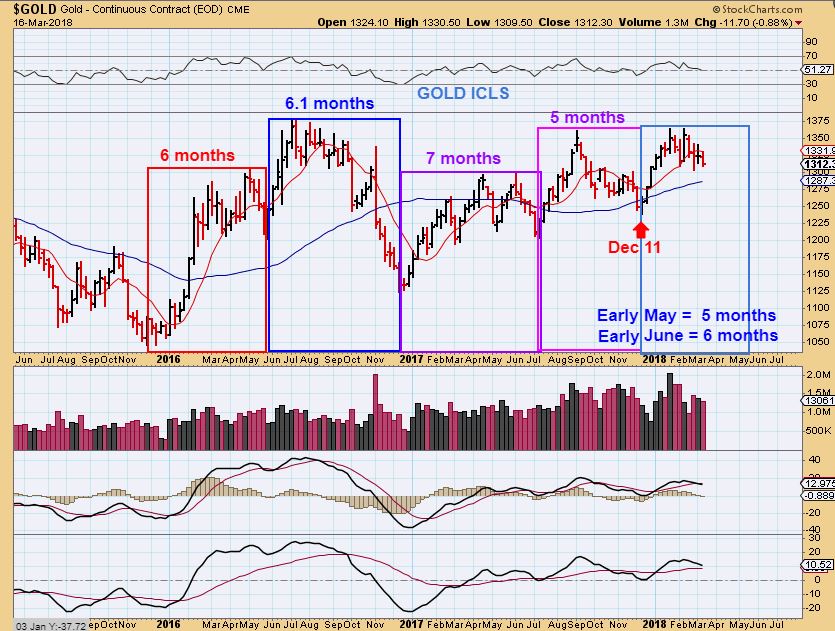
GOLD ICLS- I have been posting this chart since March to highlight & continually remind us of that average length of time from ICL To ICL, so that we do not get lulled to sleep. June is 6 months, July would be 7. Again, we had 7 months DEC to JULY in 2017, will that repeat?
.
MORE REVIEW…
.
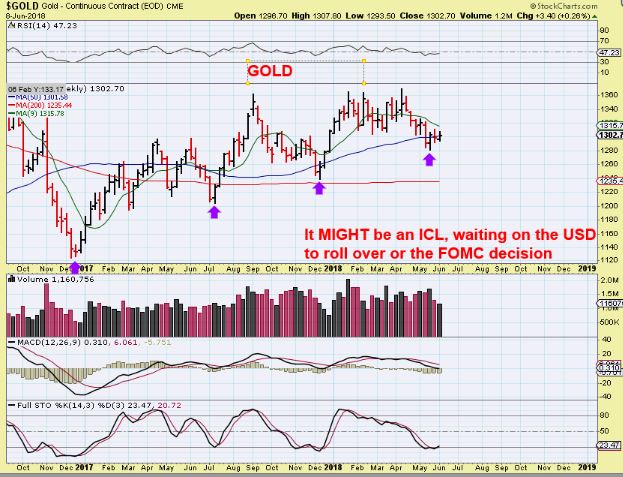
GOLD MAY HAVE AN ICL ALREADY IN PLACE AT 6 MONTHS. Look at the stochastics, it is oversold enough that we may be set to launch at the FOMC. This is a weekly chart, so FED WEEK may make a difference directionally.
OR GOLD MAY HAVE AN ICL AT 7 MONTHS. We can’t dismiss another drop, since we saw that 7 month ICL to ICL last year, but we must remain alert and vigilant now too.
.
This is still COPY/PASTED FROM THE WEEKEND REPORT, AND IS STILL VALID. It will be followed by updated charts.
.
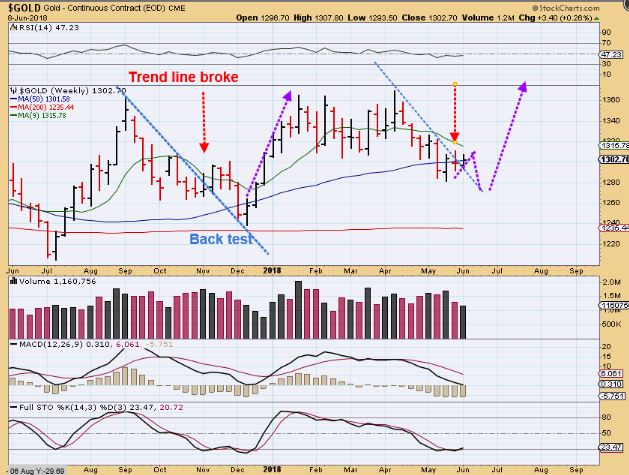
GOLD #1 – So this is Gold currently
GOLD #2 – 1 more drop Post Fed is not out of the question, and is acceptable time-wise. I STILL EXPECT A HIGHER ICL (LOW).
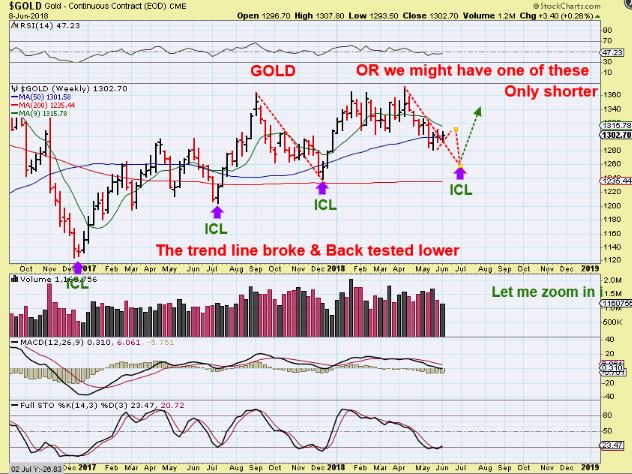
GOLD #3 – This is a close up of one more quick drop sooner than later, like after the FOMC MTG, if that was a bear flag.
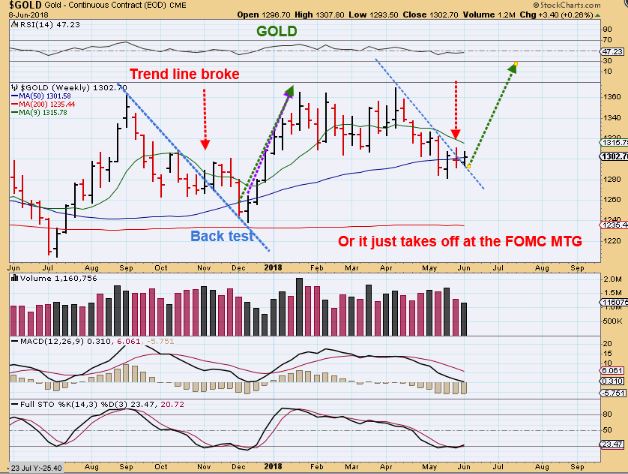
GOLD #4 – Or If that was an ICL & it just takes off from here. Let’s be ready for ANYTHING.
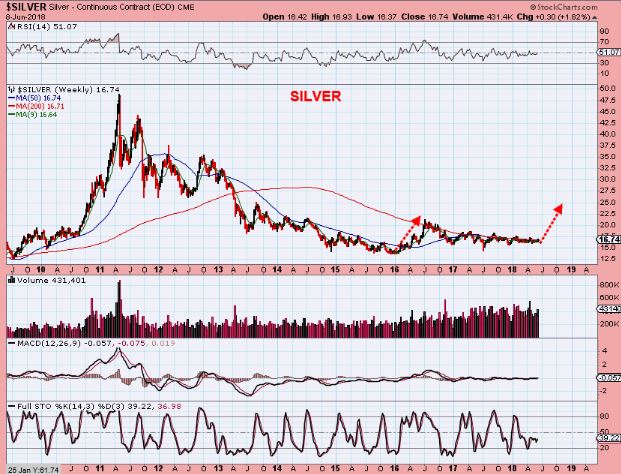
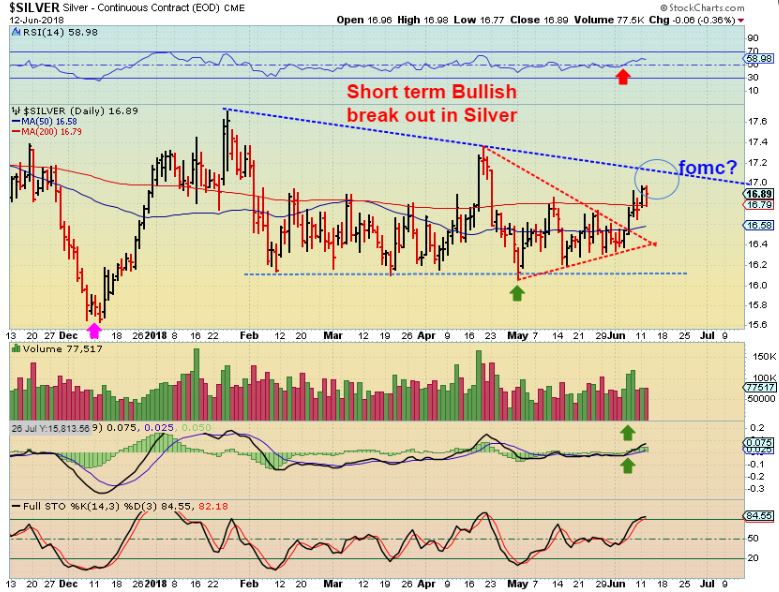
SILVER – Big potential in Silver in this incredible base.
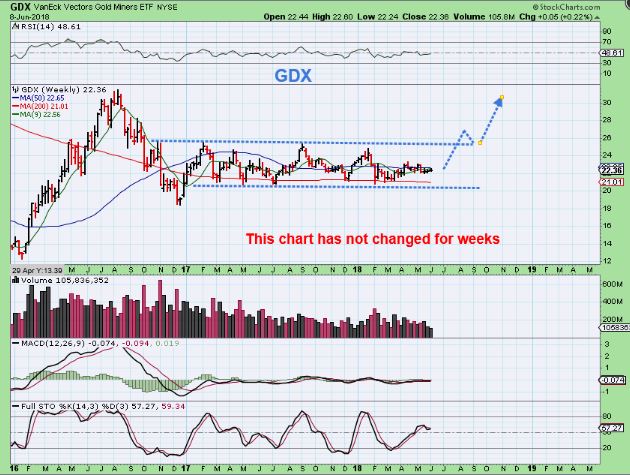
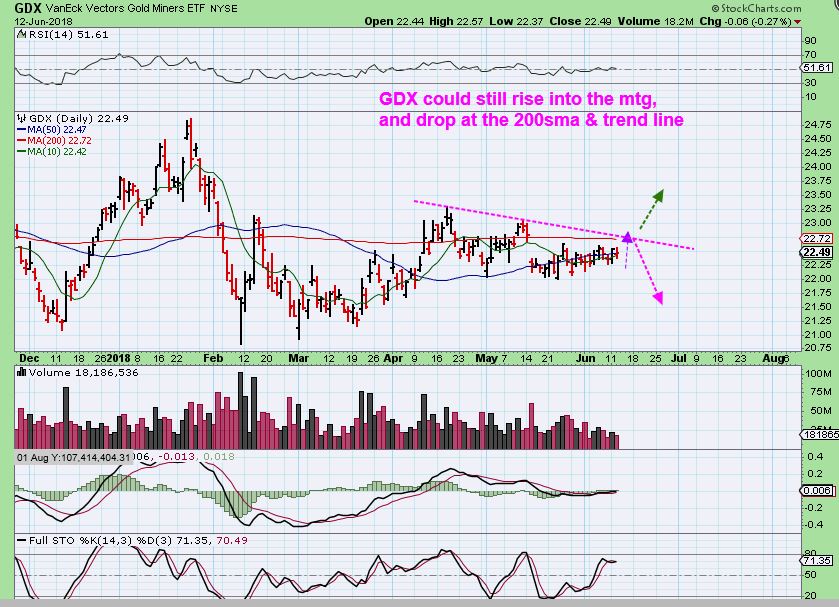
GDX #1 – So you can see that this does have room to drop a bit before a rally.

GDX #2 – Or it can also just launch from here on FOMC WEEK.
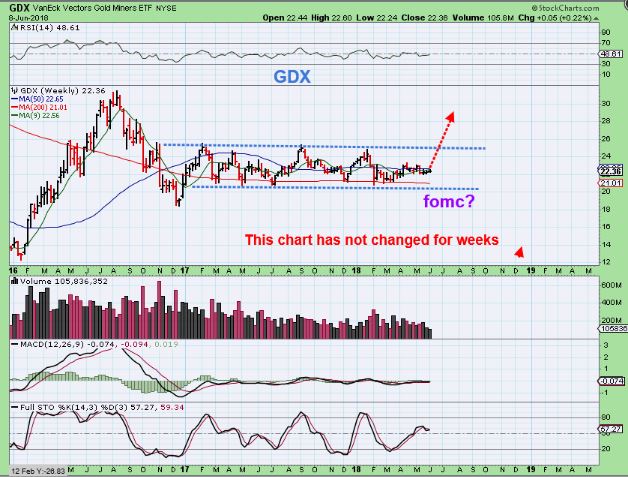
GDX #3 – Then a break out, DCL back test, and rally would be exceptional.
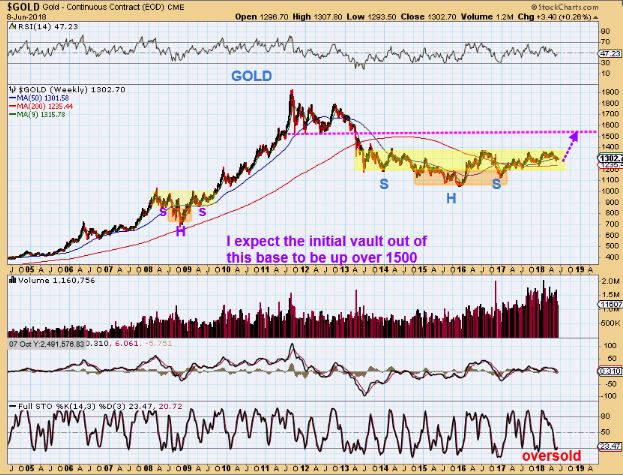
GOLD BIG PICTURE – This is so encouraging to me. This is also why we cannot take our eyes of Gold or lose focus, even though day after day after day Gold does ‘Nothing’ important and seems boring. This can run to $1500+ quickly.
.
Weekend conclusion: Next week we will see if anything important happens before, during, or after the FOMC Mtg. We may see false sell offs at the Fed Decision and then a rally, or we may just start to rally Tuesday and Wednesday and never look back if the ICL is in place. Let’s just continue to be ready to jump in when that time comes along!
.
UPDATED CHARTS FOR GOLD, SILVER, & MINERS
.
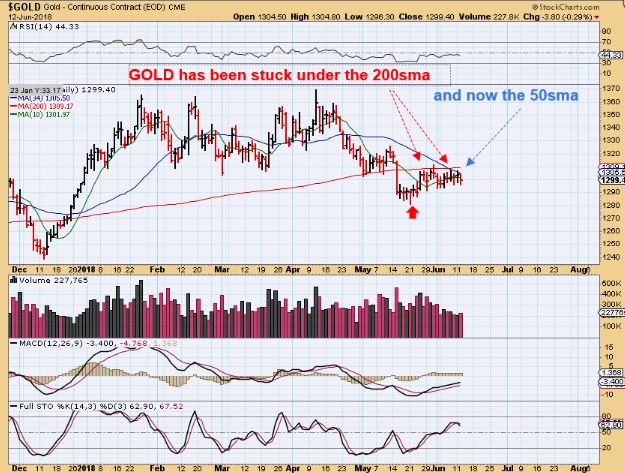
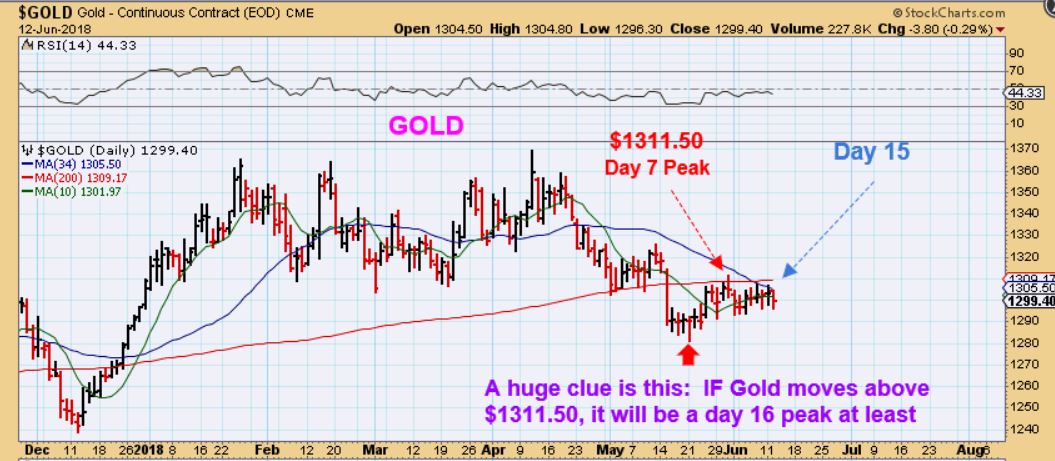
GOLD – I just noticed that I was using the 34 sma ( not the 50sma) for the MJ stocks and forgot to change it last night. Regardless of that, look how GOLD has been trapped under the 200sma and now the 34 has met price. It has been held down, so a break higher today would be encouraging…
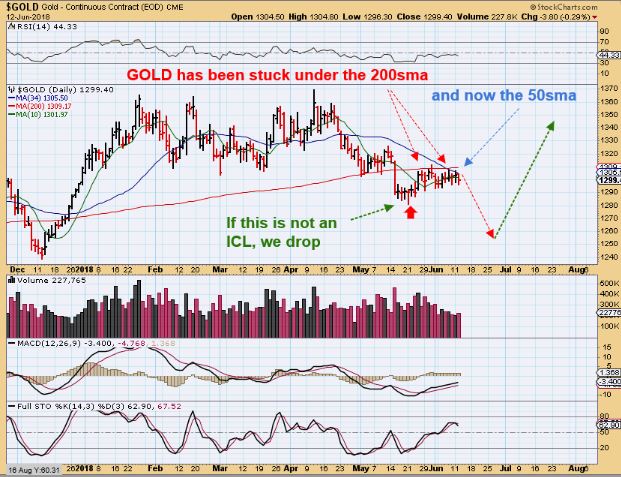
GOLD – Yes, this can drop from here into a future ICL and the USD does looks bullish heading into FED WED. A drop to a future ICL could look like this.
GOLD – I have also discussed that the 2015 ICL went sideways for 18 days and then ran higher, fooling most and leaving many behind. That said, I want to be aware of that in the back of my mind, just in case we pop higher here. READ THIS CHART, $1311.50 is key for me.
SILVER actually had a short term break out from a triangle formation.
.
GDX – If this drops, it will soon lead to a major buying opportunity, because ‘time’ is running out. If it breaks out higher & runs, it is a major buying opportunity starting at that point.
That covers just about everything, and now today is the FOMC Meeting. There is a 95% chance that they do raise rates and EVERYONE KNOWS THAT, so any over reaction is ridiculous, but I’m sure that we’ll see some odd moves. We may have false rallies that sell off, or drops that reverse higher in the last 1/2 hr of the day, but I think our best clue will be: Do we make a new high in Miners or Gold for this current daily cycle? Moving higher than the day 7 peak in GOLD would be bullish in my opinion. To me that should indicate that the lows are in and this will be the first right translated daily cycle of an ICL, though it has gone sideways until now.
.
Enjoy your Wednesday Trading!
.
~ALEX
.
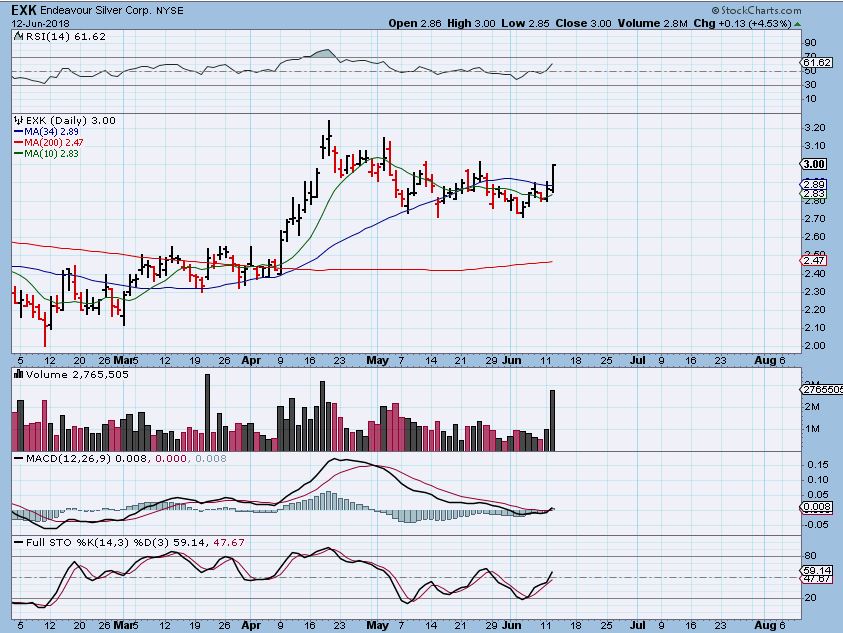
EXK MONDAY – I posted this bullish set up in EXK . I ended up buying it, and posted that in the comments section yesterday (next chart)…
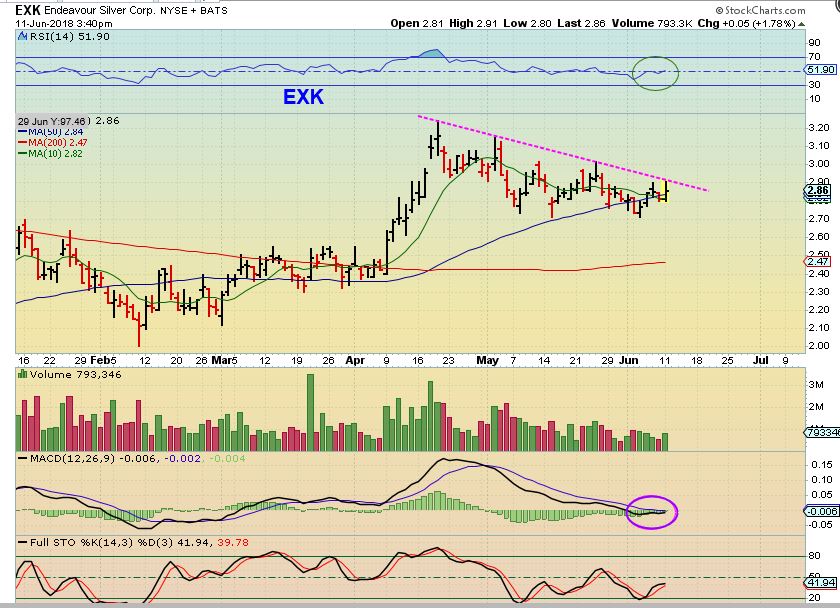
EXK TUESDAY – Yes, EXK could fail & roll over if the FOMC MTG drops Precious metals, but that was a bullish set up and it did close at the highs of the days, higher than where I entered the trade. I’ll use a stop, but it may only drop to the 200sma if it does drop.
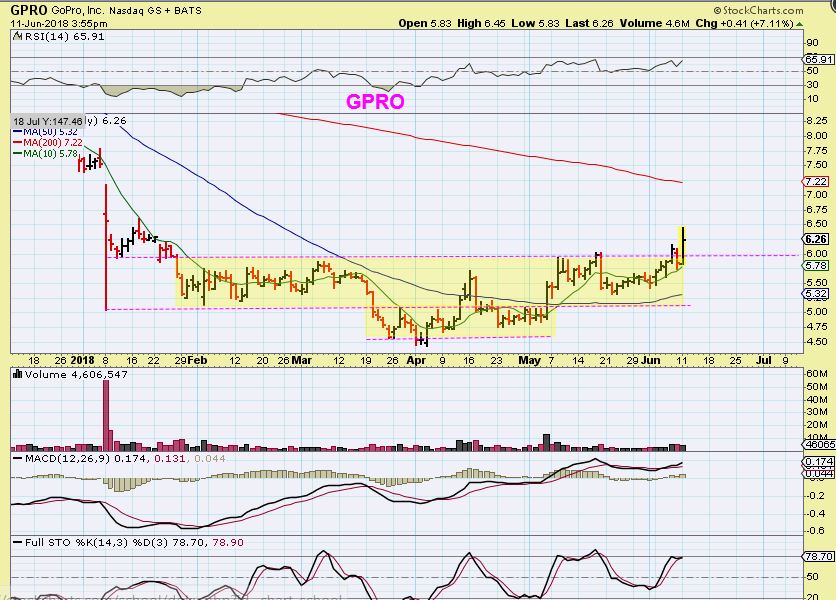
GPRO – When I posted this chart of GPRO breaking from a base, I had a short term target of the 200sma, and it did continue higher Tuesday. It could just break that 200sma & keep running like FIT BIT Has. I want to show you why…
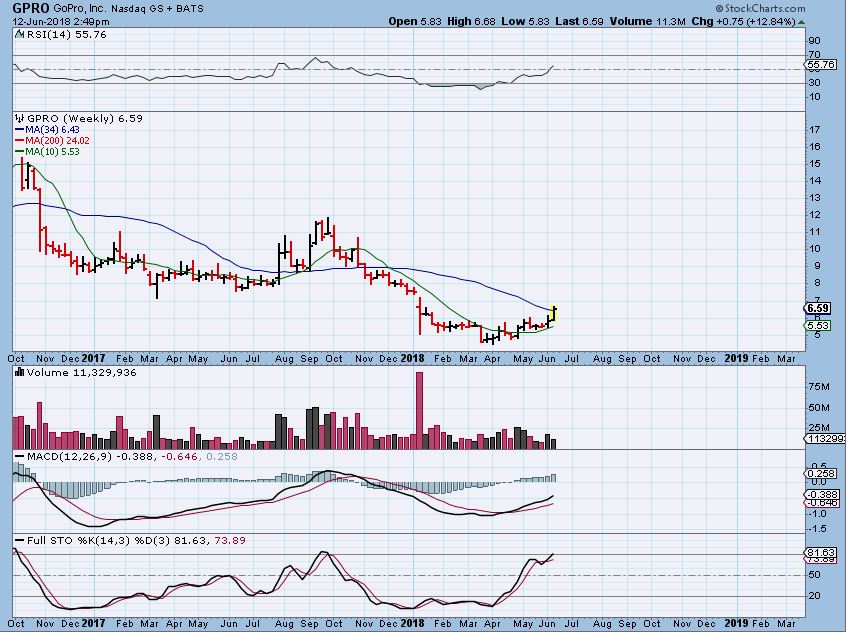
GPRO – The weekly chart is bullish and GPRO has plenty of upside potential over time.
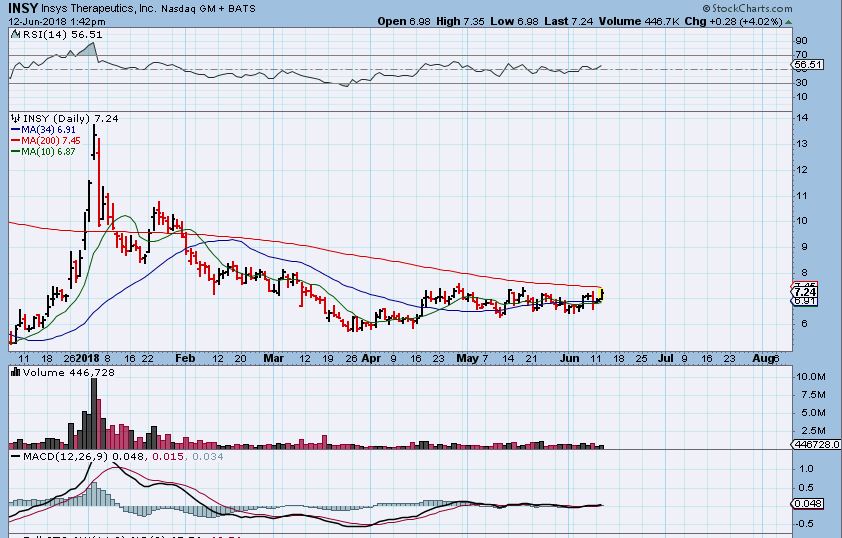
INSY – INSY has been moving sideways and forming a nice base. A break above the 200sma could start the fireworks. That would be a low risk entry with a stop right under the 200 or 50sma ( 34 sma is shown, but the 50 is actually in that same area).
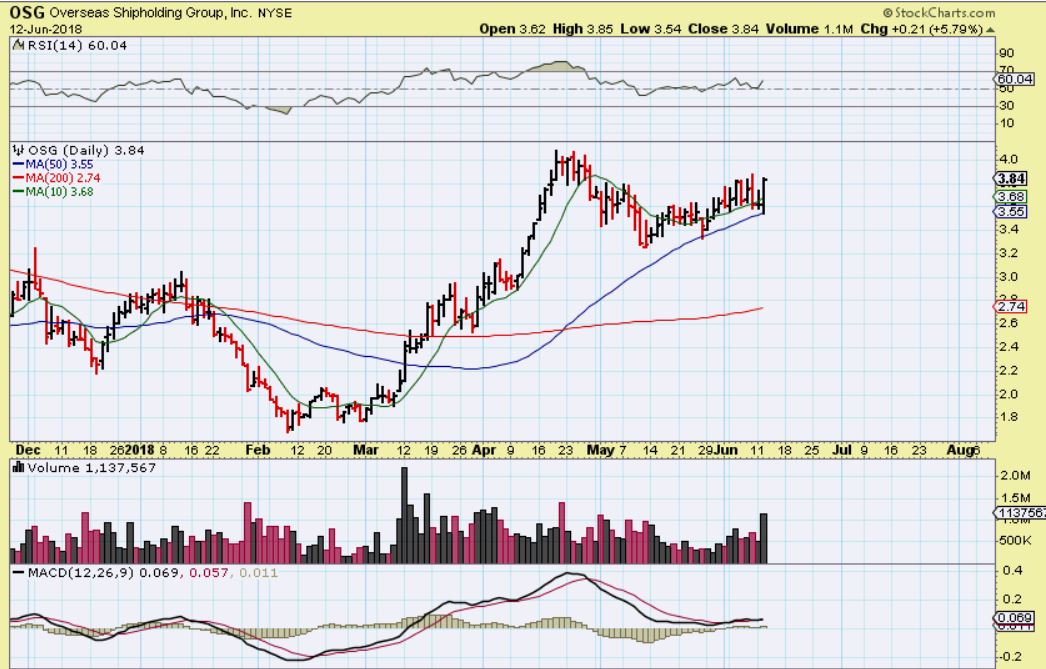
OSG – I’ve been pointing out OSG, and it started to move with strong volume off of the 50sma yesterday, so I posted this midday. It was up 3+%. It is still a but, but…
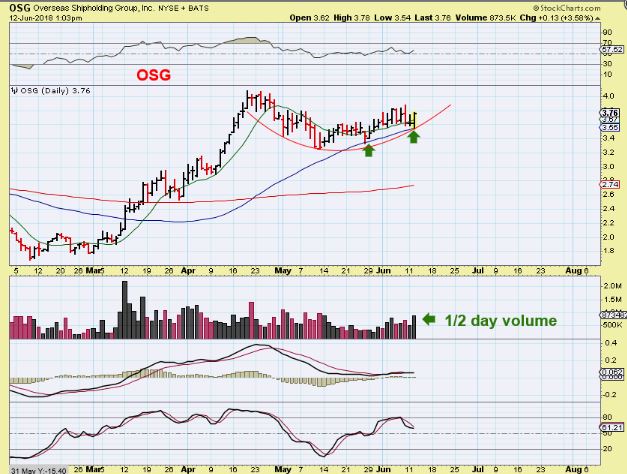
OSG – I get a feeling that it is preparing to take off. It closed up almost 6% and at the highs of the day, with strong volume. I own it & added, stop at the 50sma.