June 2nd Weekend View
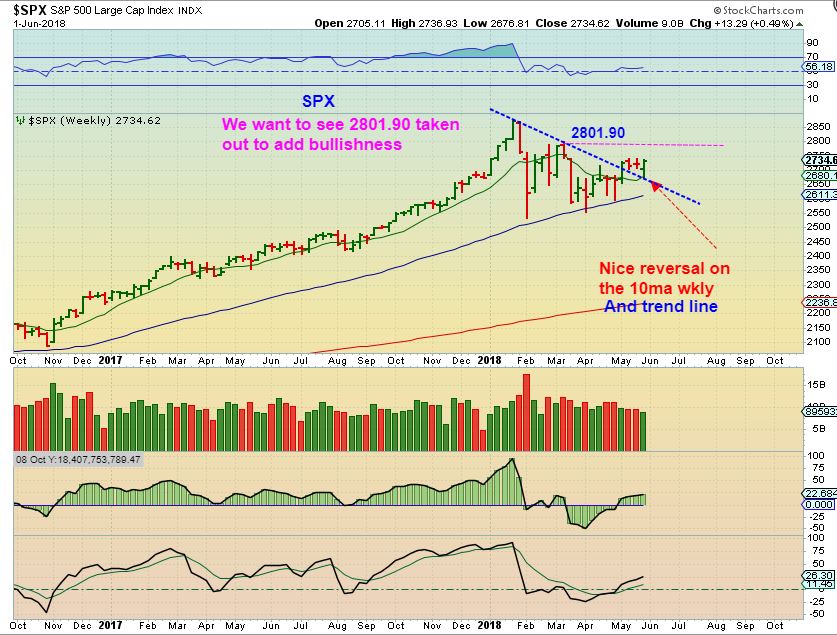
SPX WEEKLY – We now have our break out & back test complete. Fridays push higher in the markets gave us this reversal off of the 10 weekly MA, and technically that is a buy.
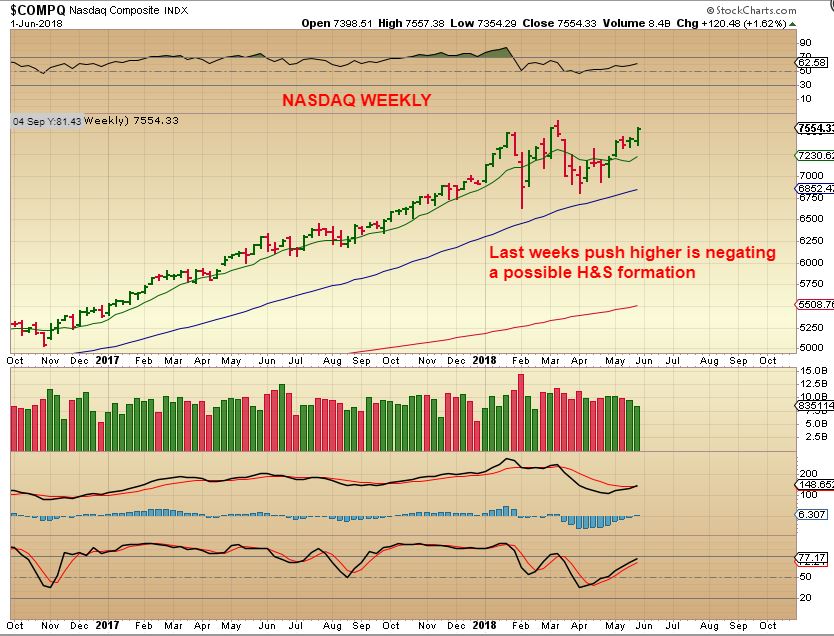
NASDAQ – See the chart, this too is Bullish with Fridays push higher closing the week at the highs.
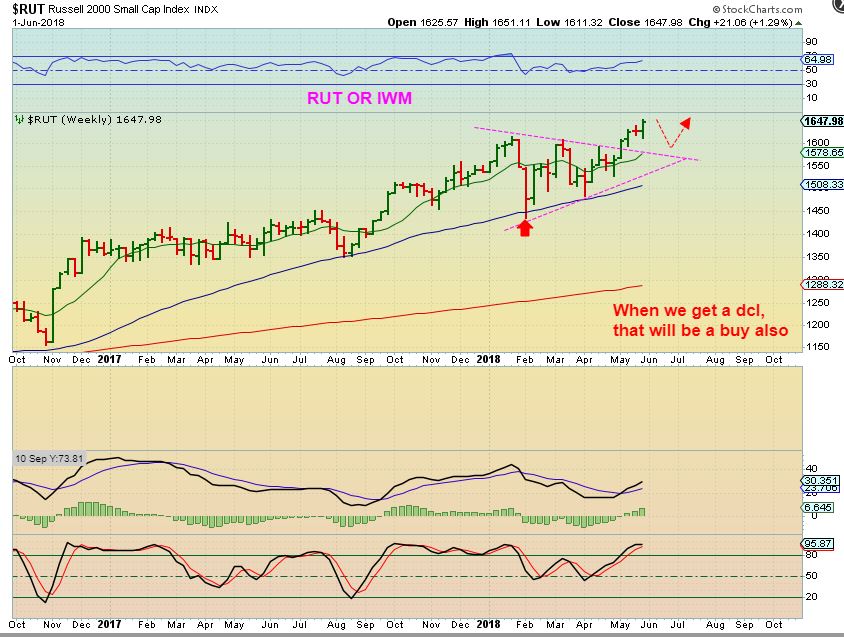
RUT ( or IWM) – The Russell 2000 small caps is moving bullishly higher out of this multi-month consolidation. Thae next daily cycle low should be a buy opportunity too.
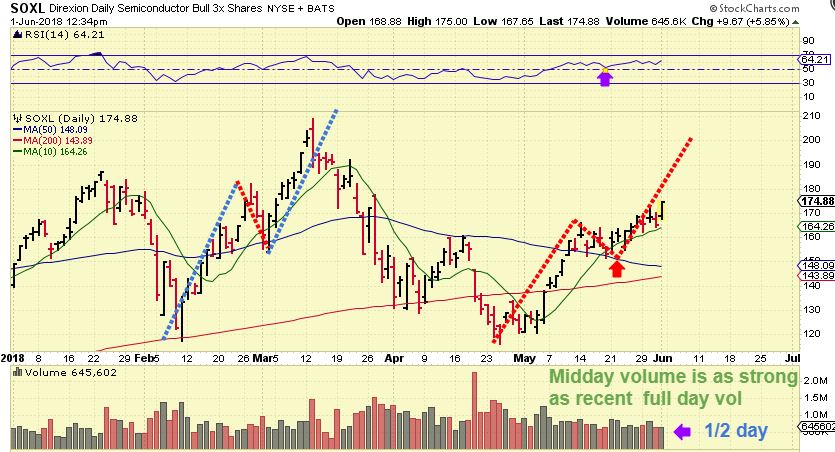
SOXL June 1st Midday – I posted this in the comments midday Friday. With Fridays reversal higher, I see bullish set ups. I will post some bullish set ups for Monday at the end of this report.
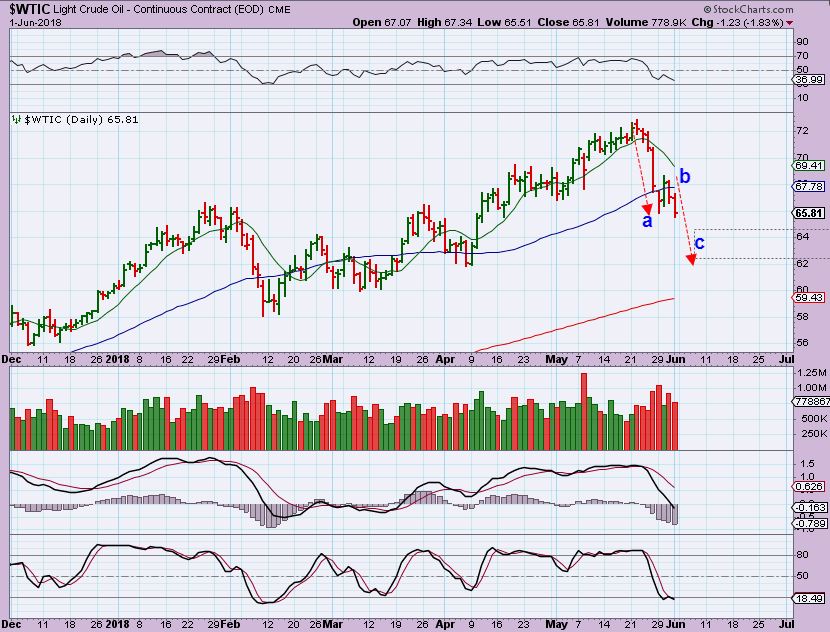
WTIC DAILY- I expected an a-b-c type drop, so I wasn’t fooled by the reversal on Wednesday. This is now oversold, so I dont know if the 2nd leg will equal the first as drawn, but that is what I expected, so I will watch this play out.
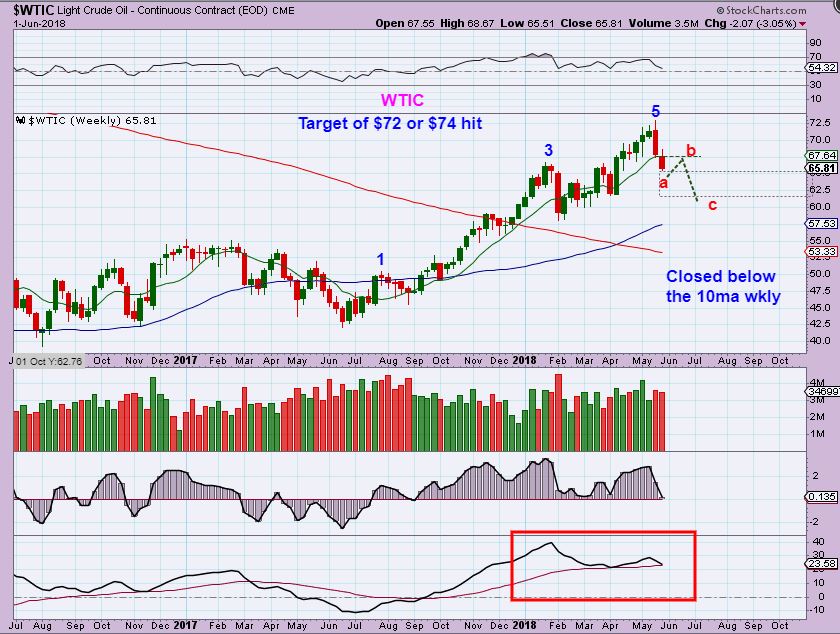
WTIC WEEKLY – A bigger a-b-c drop here may or may not play out in the weekly. I think that a reversal & bounce higher to back test the weekly 10ma could be the ‘b’, but if it does close above it, the next reversal may be the lows for now. So IF you buy the next reversal lows, this is what you could watch for and slowly raise stops. I will discuss this as it plays out.
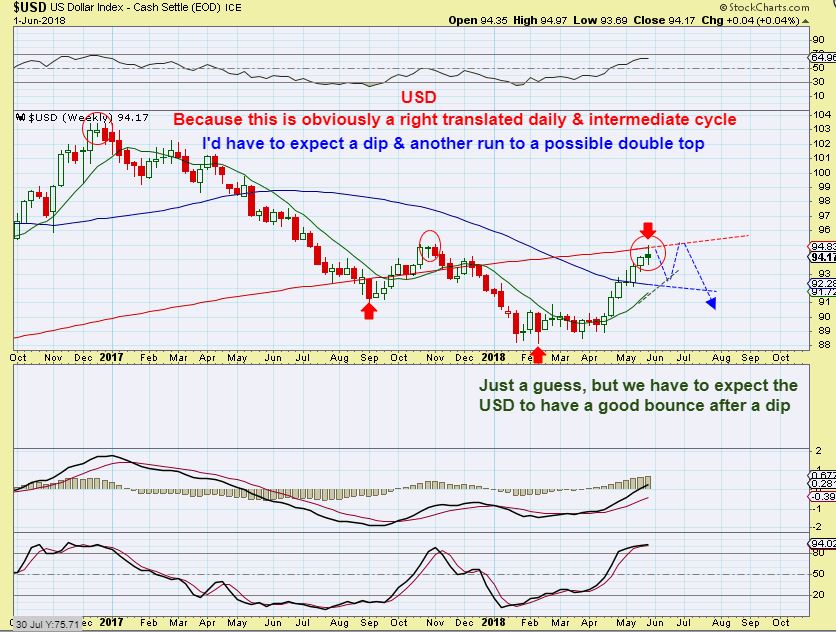
USD WEEKLY #1 – YAY! The daily chart had the Dollar break below the 10sma, and the weekly dollar stalled at resistance, however…
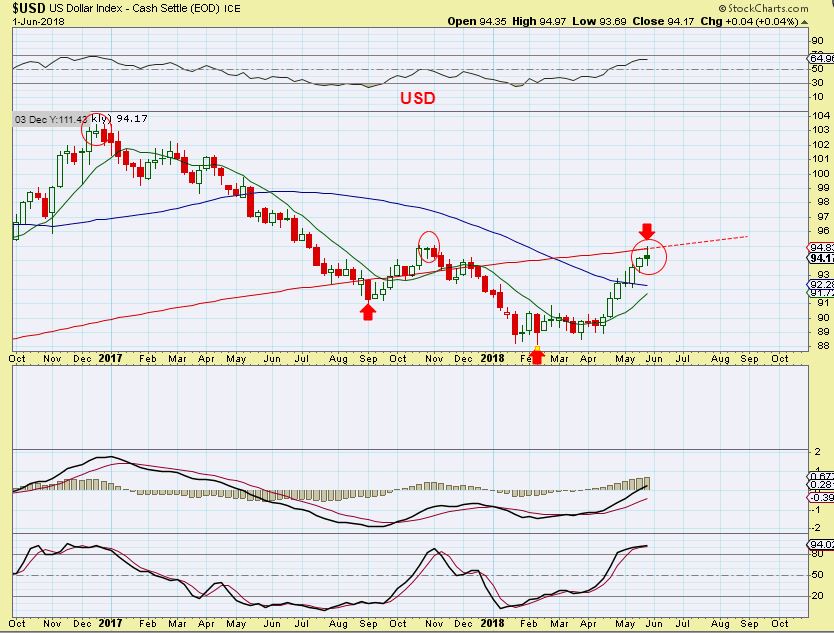
USD WEEKLY #2 – A dip should be followed by another run higher, since it was a R.T. Daily cycle. Read the chart. Gold could run higher as the USD dips, and pull back as the USD then bounces.
PRECIOUS METALS
GOLD COT – The COT for Gold was at ICL levels. 1. After a low is in place, Smart Money hedges or adds to short positions. 2. Open interest was high , now it is dropping to where I would expect it. It looks to me that that O.I. improved drastically after options expiration May 18th.
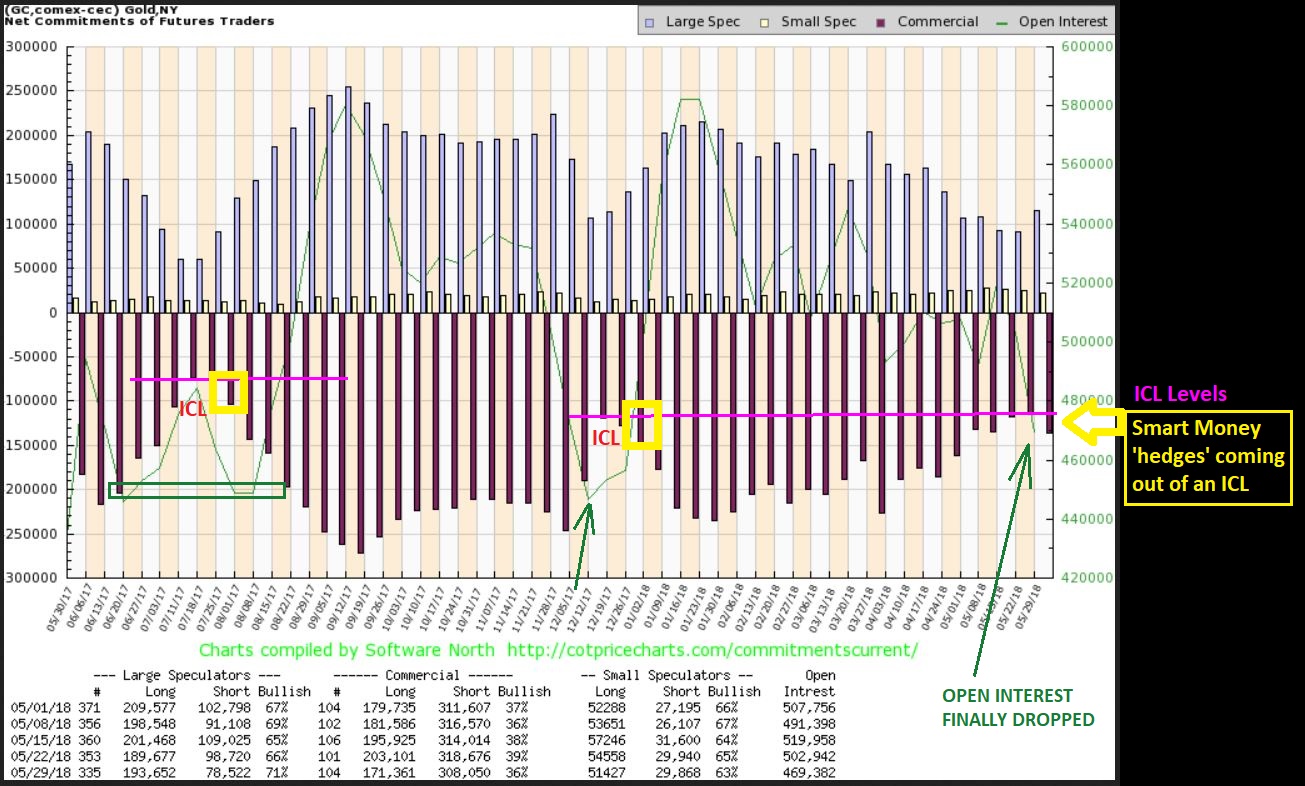
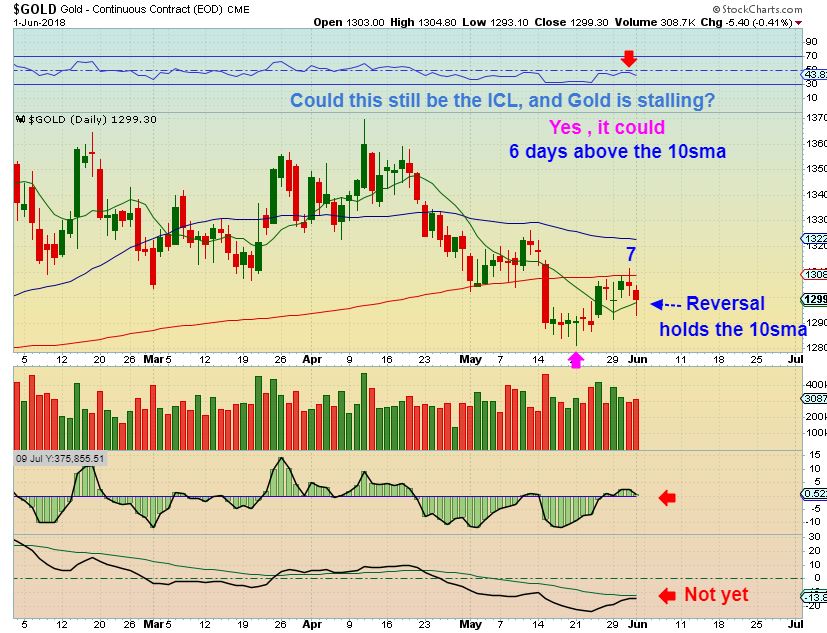
THE COT WAS AT ICL LEVELS, WAS THAT AN ICL IN GOLD?
GOLD #1 – Please read chart #1, and ‘Yes, it still could be’. SO IF THIS BREAKS DOWN, THE ICL IS AHEAD, maybe near the next FOMC.
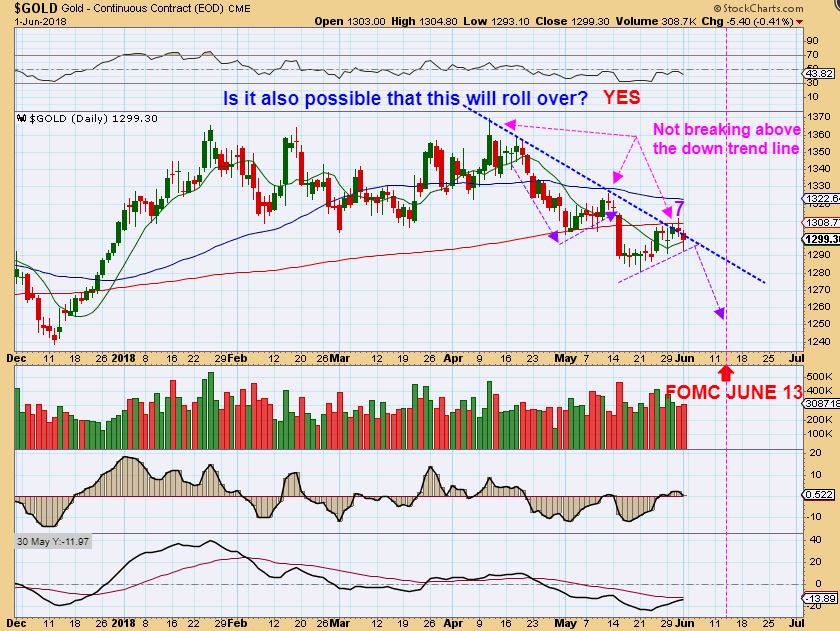
GOLD #2 – Please read the chart #2, ‘The trend line hasn’t been convincingly broken yet’. Drop to FOMC?
Let’s step back and just look at ‘Other Things’ pertaining to an ICL.
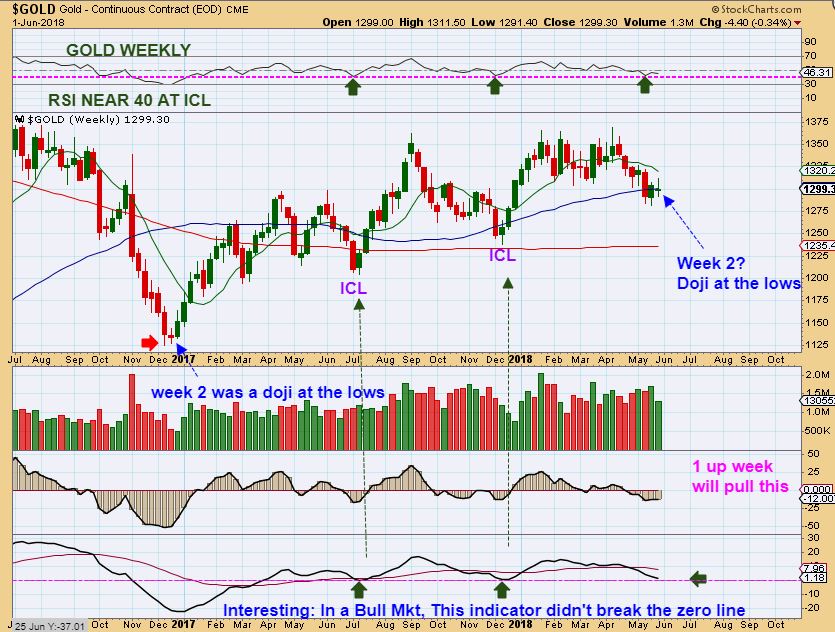
GOLD WEEKLY – I am going to point out Bullish facts here
1. The RSI is right where the last ICLs have had it
2. At the Dec 2016 ICL, the next week was not a burst higher, it stalled with a doji. We just did that here too. It burst higher the next week.
3. My lower indicator did NOT break the zero line at the past 2 ICLs.
4. The past 2 ICLs were higher lows in a new bull market, if you ask me, and many STILL do not think that GOLD is bullish. Look at these higher lows.
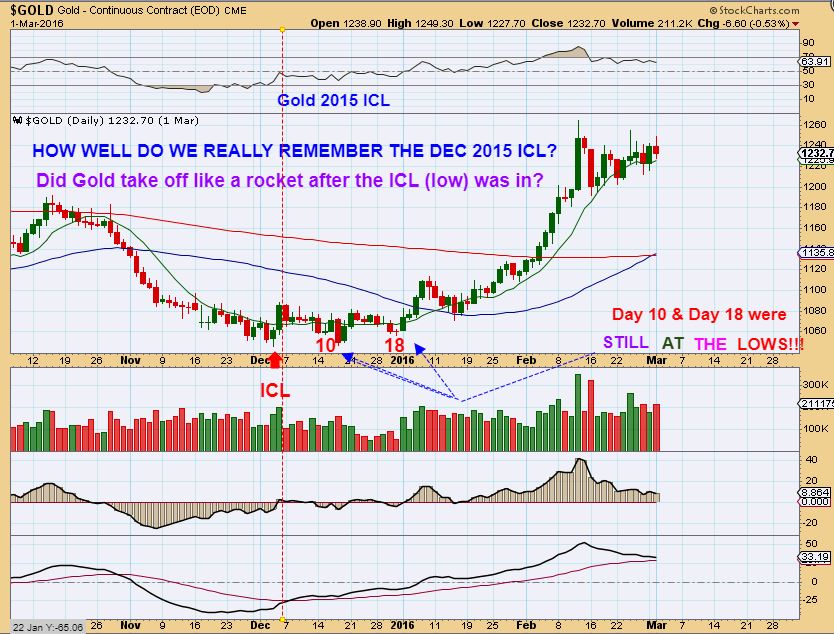
HERE IS SOMETHING THAT I THOUGHT YOU SHOULD SEE
GOLD 2015 ICL – Please read the chart. The ICL was early Dec, but 10 days and 18 days later, Price was STILL AT THE LOWS. Yes, 18 days later, still at the lows. Just because Gold is not a rocket ship higher right now, that does NOT mean that we can’t have an ICL behind us, just lulling us to sleep & complacency. Please study this chart to understand what I am pointing out.
SILVER WEEKLY- And Silver is just building energy to break higher, in my opinion. It is also boring people to death, and causing people to ‘hate this sector’ and move on. A drop from here would lose a lot of peoples desire to own Silver, a break higher from here would probably cause a flood of buying.
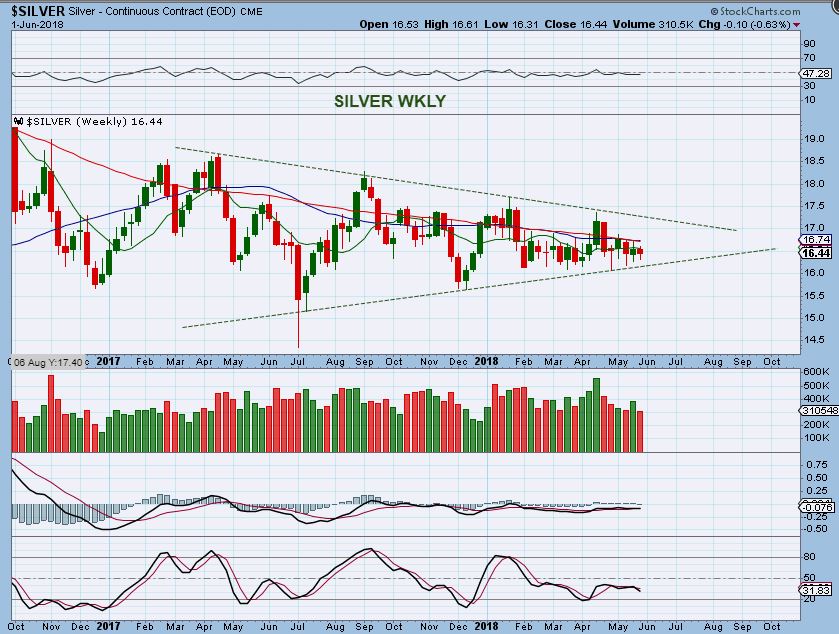
SILVER WEEKLY– Same chart but I want to point out 1 more thing, for those expecting that Silver MUST slam down to an ICL.
1. July ICL & Decembers ICL are higher lows.
2. An ICL right here inside of a triangle would not be visible to many.
3. I have always said that in my experience, triangles obscure cycle counts & set ups. The DEC ICL was a 2 week drop & done. We’ll see if we get a shake out or not.
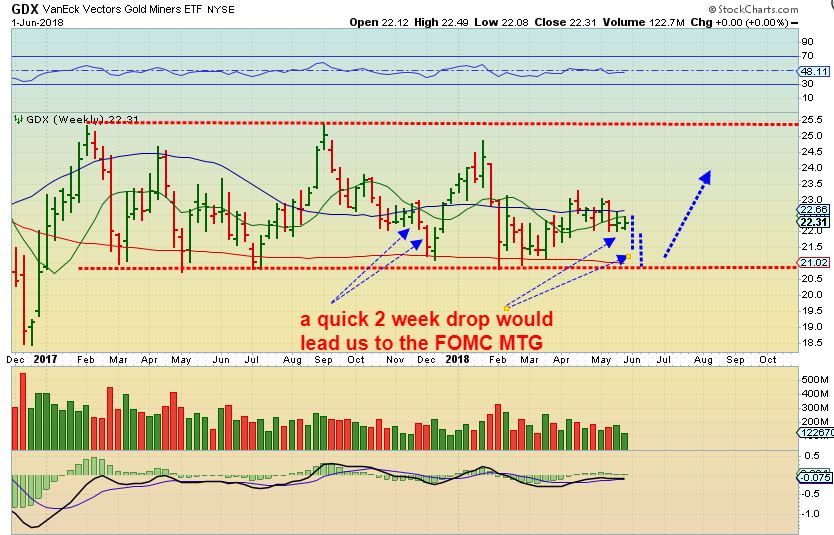
GDX WEEKLY #1- This is just plain ole odd. I would have expected a quick slam down to the lower trading range, but so far we have gone sideways with Golds drop.
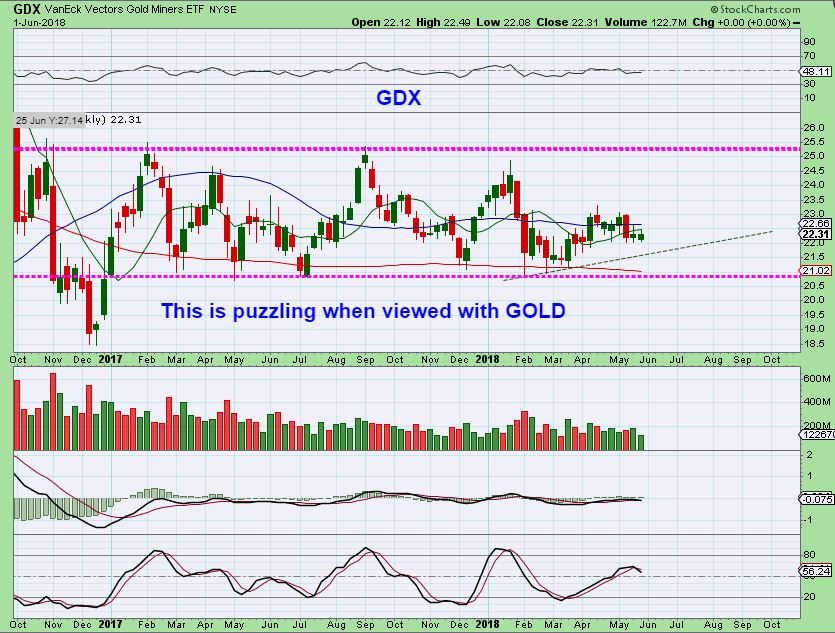
GDX WEEKLY #2- Do we just drop to a trend line, as shown, and put in a higher low this time?
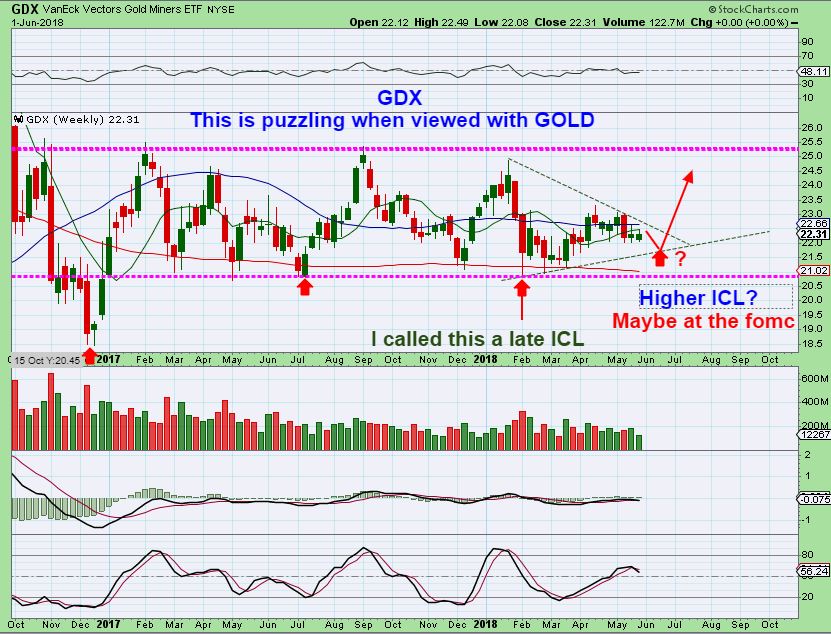
GDX WEEKLY #3– Do we drop to that bottom line like we did in March 2017, May 2017, July 2017, Dec 2017, Feb 2018?
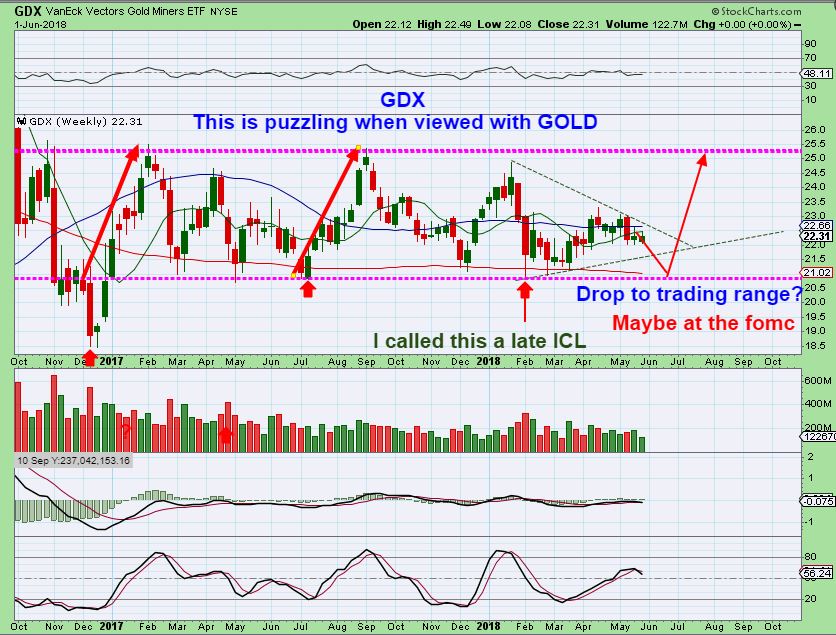
GDX WEEKLY #4– I think that it is good to keep this in the back of our minds to be safe. This keeps us from buying “JNUG – I’m All In” too soon. If Golds ICL is in place, when it is ready to move higher, miners should break higher above their weekly MA’s, and we could go long heavily, at least until it reaches the upper line. Until then, GDX could drop ( especially into the FOMC Date).
General Markets – Bullish after Fridays reversal closed the weekly charts at highs.
.
OIL – Dipping down to a dcl, and then I’m expecting a good bounce higher.
.
USD – looks like a temporary top at resistance on the weekly chart. A dip to a dcl and then another bounce / move higher is likely.
.
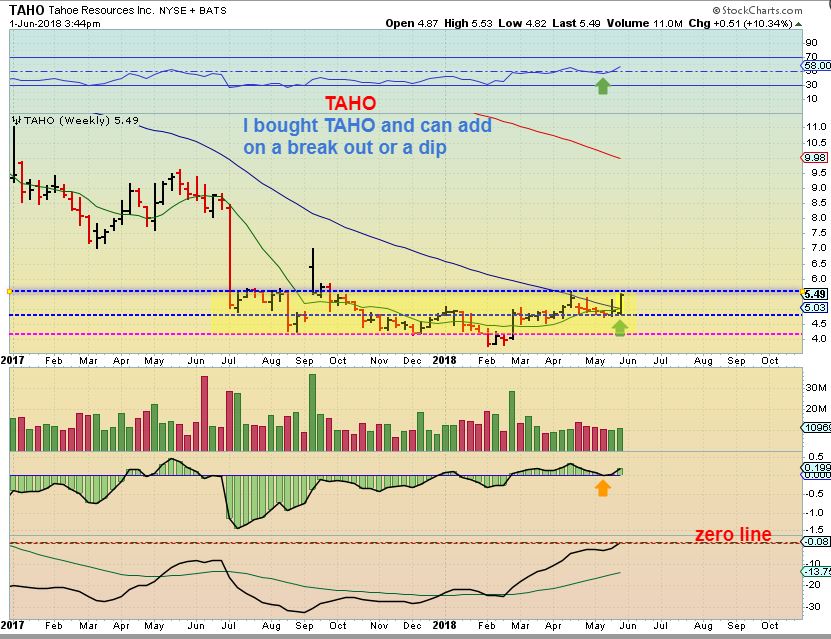
Precious Metals- This is a tough one. Some Miners are moving higher, others are dropping, Gold & Silver are going sideways and as pointed out- they MIGHT have their ICL in place. I’m holding some Silver stocks and took out a trade last week that I decided to hold onto for now, as long as Gold doesn’t break those lows. I also mentioned & bought TAHO and will have that chart below.
.
I will have a few other trades below too, enjoy the rest of your weekend!
.
~ALEX
.
TAHO WEEKLY – I already pointed this out last week, but it has now closed at the highs of this base. I like this set up & started a position on Friday, mentioning that in the comments. I will add on a POP or a drop ( the drop would probably only dip to the middle line again, so I would look to add near $5).
LODE DAILY- I have been watching LODE, but did not by it yet. It Burst higher in April and practically doubled, and has been consolidating those gains.
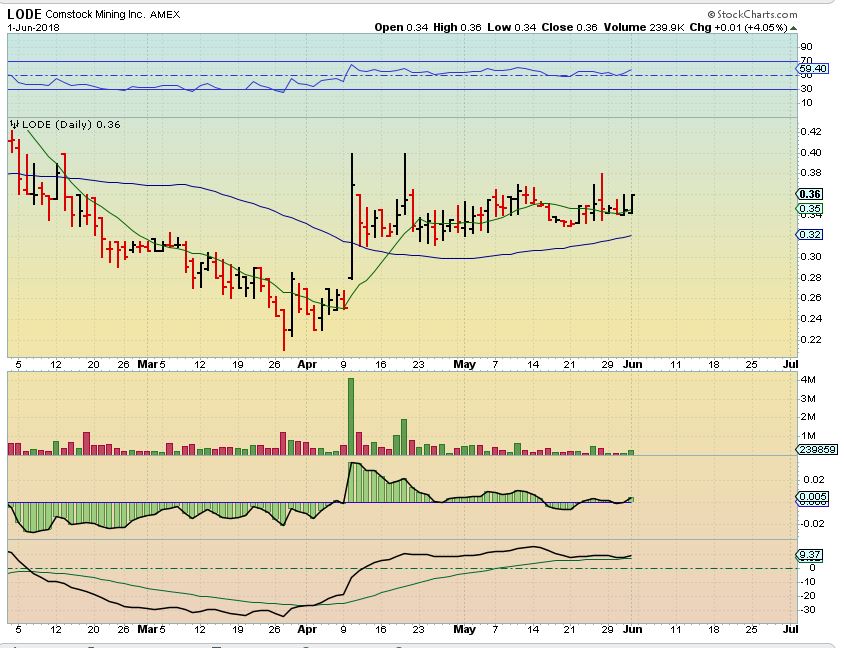
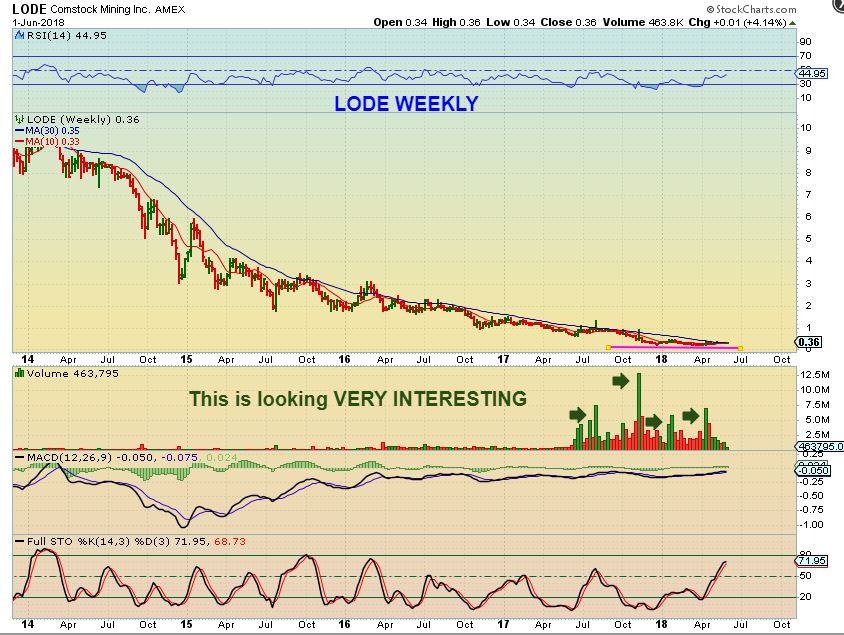
LODE WEEKLY– I want to do some reading about this one, because this could be one of those 10x baggers & then some, if it continues to do well. A lottery ticket for a smallish % of my trading account, and as it proves itself, it could be added to.
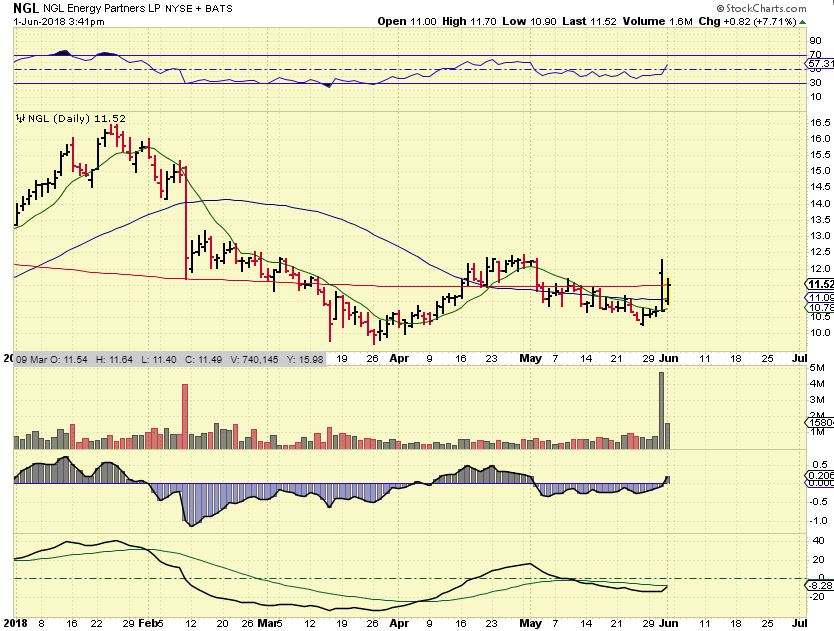
NGL Energy Partners LP: Not just Oil. It owns and operates a vertically integrated energy business. It operates through the following segments: Crude Oil Logistics, Water Solutions, Liquids, Retail Propane, and Refined Products and Renewables. They just sold their Retail propane business though…
NGL (Energy) – As OIL dropped Thursday & Friday, NGL perked up after releasing earnings & announcement that they sold their retail propane business for $900 million. I really like this set up as a form of double bottom with a higher low & a surge in Volume higher. I started a position in it, because it is not currently selling down with Oil. When Oil bounces, it should take off higher.
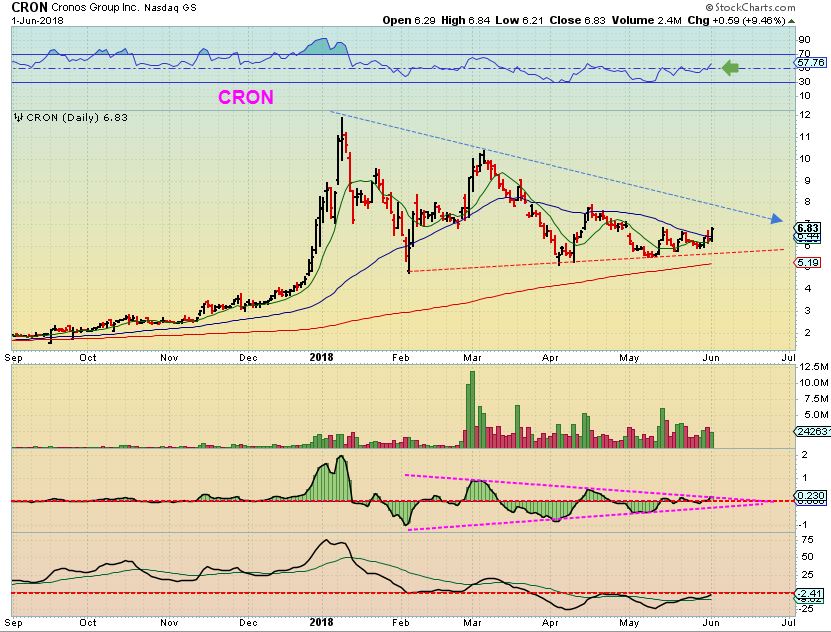
CRON ( Medical Marijuana) – I still own OGRMF, and I like the look of CRON here too. Friday it closed above the 50sma and I can see it running to $8 as a first target. If it pulls back Monday, I will be buying it.
In Fridays report, I mentioned the recent choppiness of the General Markets. I wanted to give it another day to see how things play out before adding to positions, but I mentioned that if you own any currently, you could just use a stop. Now I think we have some more BUY opportunities, as mentioned with SOXL and UPRO, etc.
SGH DAILY – This is a buy right here. A loose stop would not have taken one out of this position. The choppiness made this look questionable, but Fridays reversal looks bullish. 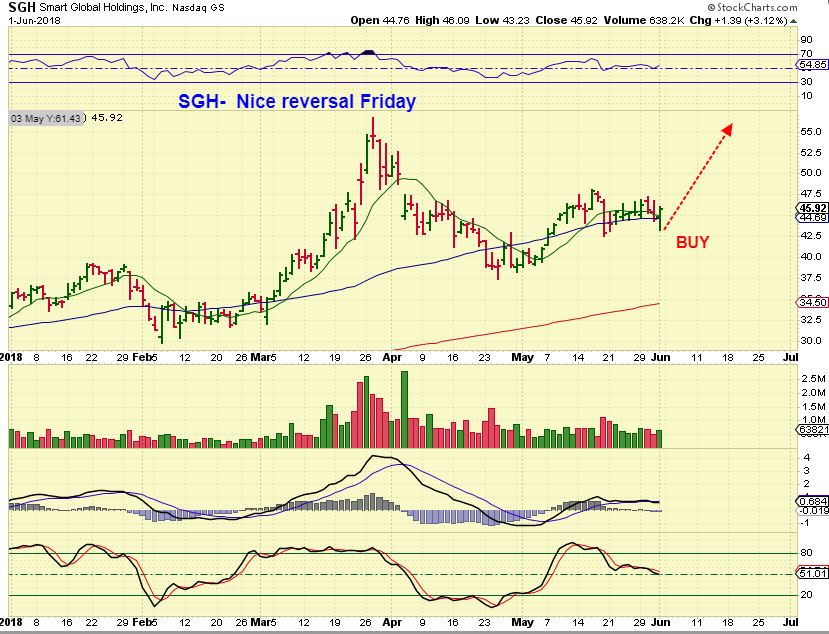
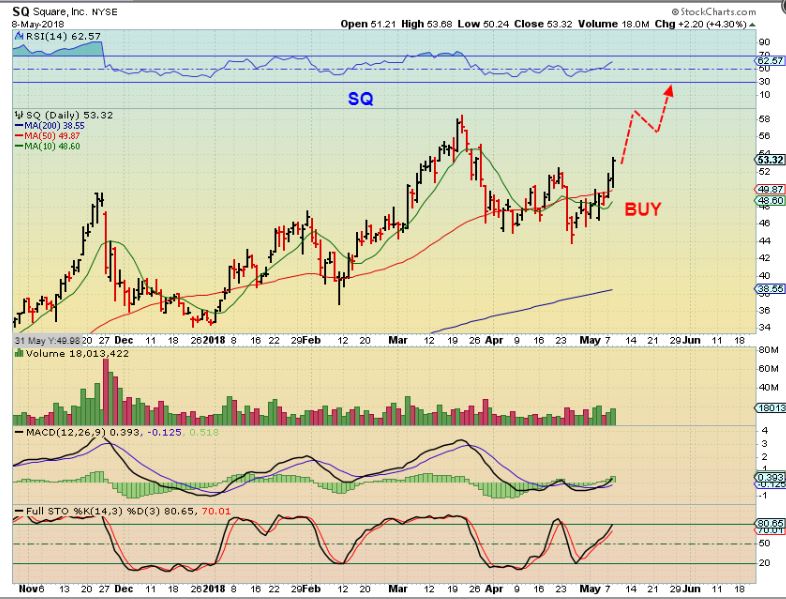
SQ #1 – it was a BUY on May 7 & 8, as shown here. I would expect a cup and then a handle.
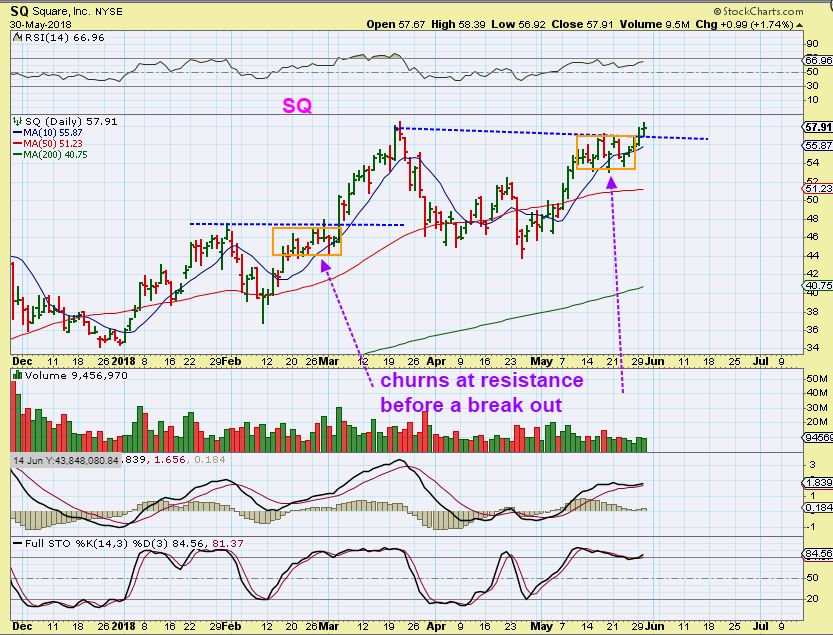
SQ #2 – Now on May 30th, we got that Cup and here I pointed out how it ‘churns’ at resistance before moving higher, and it started moving higher.
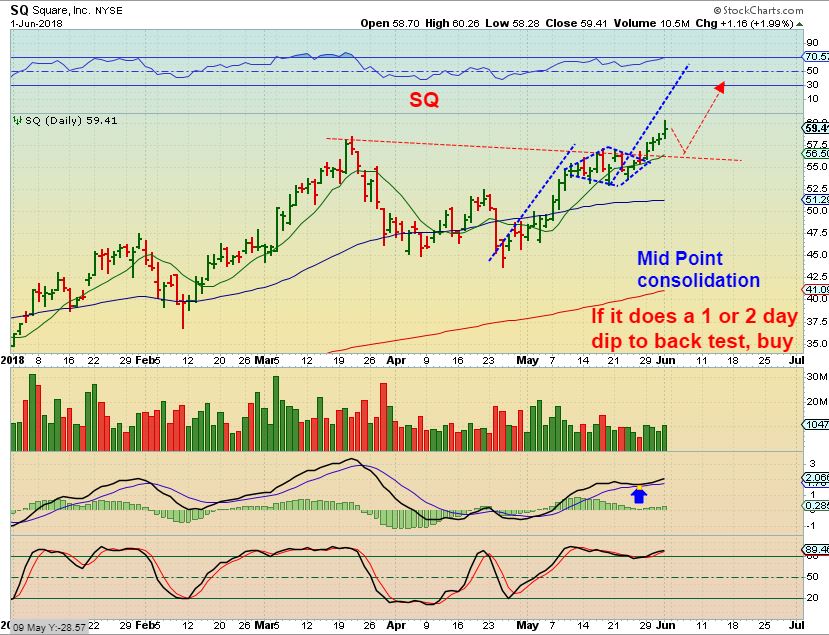
SQ DAILY – If you owned this and held on, it looks good. You also could just jump in for a run to what I have as a $68 target from here, as long as you can endure a possible dip. Why? It may just keep going, but I also can see that a dip to the 10sma as a back test to the break out. With this one, if it ‘back tests’ from here as shown, that would be a buy too. ( Maybe start small & add on a dip to support?).
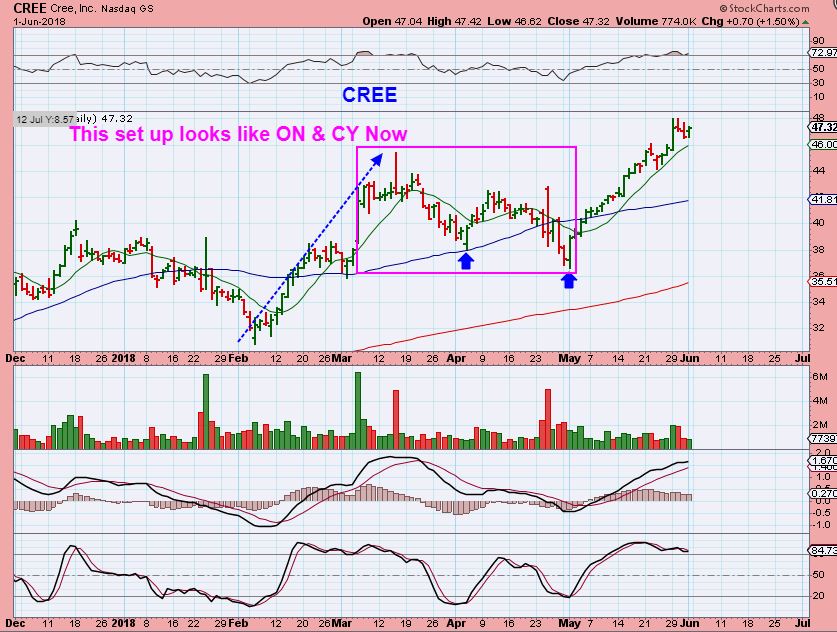
CREE – I recommended CREE after a double bottom ‘stop run & recovery’ type low & reversal. Look how it ran to new highs. LOOK AT THIS PATTERN IN THE MAGENTA BOX, you will see it now in CY & ON semiconductor charts too.
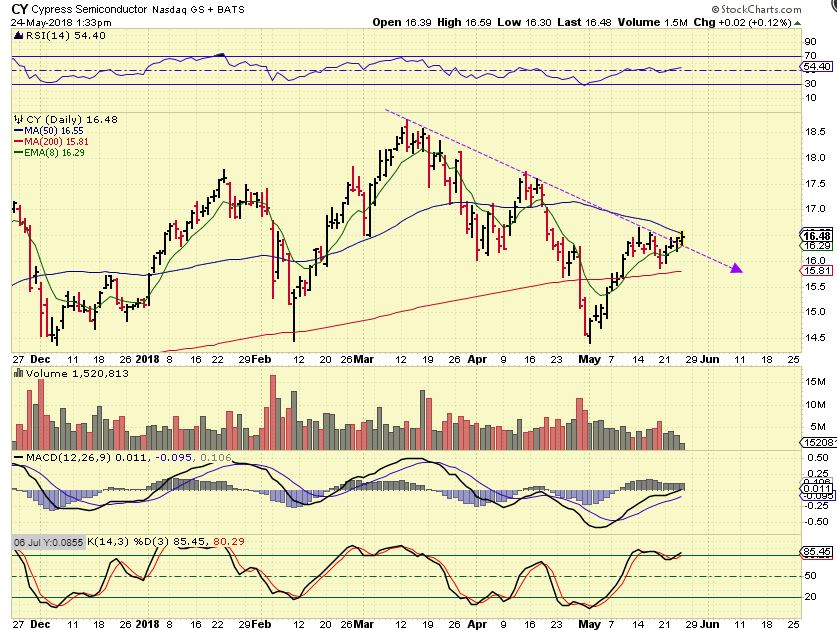
CY MAY 24th – I see the same type of pattern here as we saw in CREE here on May 24. This was pointed out as a low risk entry because of the break out of the down trend line ( or wait for the 50sma)
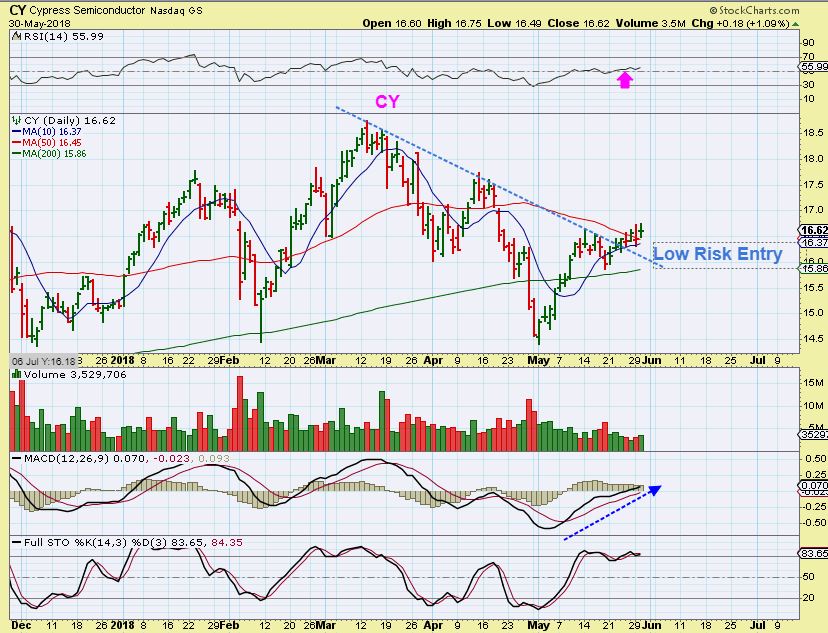
CY MAY 30th – Now the 50sma has been overcome, low risk again, with a stop.
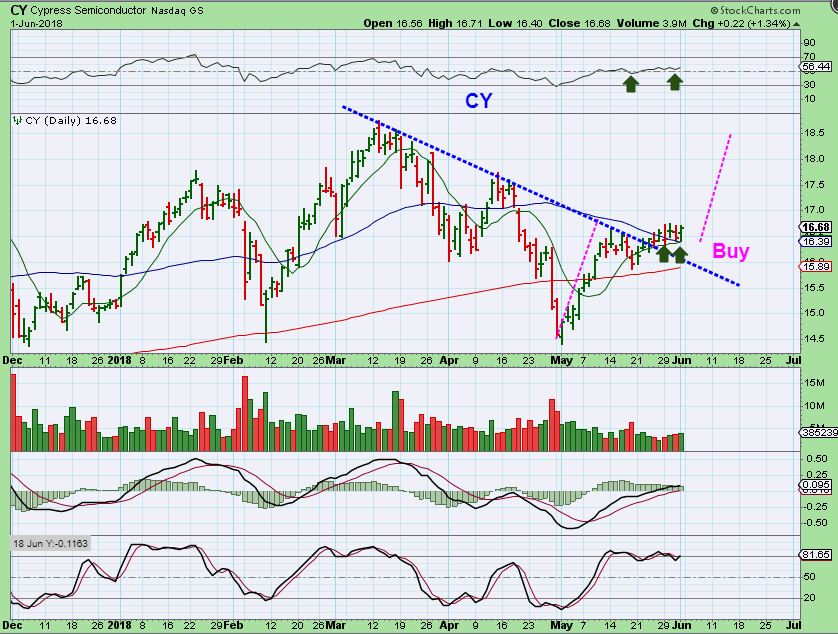
CY June 1 – A nice reversal off of the 50sma. Still a good buy and similar to the CREE shake out. This may finally be ready to add on some more gains.
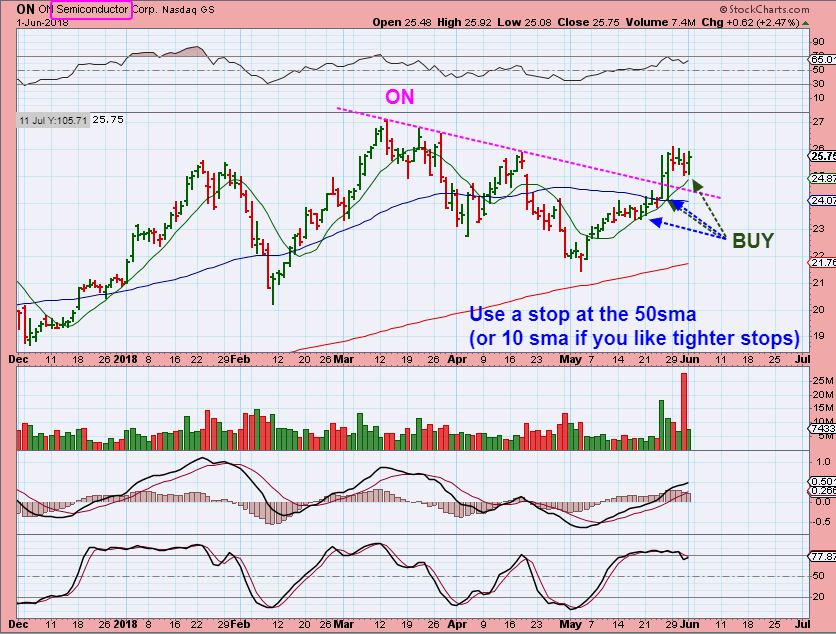
ON SEMICONDUCTOR – This is the same set up as CREE too. The 2nd drop runs stops and then it reversed higher. It has also been reversing off of the 10sma, and did this Friday. Last week formed a bull flag, I think it may now be ready to move higher.