
June 15th – CHANGE
I want to briefly discuss something that I mentioned I was looking for to signal a change in the Gold Market. I believe we have that change as of Thursdays ECB Mtg.
USD – The USD put in a sharp burst higher, so this looks very bullish and bearish for Gold under normal conditions. It looks like day 1 of a new daily cycle. Read the chart… was Gold crushed on Thursday?
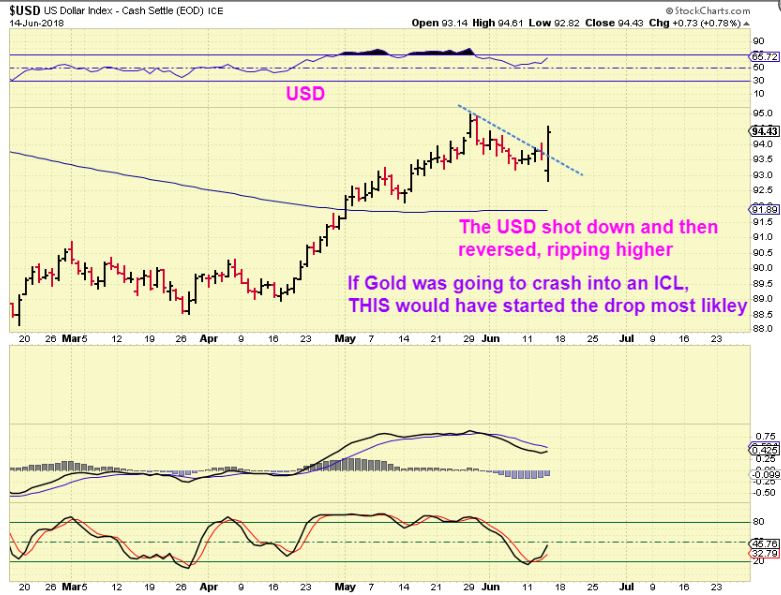
GOLD MOVED HIGHER WITH GOOD VOLUME TOO, SO THIS IS A ‘CHANGE’ IN WHAT NORMALLY HAPPENS, BUT THIS IS NOT THE ONLY BULLISH CHANGE THAT I AM FINDING.
LET’S DISCUSS GOLD
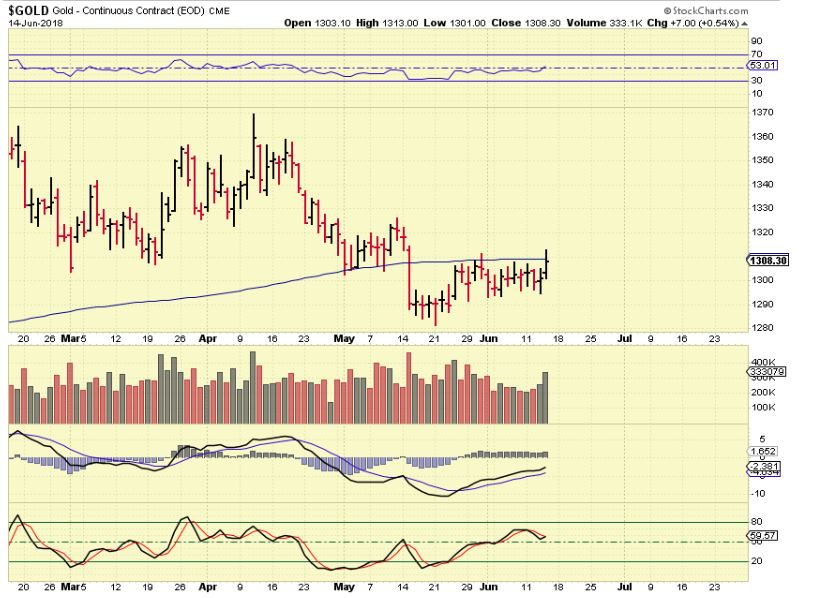
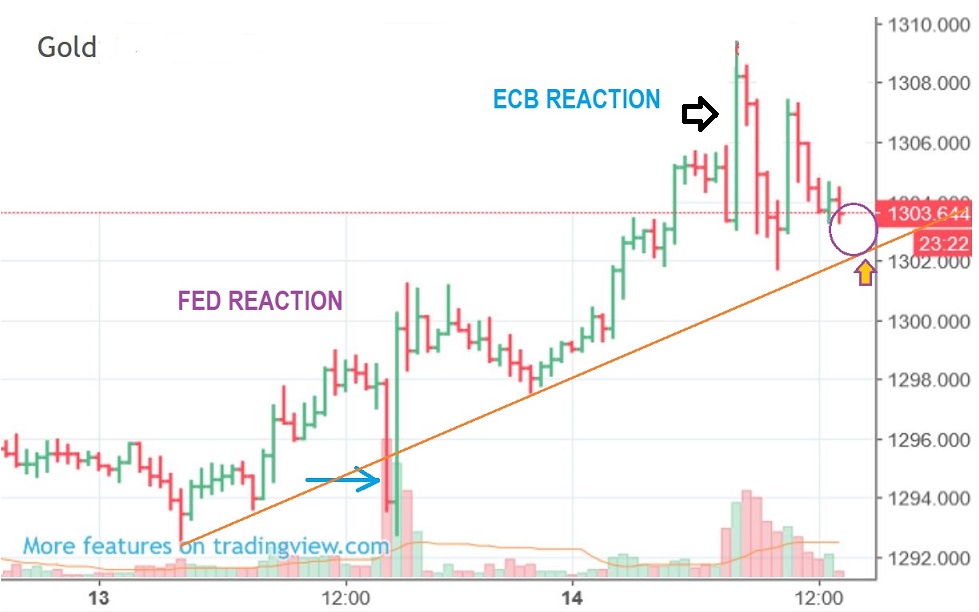
GOLD – Let’s just say that we got the Knee Jerk reaction from both the FOMC & the ECB, but neither dropped Gold down toward an ICL type sell off. In fact, Gold is currently higher after both meetings.
GOLD is pushing at resistance and I finally got a bullish cross over in my lower indicator. When we are in the timing for an ICL, it usually won’t cross up until an ICL is in place. That is another Bullish Change for Gold.
.
MORE CLUES PERTAINING TO AN ICL
.
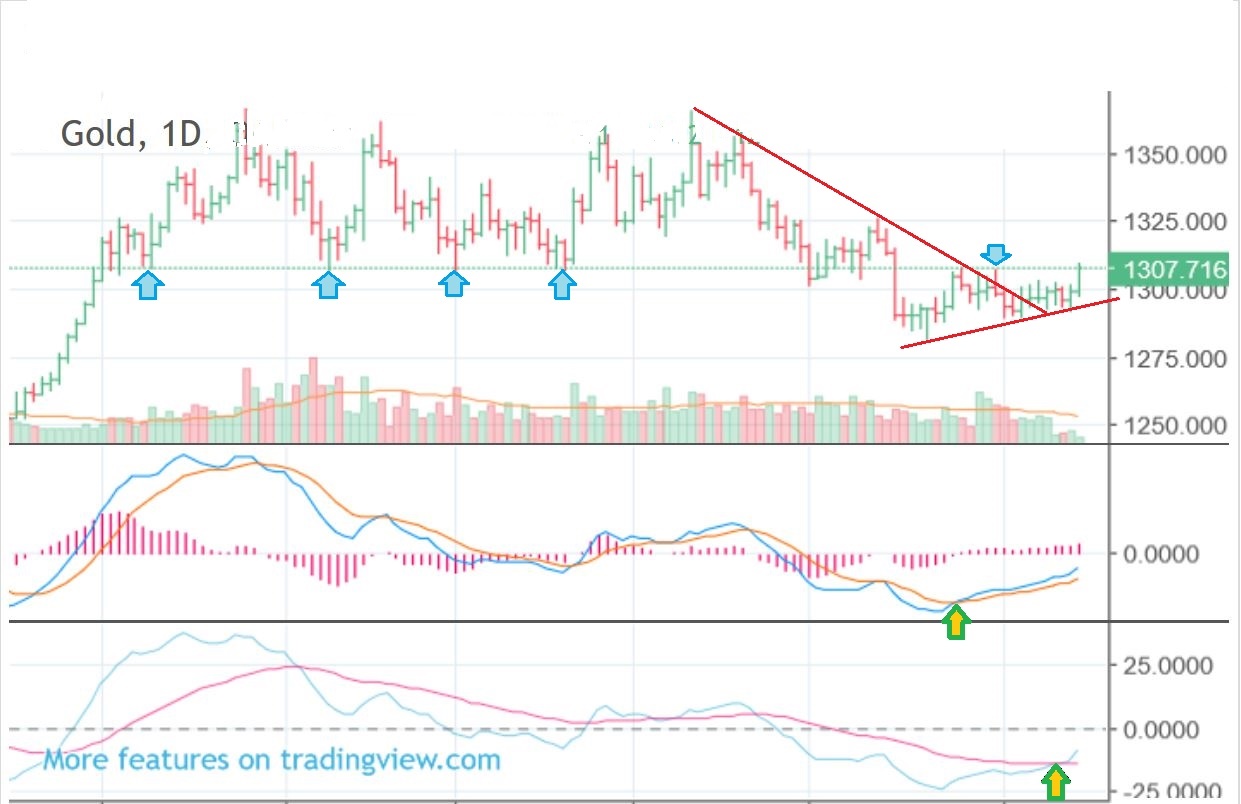
GOLD DAILY – We have discussed that the trend line break usually indicates that an ICL is in place too. It is not something that I rely on by itself, but it is necessary and a good sign, however…

GOLD DAILY – THIS IS BIG IN MY OPINION! The ECB pop pushed the price above the day 7 ‘peak’. THAT gives us a day 17 peak so far, and that does not happen late in an intermediate cycle. At the end of an intermediate cycle that started in December, we would expect weakness, and a Left Translated daily cycle would form as it drops into an ICL. So THIS is a solid reason to believe that WE ARE NOW ON THE FIRST DAILY CYCLE , and an ICL is in place. Please read the chart…

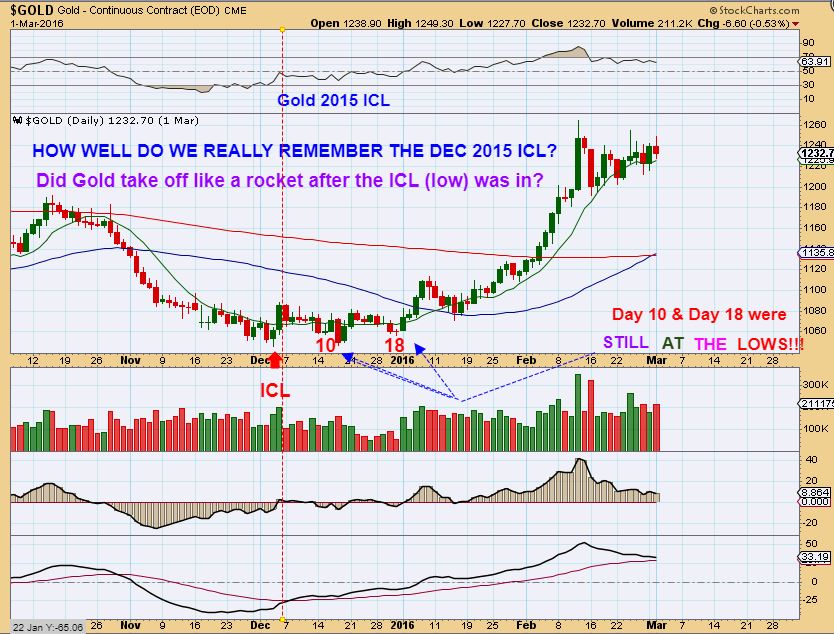
I HAVE BEEN POINTING TO THIS CHART BELOW TO KEEP US ALERT TO THE FACT THAT AN ICL Formed in 2015 and dragged along the bottom for weeks. It didn’t accelerate until the 2nd daily cycle, after a back test of the 50sma.
GOLD ICL 2015 – 18 days along the bottom had most give up on Gold. It then gradually broke above the 50sma, back tested it, and broke the 200sma.
In yesterdays report I wrote this about the weekly chart –
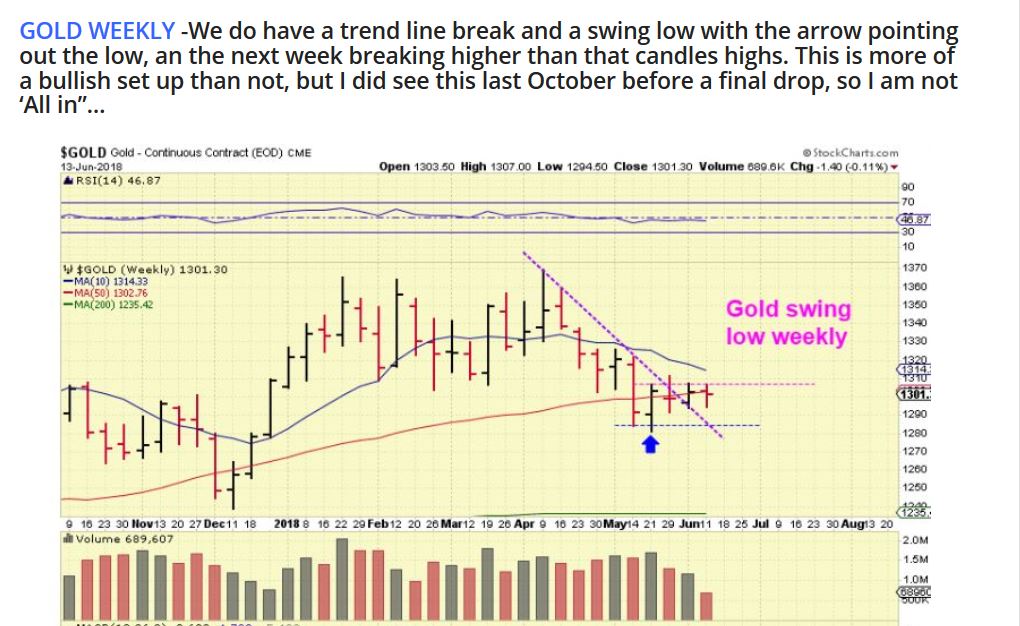
Thursdays push higher makes the weekly chart look even better. I’d love to see Gold move a bit higher on Friday, since that would just add to the bullishness.
.
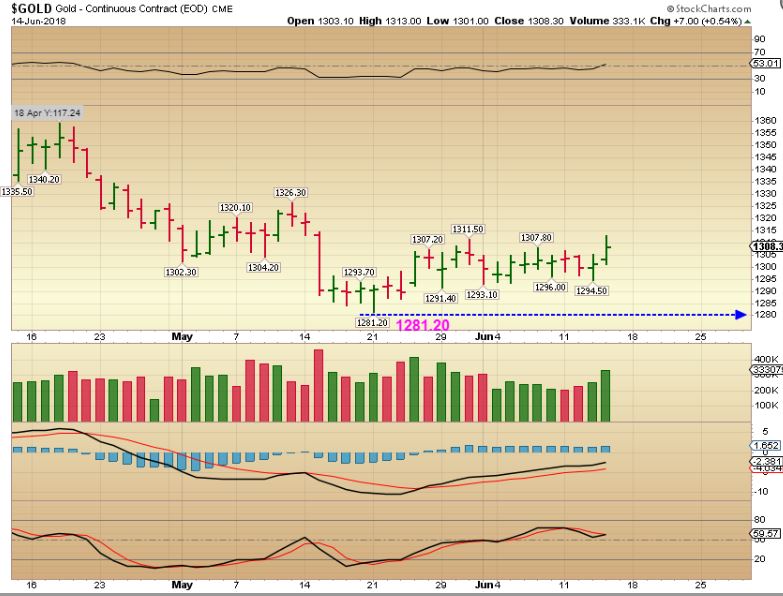
So if an ICL took place on May 21, then we are on day 18 as of Friday, and 1281.20 should not be taken out on the downside from here.
.
AND WHAT ABOUT THIS?
.
SILVER- I was thinking that the ECB mtg may stall Silvers climb, but…
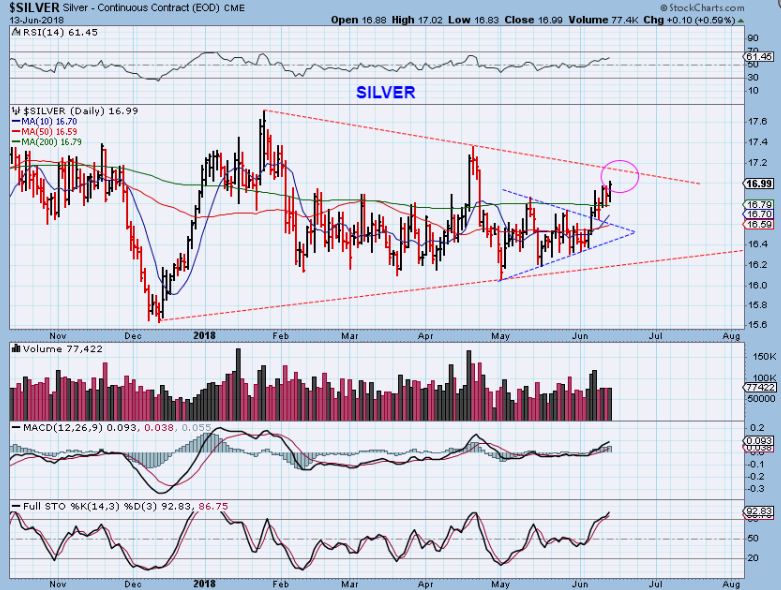
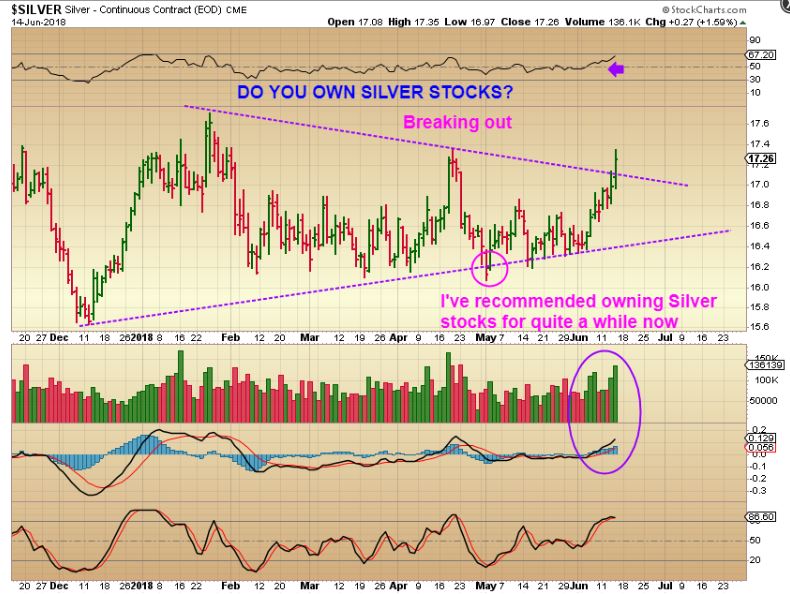
SILVER after the ECB MTG & WITH THE USD STRENGTH – Do you remember when I was looking for an ICL in May ( 5th month after decembers ICL)? Silver looks like it DID lead the way and put in a Stealth ICL / ‘shake out ‘ as it climbed this triangle. Silver above $17 is very bullish.
SILVER WEEKLY – This could get moving really quickly, maybe even next week.

.
MINERS
.
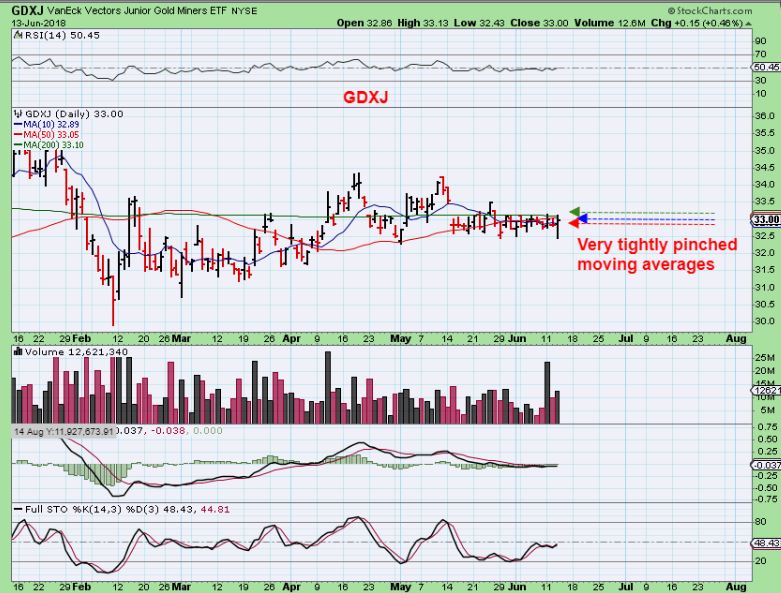
GDX– O.K., this does NOT look impressive yet, right? It is pushing on the 200 sma, and as a result, I hear many say that “Miners are boring and could easily break down” – but let’s dig in a little deeper….
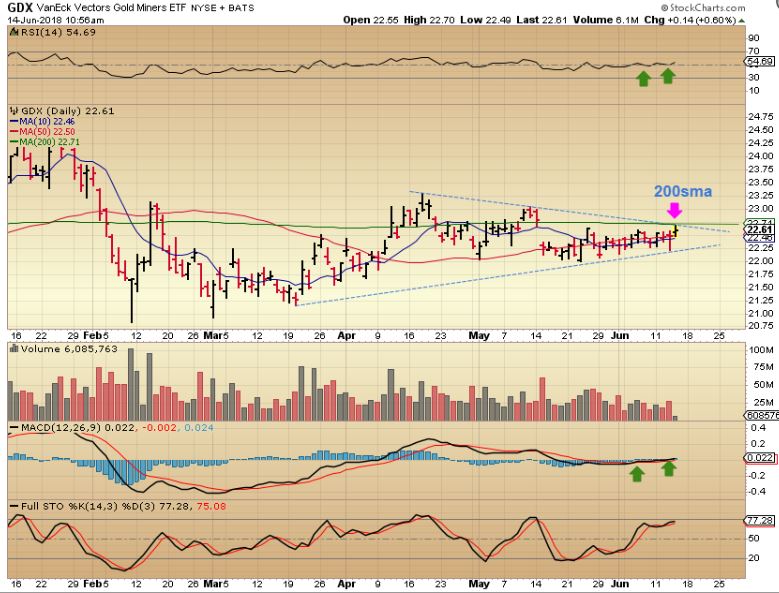
So GOLD hasn’t really broken out and started running higher, and that chart of the GDX shows it pinned under the 200sma. It is understandable that this is Not impressive to many. But remember, we HAVE BEEN seeing bullish set ups that ARE having follow through despite Gold & GDX not quite running higher yet.
Let’s review. GDX is stalling, ARE MINERS BULLISH?
.
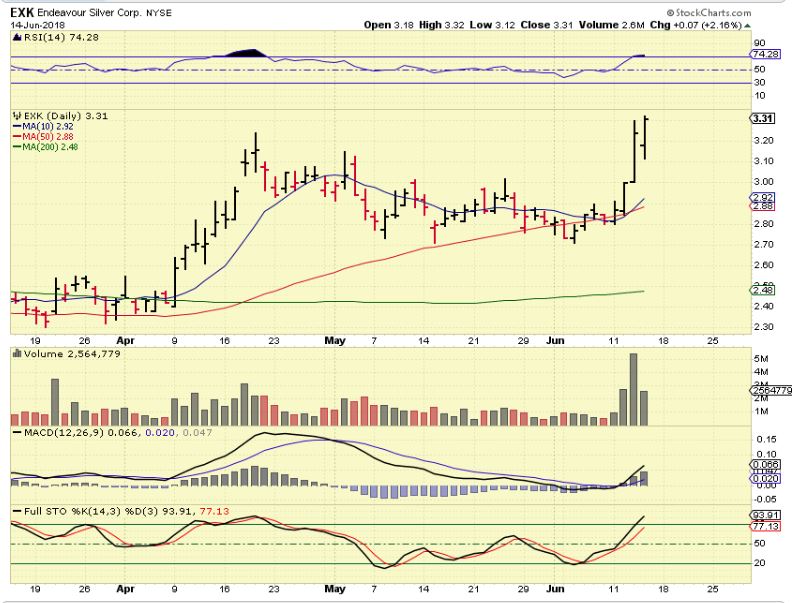
EXK- I posted this and stated that I bought it even before the FOMC , because it just looked like a great set up.
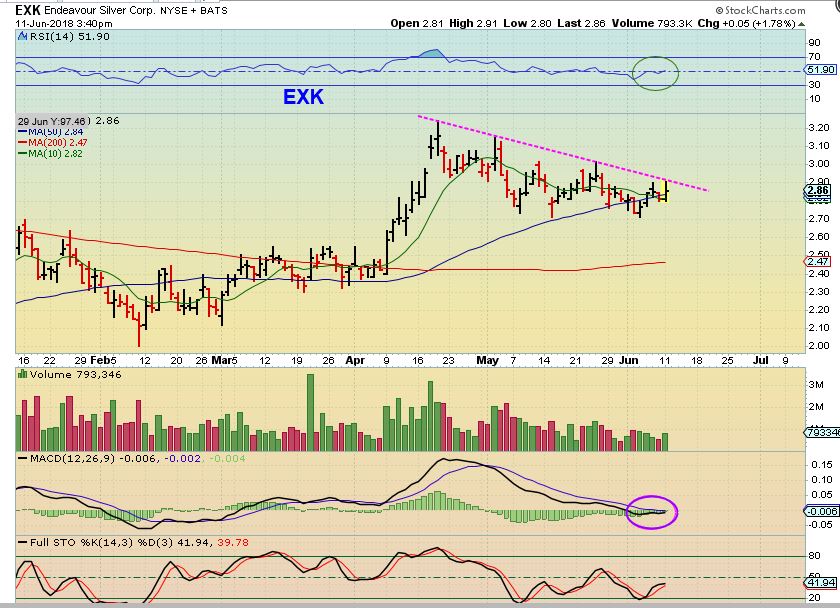
EXK – And EXK had the follow through that would be expected. This does not look like we have a drop to an ICL ahead of us. This is Bullish.
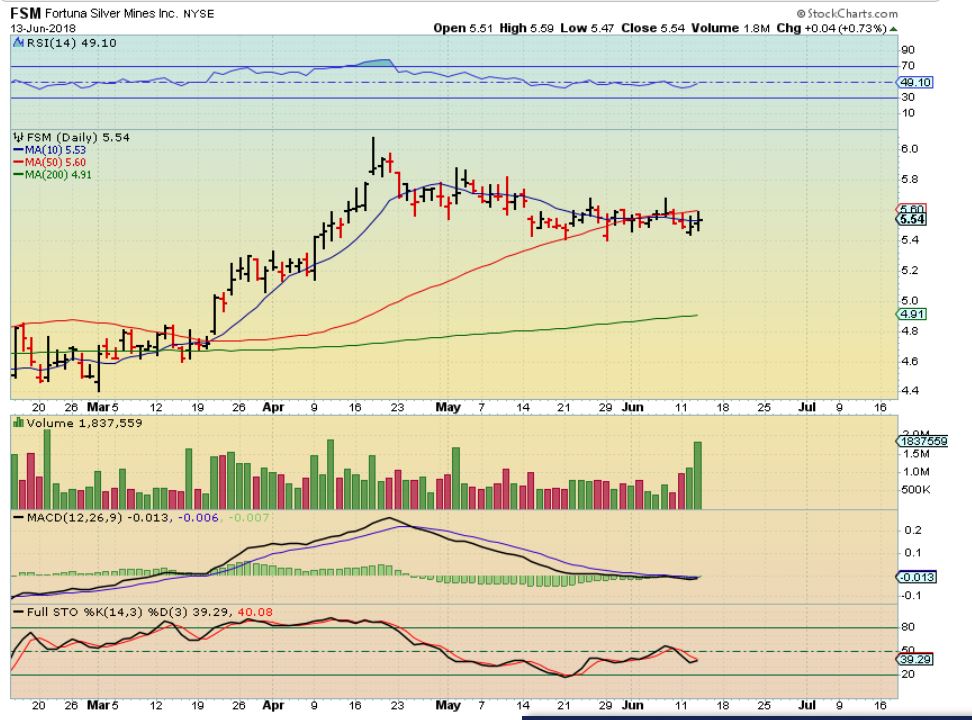
FSM – So then I posted that this chart is ( to me) identical to the EXK set up, so I bought this on Thursday after the ECB mtg.
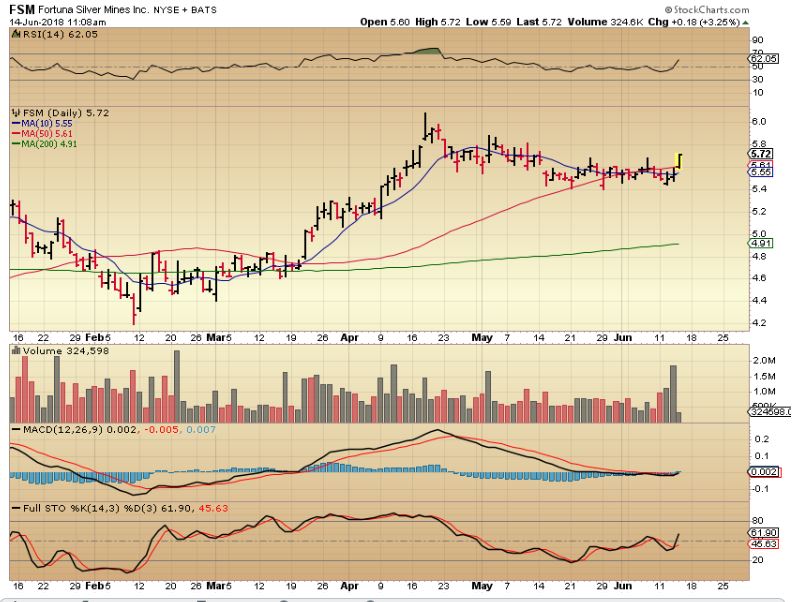
FSM – And it broke out. This is my 11 a.m. chart posted in the comments section, and by the end of the day it closed with similar volume to Wednesdays. THIS IS STILL A BUY, it is just getting going, because …
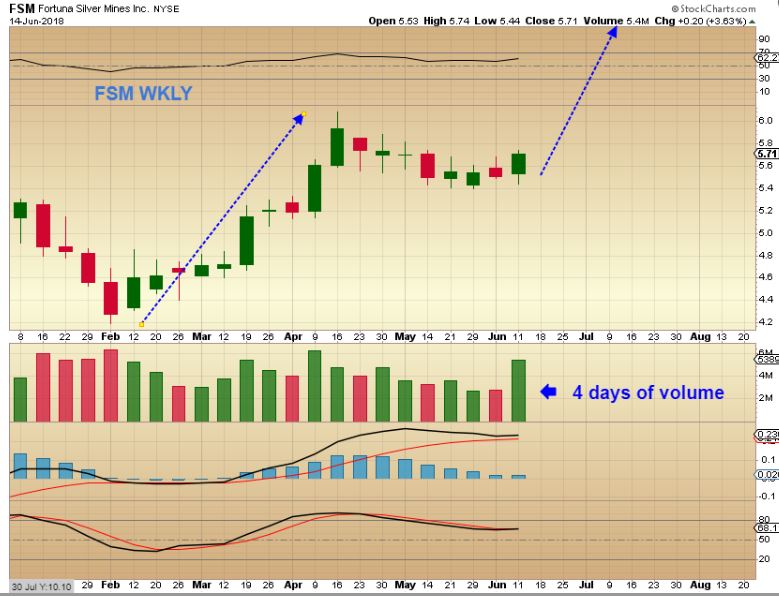
FSM BIG PIC- You didn’t miss it if it is going from $5 to $10 over time. I posted this yesterday, and…
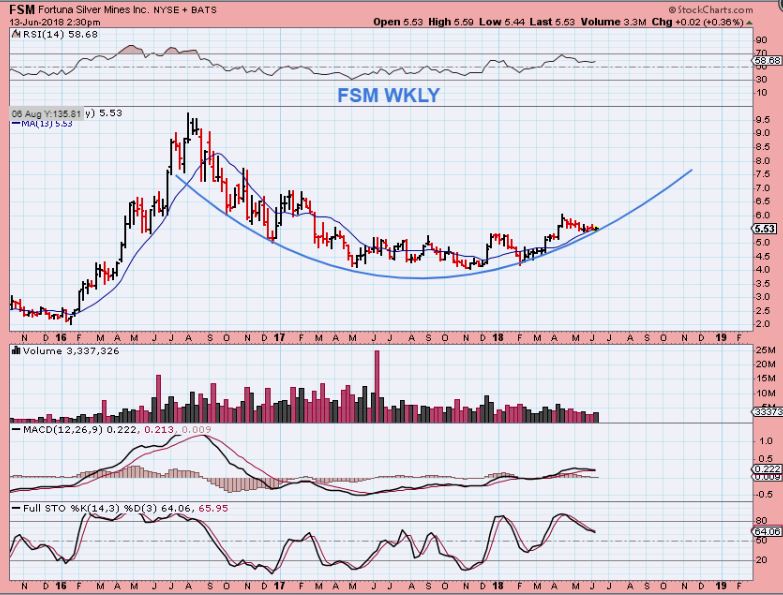
FSM WEEKLY- It even looks better now, with plenty of upside left. FSM is still a buy.
GORO – I pointed out that this is a bullish set up yesterday, and notice how much GORO has already run higher while an ICL was expected! Obviously Some Miners are ignoring Golds ICL sell off.
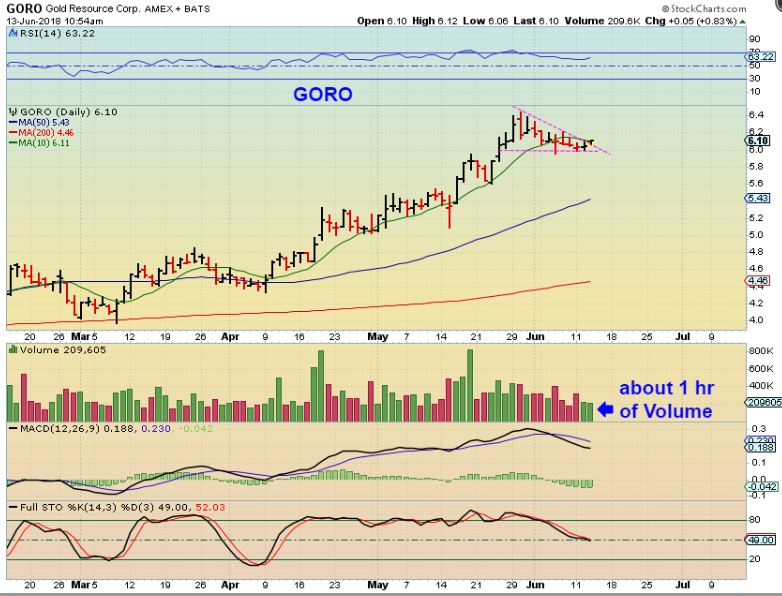
GORO – As of Thursdays close, GORO was also breaking higher again.
 .
.
So we have to ask ourselves, “Why are we having so many individual Miners set up bullishly before the FOMC and ECB meetings and then breaking out?” That is just another ‘change’ that leads me to believe that an ICL is in place.
.
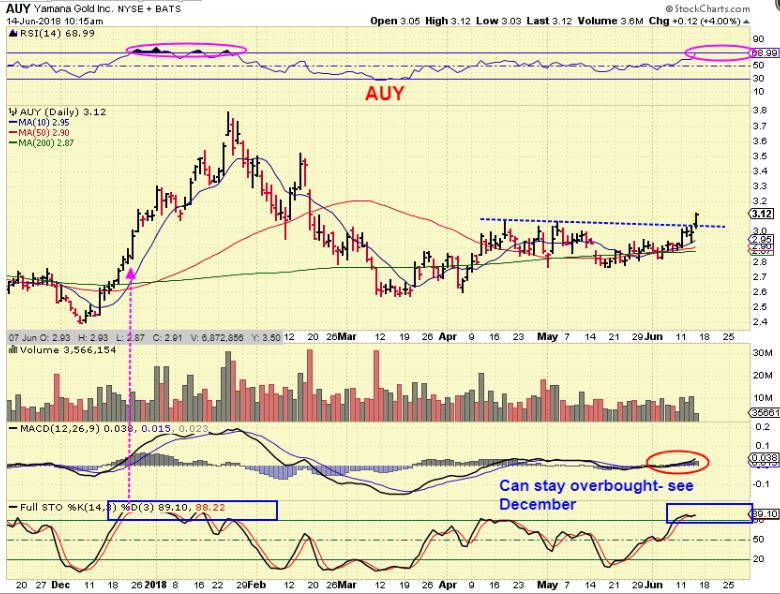
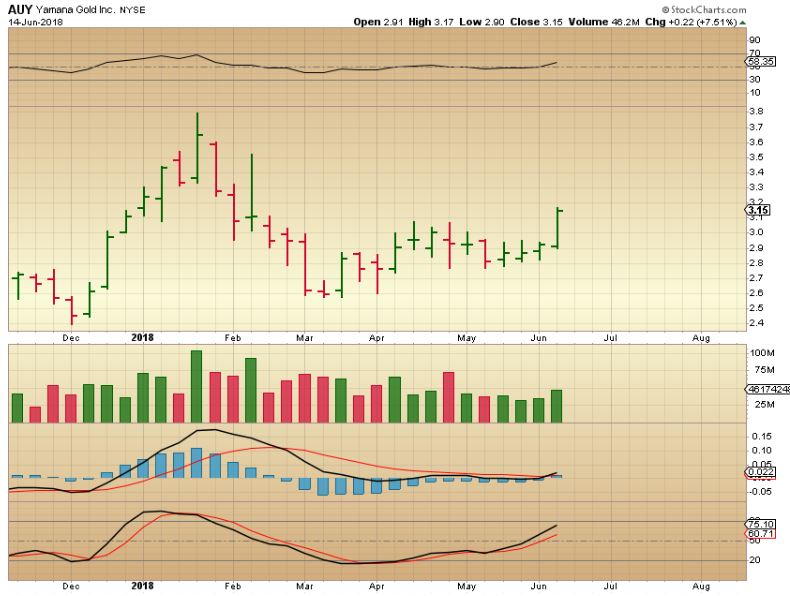
AUY – I also bought AUY as it began to break out this morning, and I posted this chart after 10 a.m. .
AUY – by the close it had almost 17 million in volume and closed near the days highs. I expect it to eventually reach the January highs again, and even more if 2018 turns out as I believe it will.
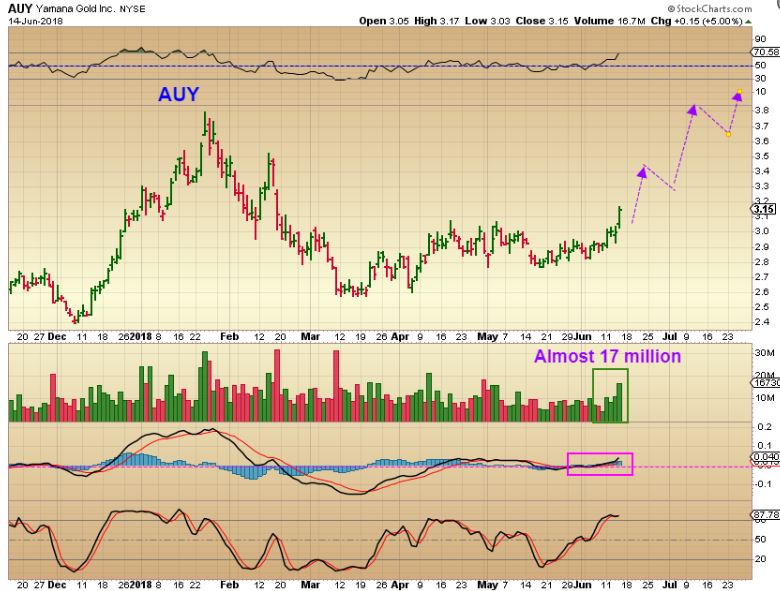
AUY WEEKLY – As of Thursday, this is a bullish weekly chart. This does not look like an ICL is ahead of us, it looks like it is behind us.
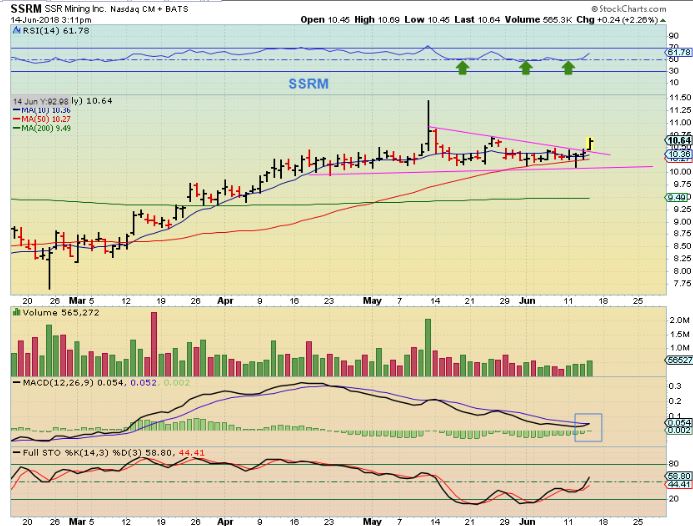
SSRM – This is just starting to break higher as of yesterday. After a multi-week tight base like this, SSRM could run very nicely. This is an easy buy too, with a stop under recent lows. Those lows have been holding for months and this is a bullish chart.
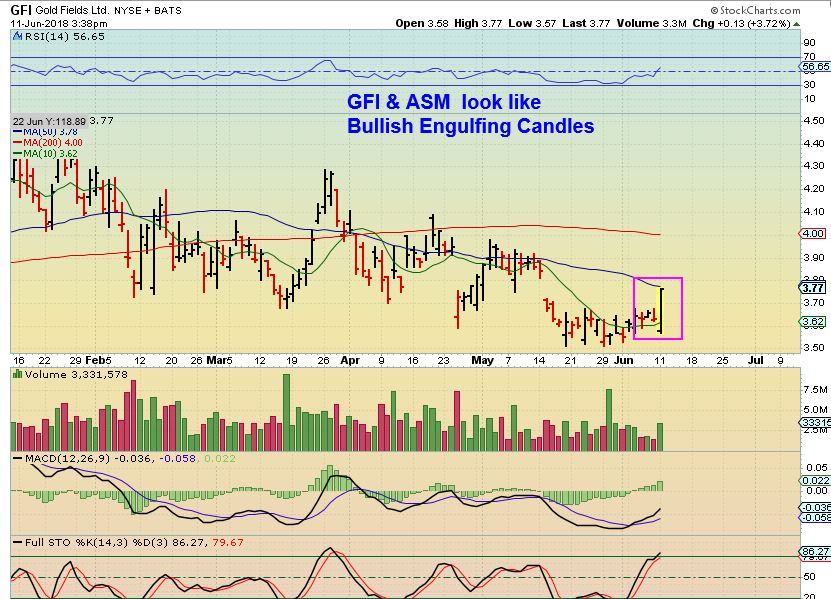
GFI – From June 11th, I discussed this POP before the FOMC Mtg also. I was mentioning that many Miners are lining up bullishly then.
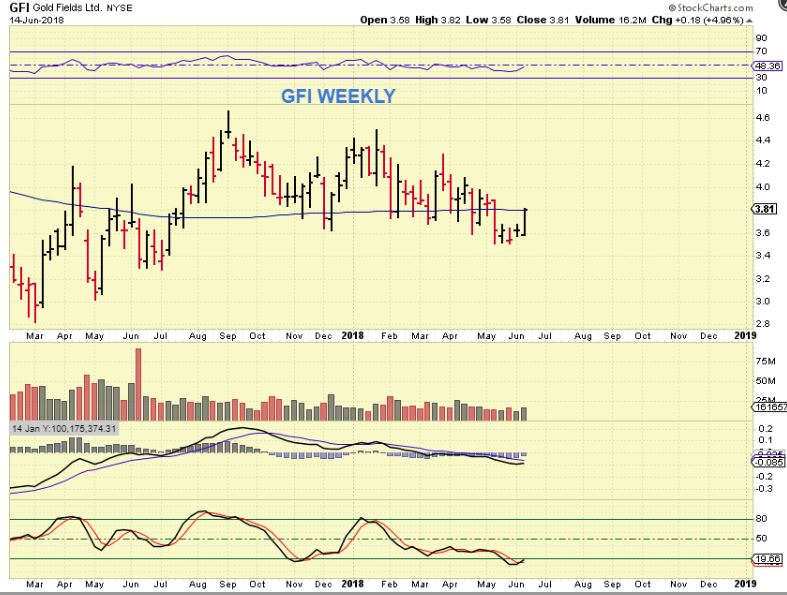
GFI WEEKLY – Now this weekly chart looks to be trying to break out higher too.
So what I am trying to point out here is this: I have been looking for clues that would help us to see if an ICL took place or was still ahead of us. Things were not very obvious, because we have had weeks of just seeing sideways lackluster action in Gold & the Miners. This is a very bullish looking chart, but it is not clear that this would not break down, with Gold just going sideways…
After the FOMC & ECB Meetings, I am now seeing some ‘changes’ taking place on the Bullish side. Silver broke out yesterday! Gold may or may not take off higher today, but Gold popped after the ECB Mtg, and the daily cycle now has a peak on day 17 so far. With that, I am seeing clues or strong indications that the ICL is behind us. The USD remains tricky, but we’ll see how that plays out. GDX & GDXJ are deceptively boring, while individual Miners certainly have bullish set ups and are getting bullish follow through.
.
And even though GDX & GDXJ do not look impressive on their own, let’s take a look at the weekly chart as of Thursday.
GDXJ WEEKLY – The FOMC & ECB MTG week has become a Bullish reversal at this point, with increasing volume. Miners like EXK, FSM, AUY, SSRM, GORO, etc are breaking out of their consolidations, and I have to expect that GDX & GDXJ will soon too.

GDXJ WEEKLY – The volume is swelling as it pushes on overhead resistance. A break from this multi week tight consolidation pattern should lead to a nice strong run higher.
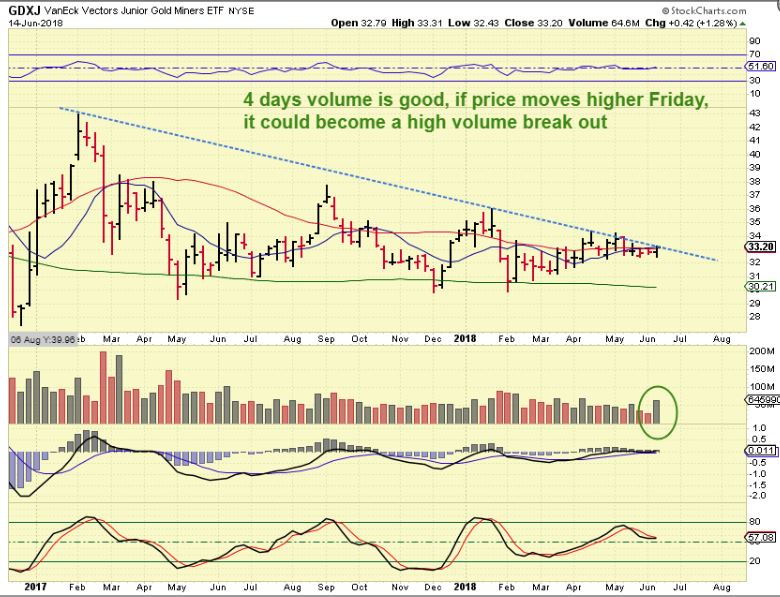
Look at the above chart again. What if GDXJ moved to $34 and closed there Friday? That could be the weekly break out we’ve been waiting for. If it doesn’t, you have more time to shop for your favorite Miners, because it may break out next week. I will continue to post individual miners as they set up bullishly in the coming weeks. Usually I can catch stocks right before they take off higher, like EXK & FSM. Then we can all sit back and just ride those positions out for a while and isn’t that exactly what we want to do? I still like FSM, SSRM, & AUY, as buyig opportunities, because they are not overly extended.
.
Enjoy your Friday trading & the upcoming weekend!
.
~ALEX

