Friday June 22
On Fridays, I usually just post a few more trade ‘set ups’, since it is the last day of trading for the week. At this point, usually not much has changed since yesterdays report that needs to be discussed before the Big Picture Weekend report, but…
.
I will admit that I am eagerly anticipating how this reversal candle in Gold is going to play out on Friday. A break above 1272.40 forms an unconfirmed swing low , so let’s review Gold too …
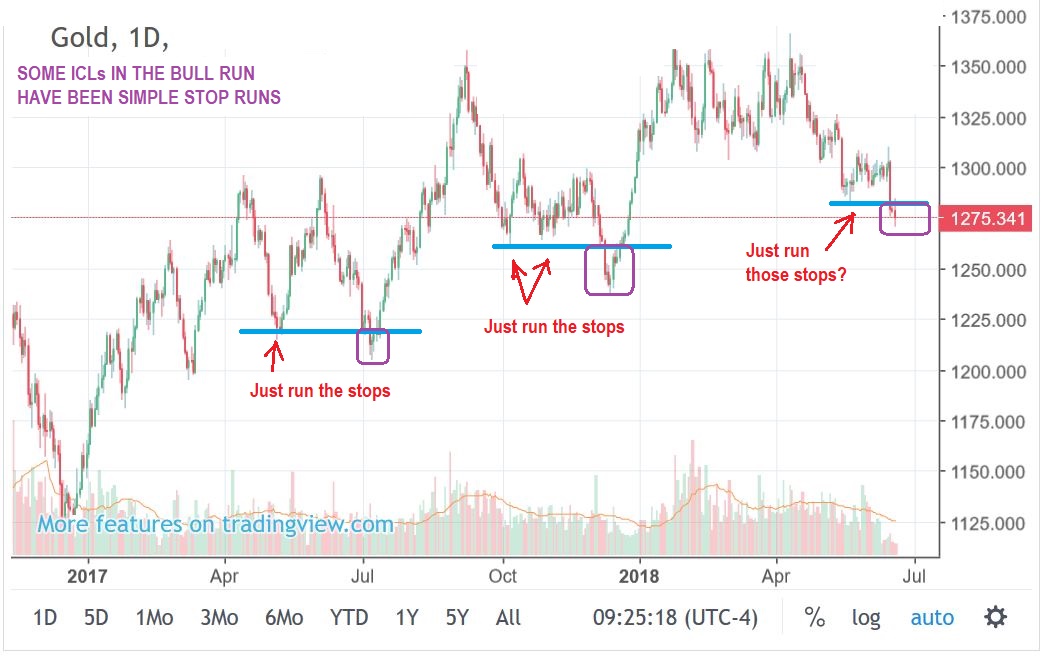
YESTERDAY I TALKED ABOUT QUICK STOP RUNS & V-BOTTOMS IN GOLD
.
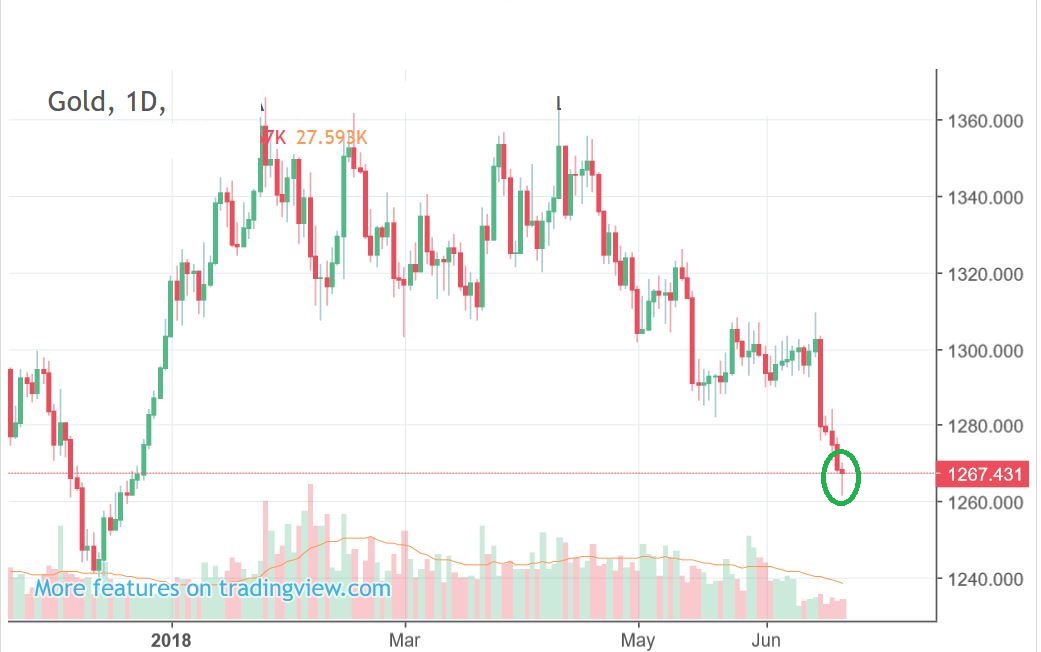
A V-Bottom comes from a quick sharp drop & recovery. A ‘stop run’ is when price breaks recent lows to run the stops and shake people out of position. We did have our sharp drop below a recent low, as shown in this chart from yesterdays report…
GOLD – I added this chart yesterday in the morning, showing that a semi steep drop & a wedge was forming. A break out is usually bullish.
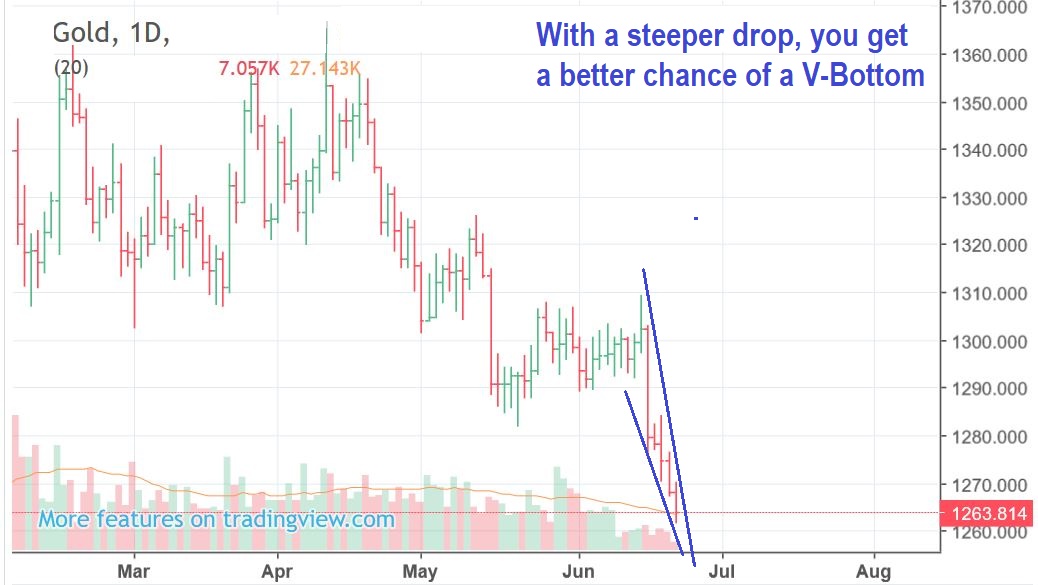
So I drew this close up for the comments section midday to show how close this price of $1269, is to breaking above that wedge. $GOLD $1275 would be a good break out ( see the box).
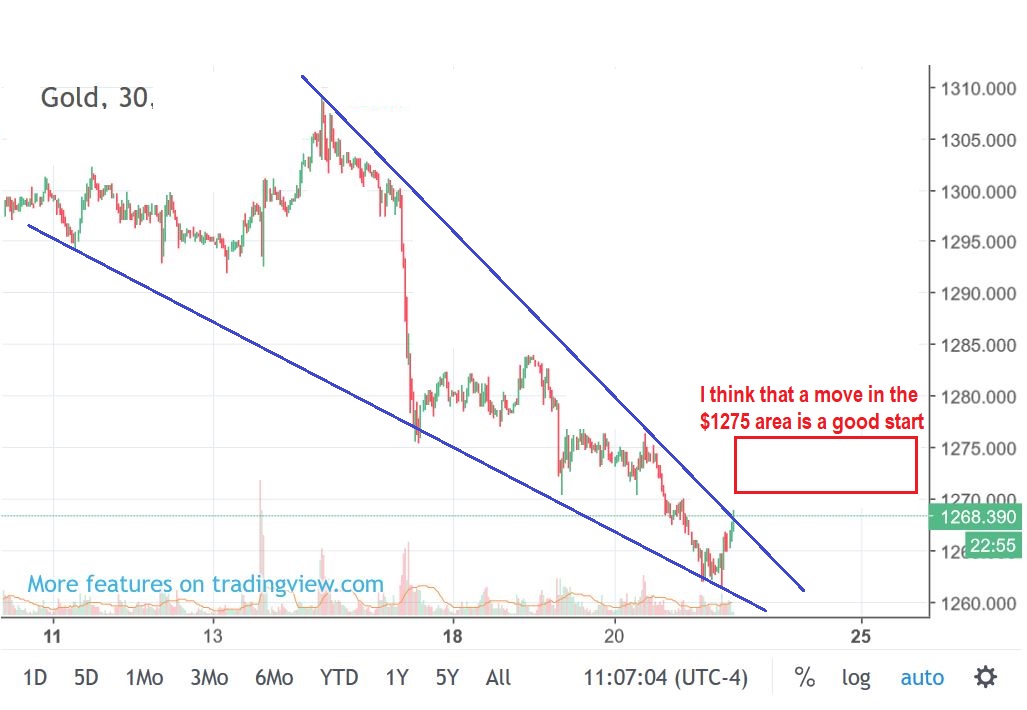
And that run to the top of the wedge in the above chart at $1268 now gives us this reversal candle. We are watching $1272.40 for a swing low. I would expect a move higher from this reversal candle, thus we would also get a break above that wedge.
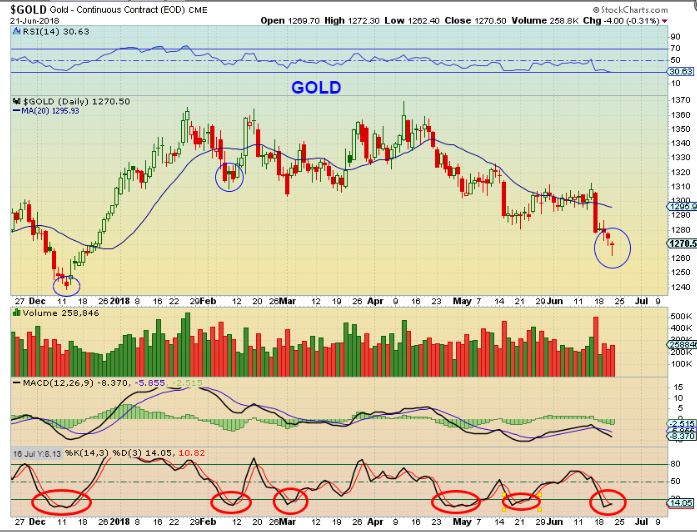
SO HERE IS THE RUNDOWN – BOUNCE OR ICL?
.
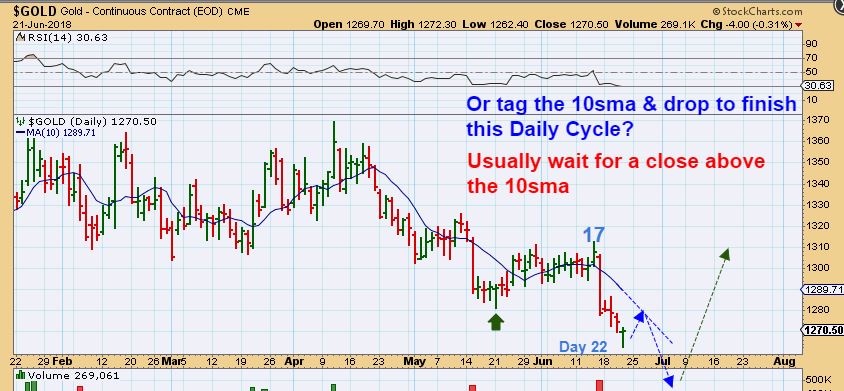
GOLD #1 – Usually a reversal candle leads to at least a bounce and often a low, so I drew a resistance line …
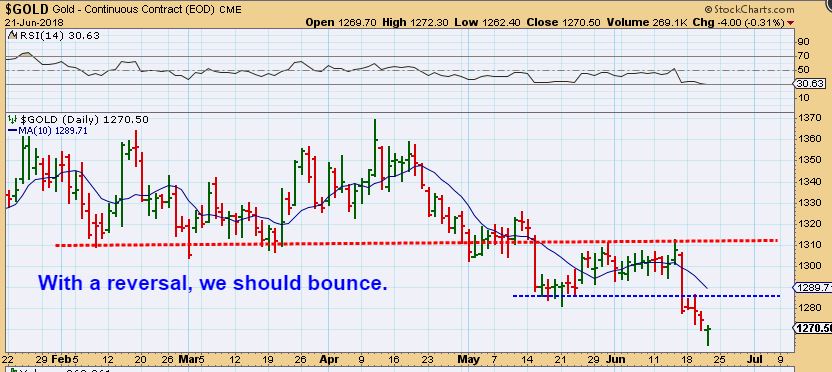
GOLD #2– It could be the low, we are at day 22 and that is acceptable, so a break & close above the 10sma is usually a safe buy ( And a stop can be placed below the reversal).
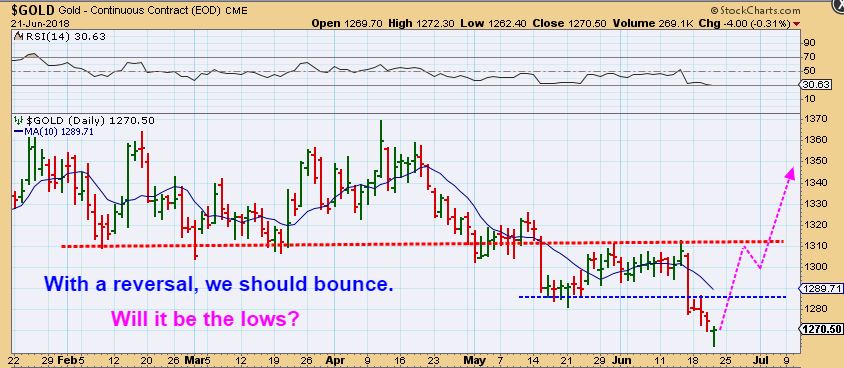
GOLD #3– A tag of the 10sma and dropping further IS also possible from day 22. This would simply extend the daily cycle count, and Daily cycles can be 30+ days.
GOLD #4 – So the swing low, the close above the 10sma & close above the trend line gives more likelihood that a low is in place. And then…
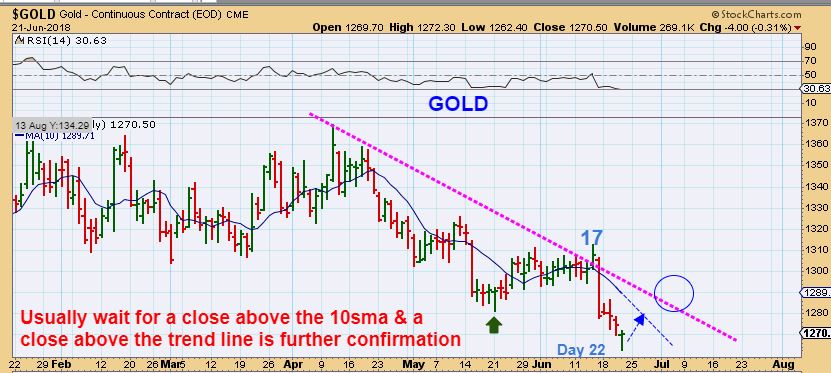
Look at each ICL and the move that followed. As you can see, the rally that follows an ICL is excellent & lasts for weeks. So you don’t miss much being safe & waiting for those features to confirm a DCL/ICL.

I admit that when I see a reversal, a swing low, and a break above the 10sma, I do buy with a stop in place. I am in front of my screen all day and can babysit my position until it is established.
.
NOTEWORTHY SET UPS
.
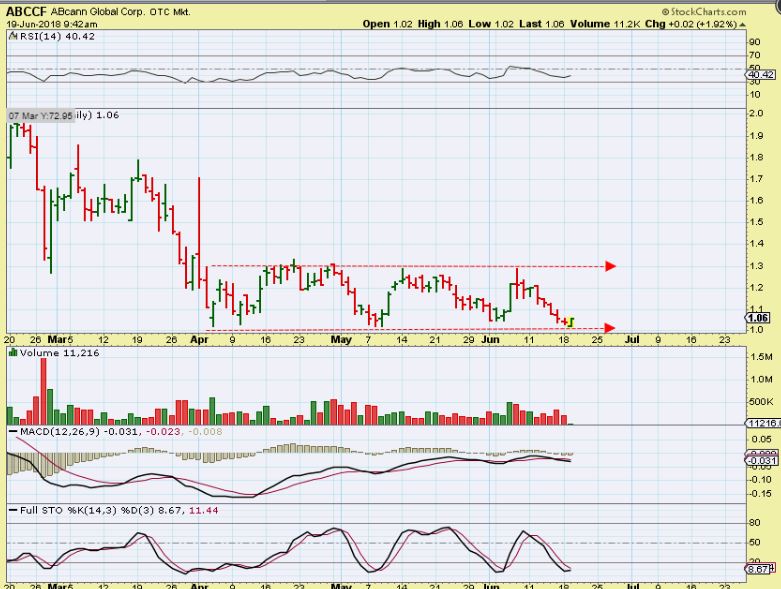
ABCCF – I pointed out this reversal 2 days ago as a buy at the lows of the base
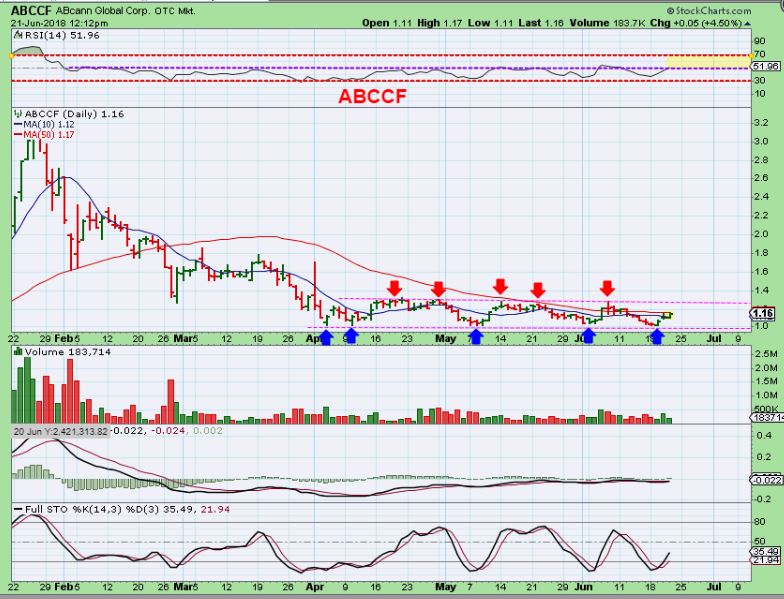
ABCCF – It is moving higher, but pushing on the 50sma at 12 p.m. Eastern. This sector is bullish and I think that this can move to the top of this trading range, and it could eventually break out & run. Big %-Gains if it does, this is a nice looking base.
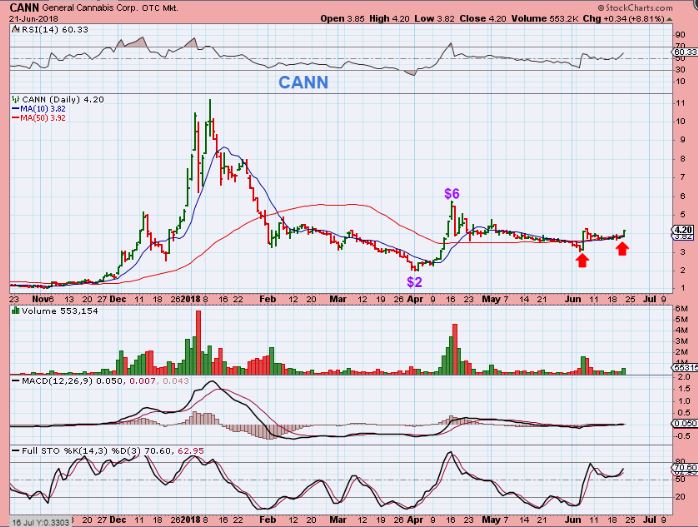
CANN – This pop looks like no big deal, but look at Aprils run. It went $2 to $6 in 2 weeks, and that is 200% gains. It then consolidated along the 50sma and the next run could be as good as the first. The sector is bullish.
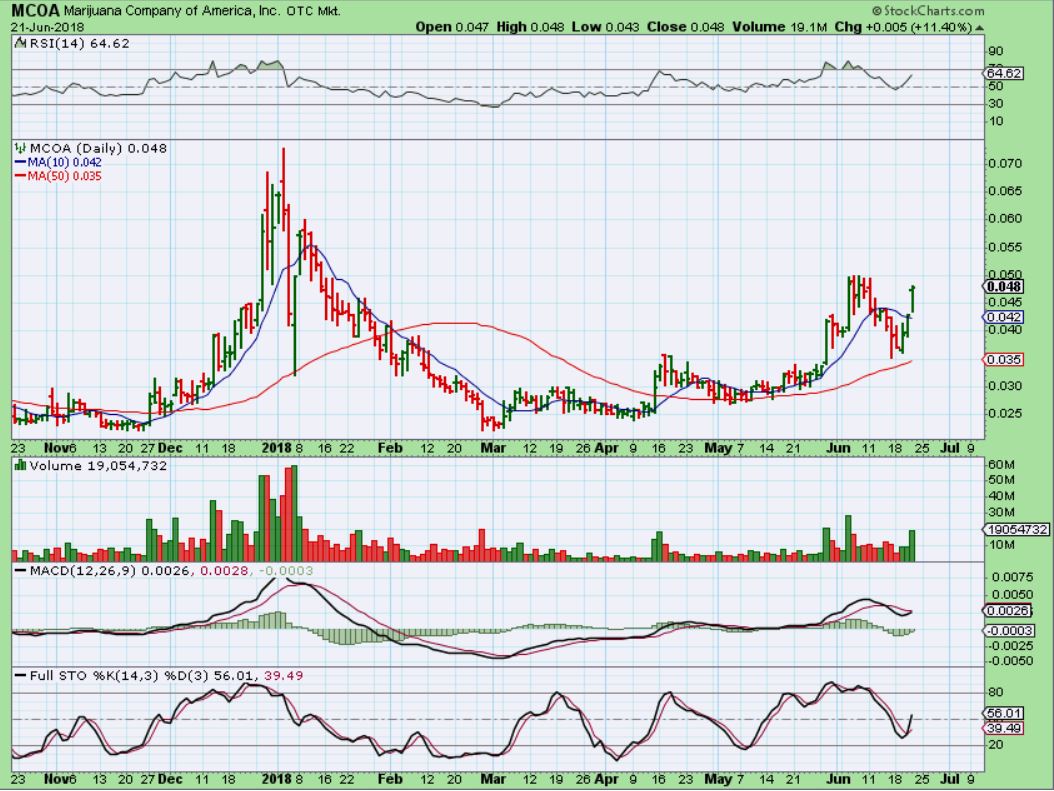
MCOA – Low priced, I do not own it, but it is up 100% since April too, and volume is growing s it pushes higher.
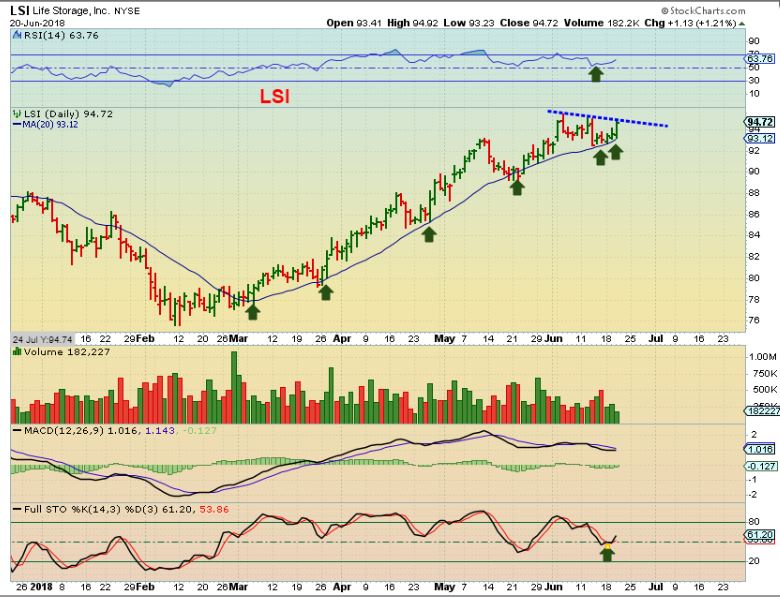
LSI – I mentioned this set up yesterday, riding the 20sma faithfully. The markets were dropping yesterday, so it could go on a watch list.
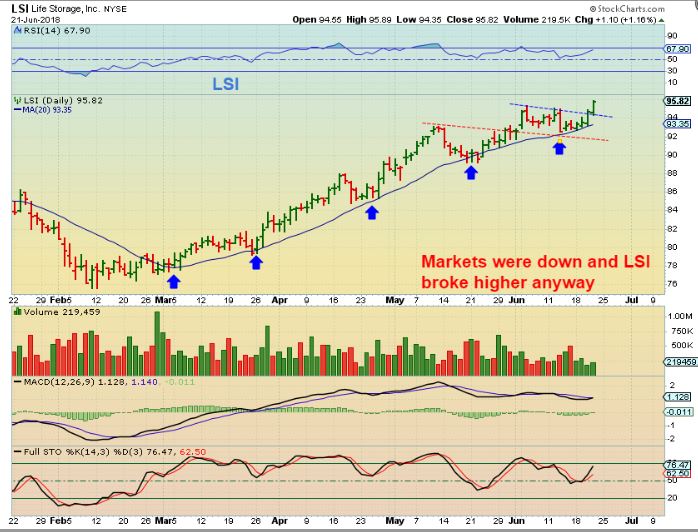
LSI– It broke out anyway. If the markets do not co-operate, it may slip back into consolidation, but that is strength, to break out when the SOX & QQQ dropped.
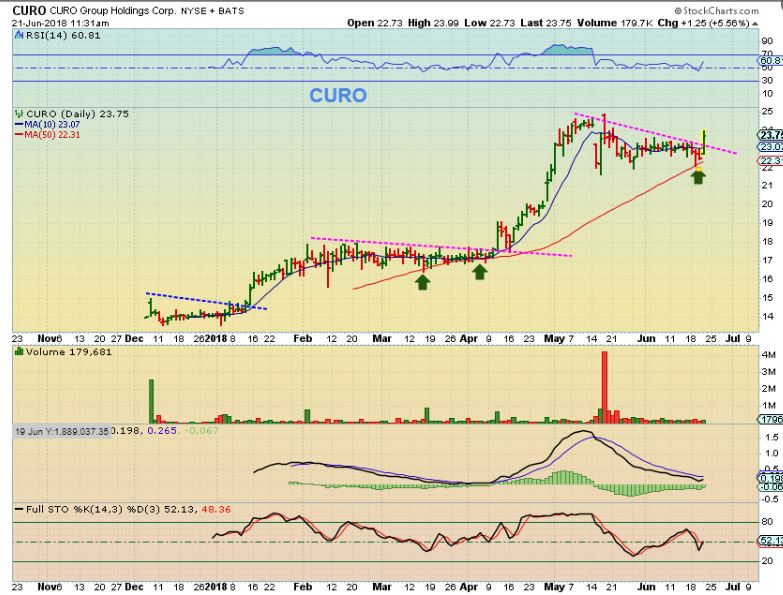
CURO – This broke out too, but dropped toward the end of the day ( I captured this at 11:30 a.m.). This is on my watch list, I traded it in April with SQ, MU, SGH, etc, etc. It remains very healthy. I’d keep it on a watch list, since it is acting very well as the markets dropped.
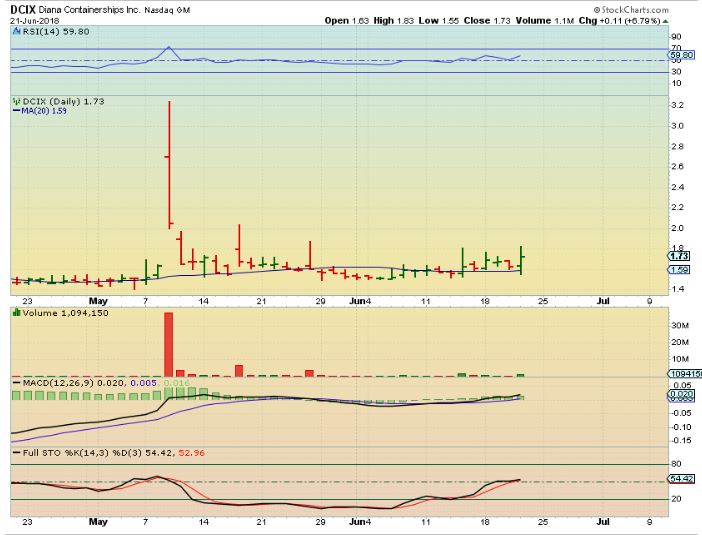
DCIX – Shippers have been running, and DCIX is trying to make a move off of this long base. It has been Popping, but can’t seem to get the follow through yet. I like the base and if it starts running, it could make a good trade for our traders.
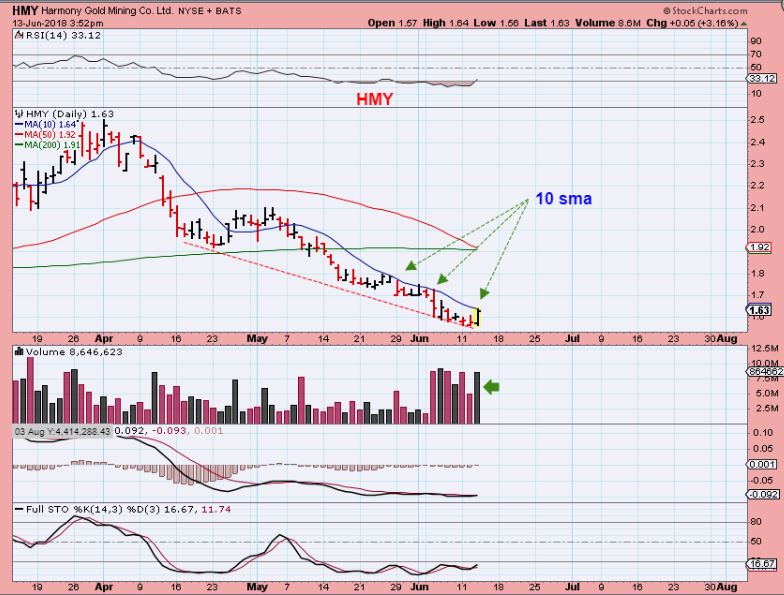
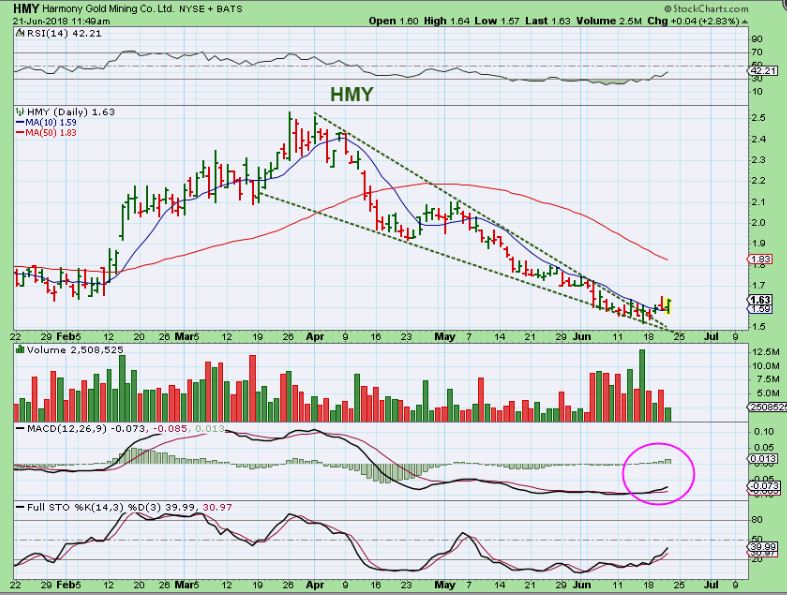
HMY – A week ago Wednesday I mentioned HMY pushing on the 10sma.
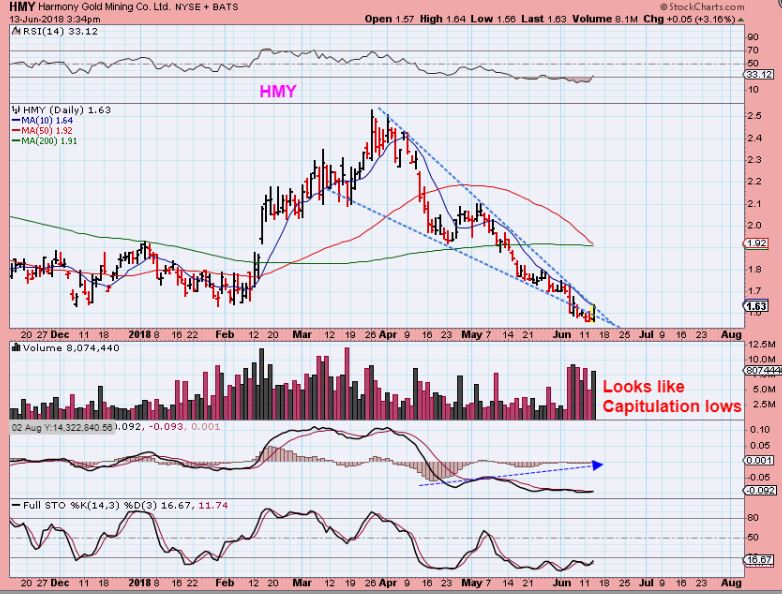
HMY – I used this chart on the same day, a wedge pattern with Capitulation and possibly forming its lows.
HMY – It is at the exact same price ( $1.63), but because it went sideways, it is now beyond the 10sma& outside of the wedge. If Gold has bottomed, this may run right out of the lows with Gold.
,
Enjoy your Friday Trading, and we’ll see how GOLD acts after that reversal on Thursday.
.
~ALEX
.
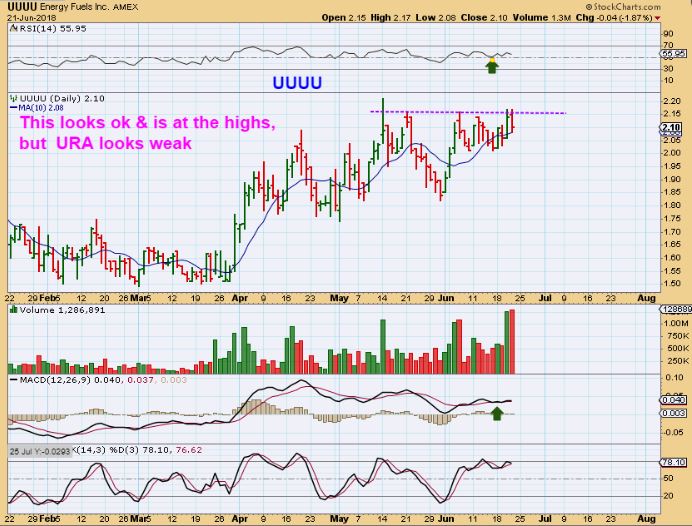
I discussed the Uranium sector acting bullishly recently. URA has been acting weak, so I wanted to discuss a couple of Stocks in this sector. I owned but sold my UUUU.
.
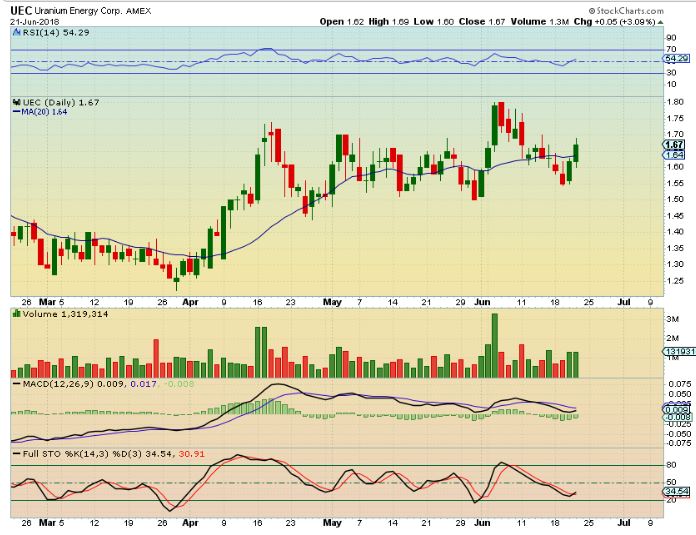
UEC – Uranium stocks like UUU and UEC still look fine, but URA ( the ETF) dropped below support of the 10sma and has been selling down. UEC & UUUU look ready to move higher.
UUUU – I owned this one. This looks fine, is at the highs, the RSI & MACD are still healthy too, but URA looks weak. If you are still holding it, it may be fine but be sure to watch It. Stay Frosty. Sell if you want.