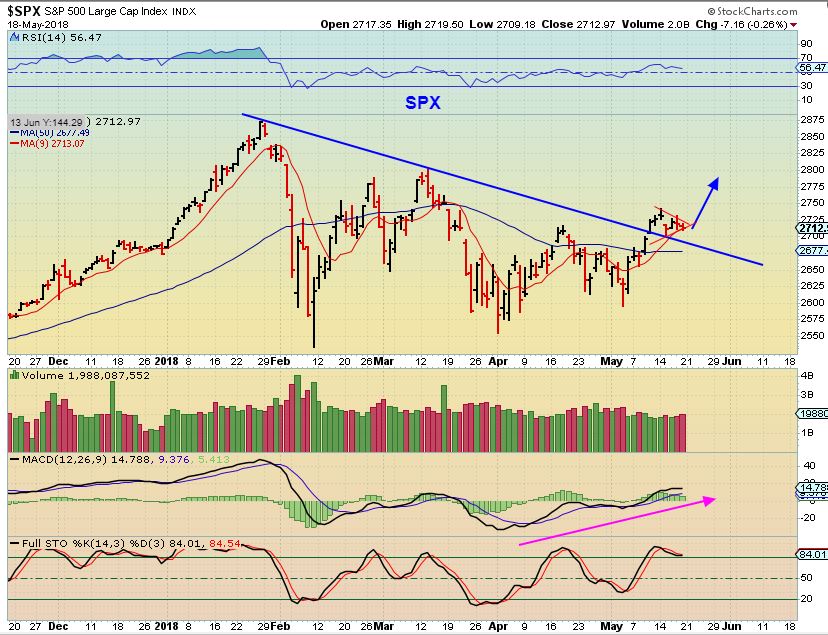
SPX #1 – We saw the break out & Bull flag. This was Bullish.
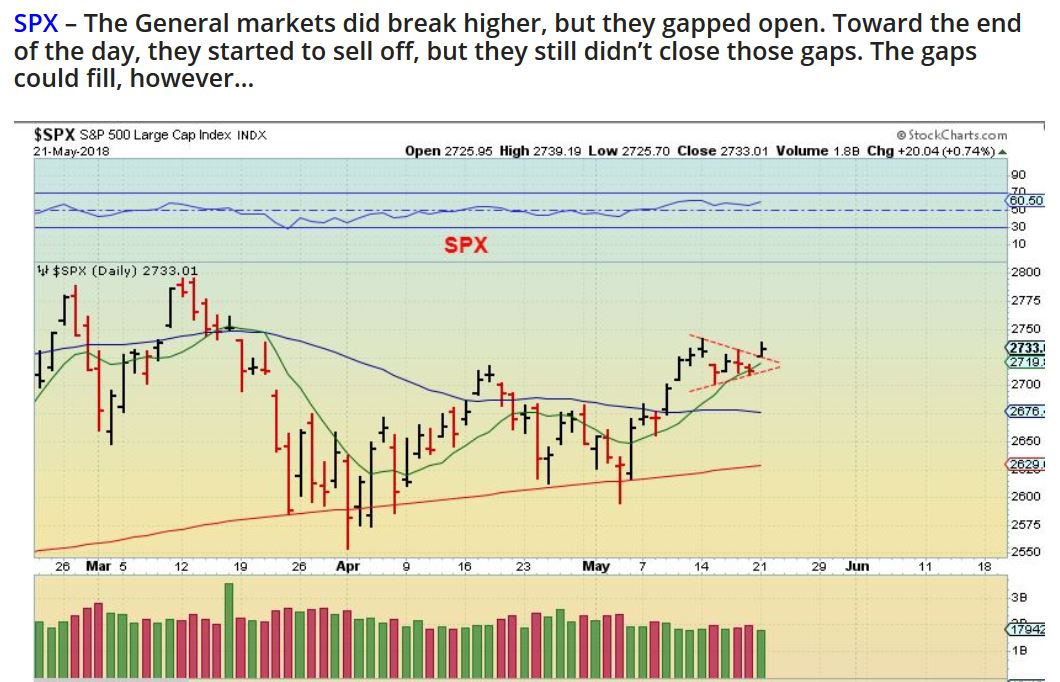
SPX #2 – Here I mentioned the GAP open, and the gap may need to fill first…
SPX #3 – Now we got our gap fill and then a reversal higher after the FOMC Minutes release, so …
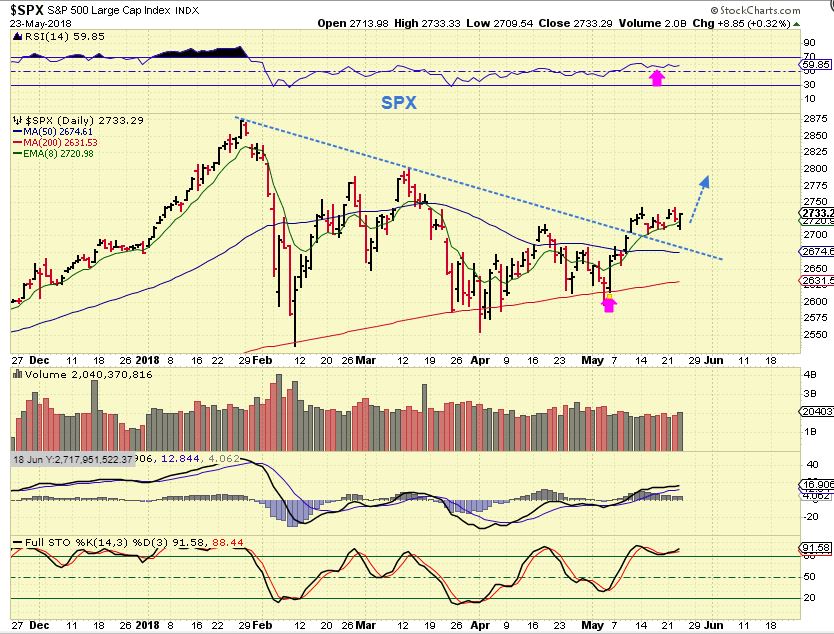
So the TQQQ, UPRO, etc trades mentioned last week are still in play, there was no stop out.
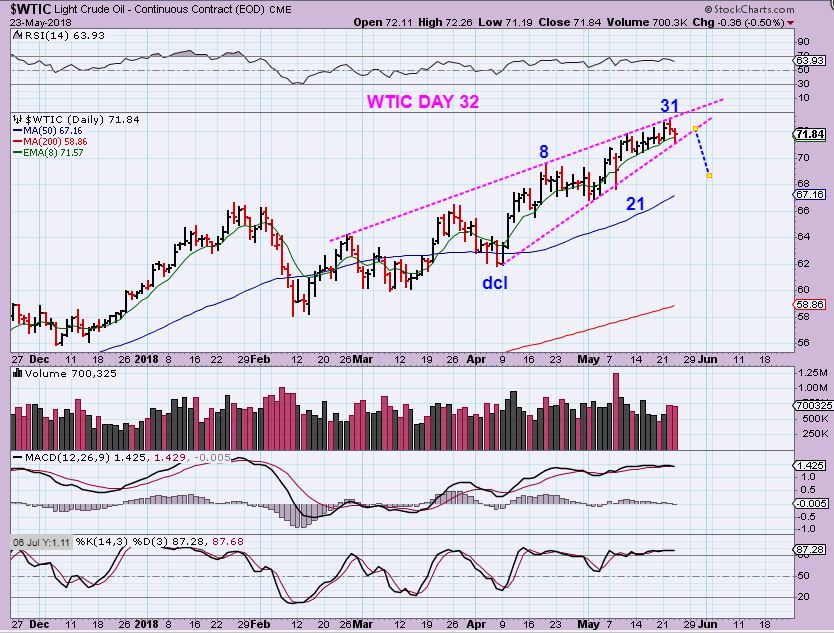
WTIC – Our rising bearish wedge is running out of room. Oil has peaked on day 31 so far, and our targets were $72 & 74 short term. A day 31 peak will be right translated, so I expect Oil to move higher again after it does dip into a DCL ( Dip to the 50sma?).
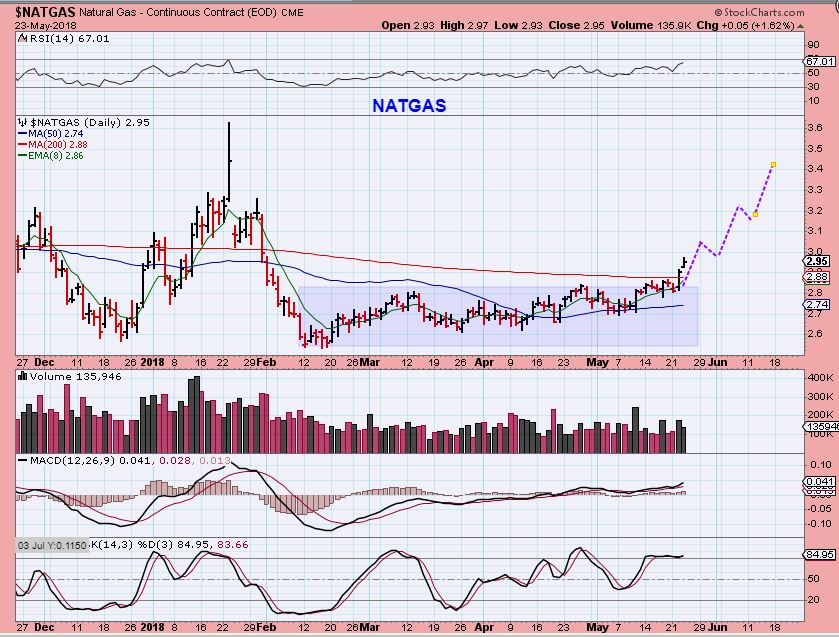
NATGAS – This base should offer a run back to the highs, similar to what we saw in XLE ( Next chart).
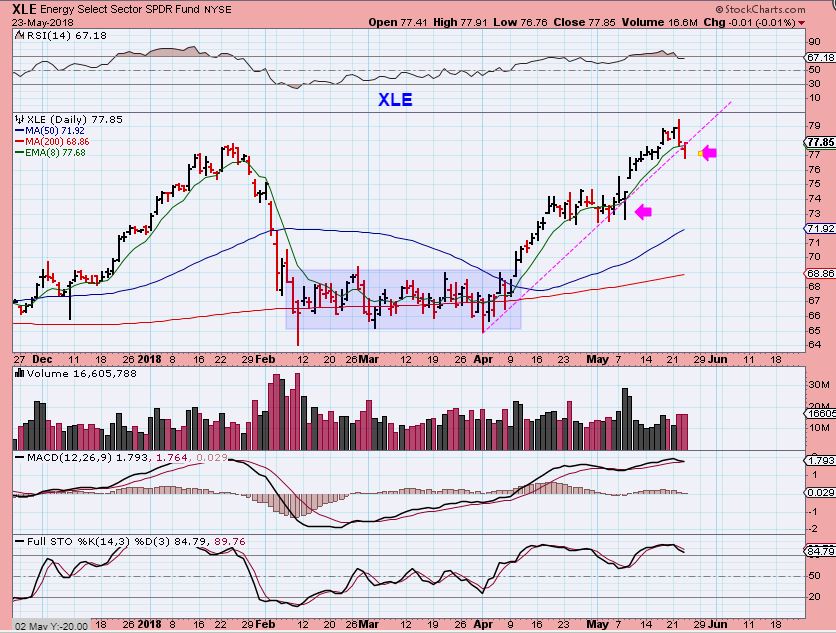
XLE – After breaking out of that base, we got the run to former highs
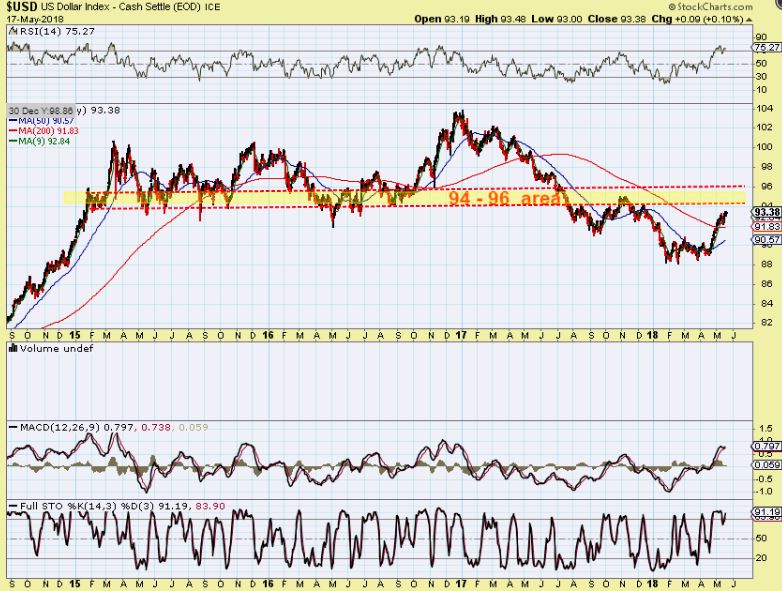
USD – This was a Big Picture of the USD , showing a resistance area at the 94-96 area.
USD – The USD hit 94.11 yesterday, so it is within that area. We are waiting for the USD to top & drop, and for Gold to then Pop & Run out of an ICL.
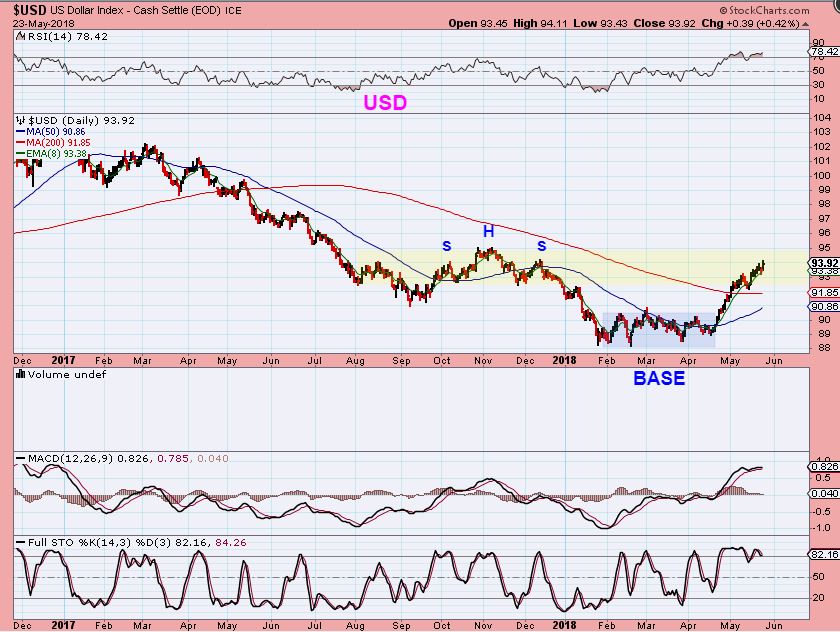
If the USD is close to a topping area, Gold could be close to a low. I want to discuss GOLD CHARTS as being near what should be the lows.
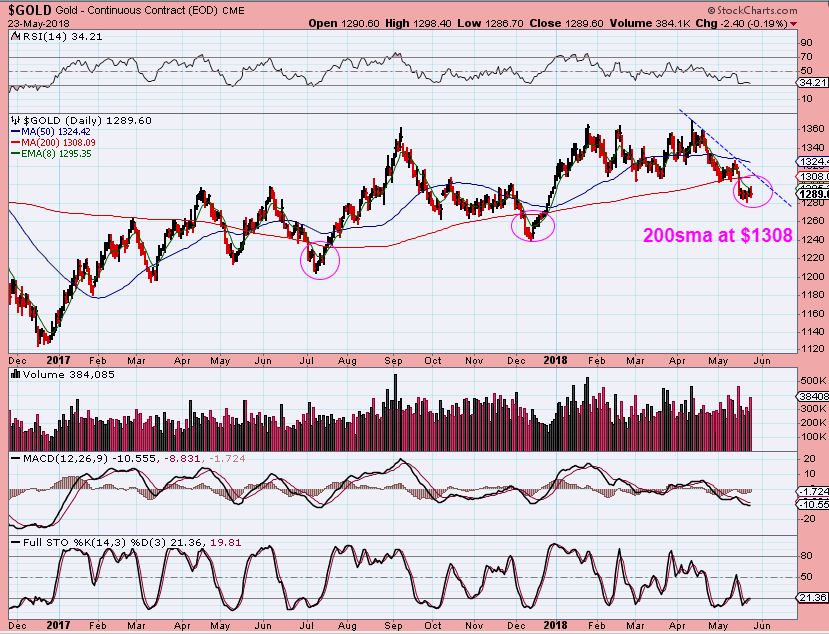
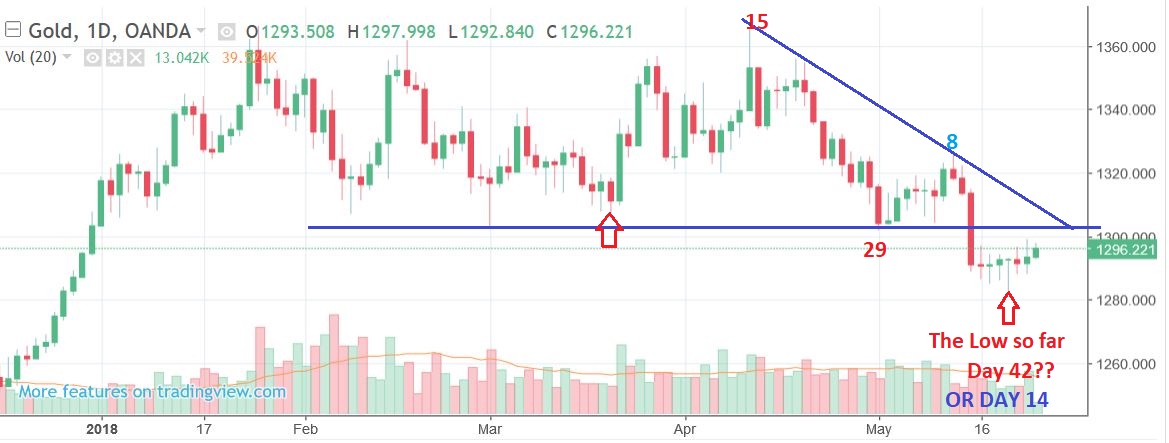
GOLD– All things aside ( meaning that for this chart we will ignore cycle count for now), if GOLD gets back above the 200sma and especially that blue down trend line, GOLD IS BULLISH. I do expect another drop when I’m using cycles for timing this low, but I just want to point this out here. A move higher would be a ‘shake out & recovery’ in my opinion.
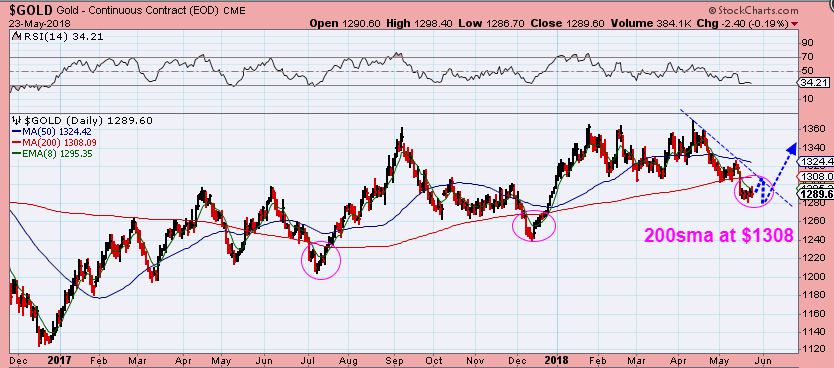
GOLD– So basically this is what I would expect using cycle counts, a bounce & a final drop into an ICL, to shake out any new buyers. At this point in time it does still seem slightly early for the ICL to be in place yet.
CLICK THESE CHARTS TO ENLARGE IF NECESSARY
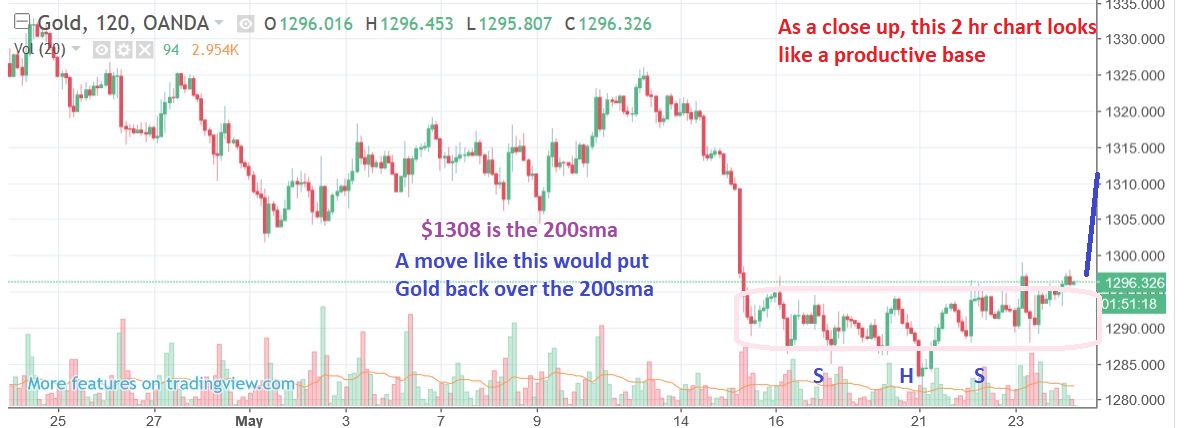
GOLD– When I zoom in, I see a nice looking base on a 2 hr Gold chart. This could push Gold higher. The 200sma on GOLDS daily chart is at $1308 and that down trend line looks to be around $1310, so I am watching this area.
GOLD– So this is what I am expecting due to cycle count, similar to the move higher in early May, but if this down trend is taken out, it needs to be viewed as bullish. I have drawn what I would expect though, on this chart. A pop & drop 1 more time.
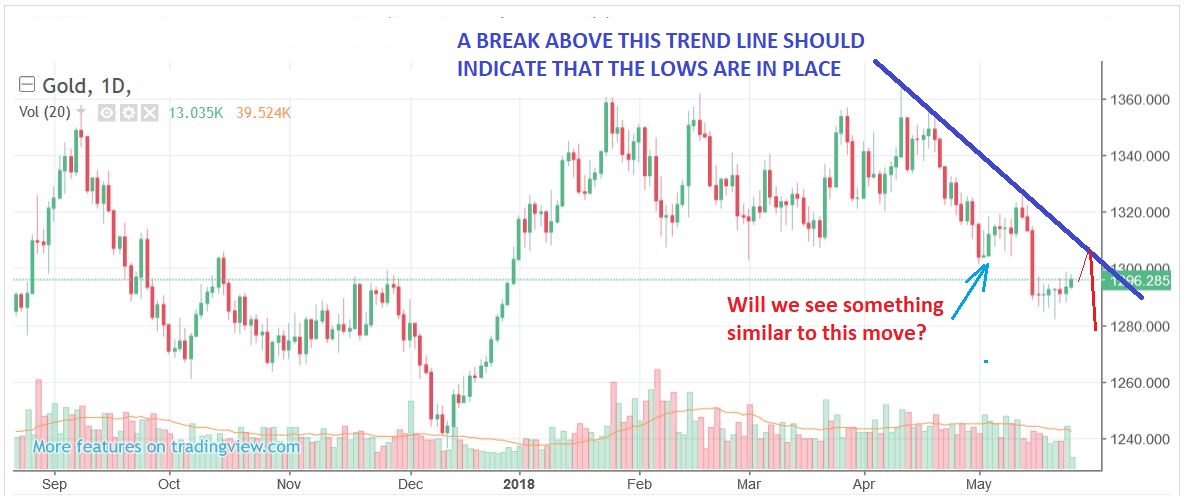
GOLD– So zooming in and using cycles, I want to point out why a break out now seems less likely. A move above this down trend area would not make sense if I have a day 8 peak and a day 14 low, because we would have a Right translated daily cycle, and you don’t see that on an ICL. I would like to see these lows taken out for that reason & clarity. IF THIS BREAKS OUT, then we may have that day 15 peak on a 42 day daily cycle, which is Left Translated ( I labelled it ‘less likely’ in past reports). I have numbered that count in all RED.
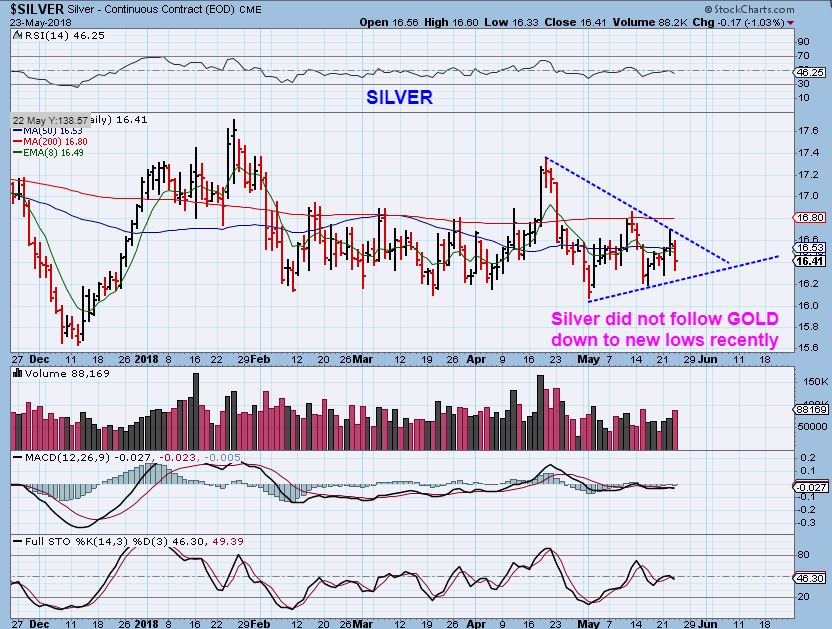
And of course SILVER & MINERS have been holding up at the lows. I have mentioned that this gives us a bit of a mixed picture, showing strength, even with that USD rising & GOLD dropping down. Let’s take a look at SILVER & MINERS…
SILVER – Higher lows while Gold was selling off, a good solid drop would help to clearly see an ICL. I just don’t know if Silver will break down further or not, but 1 quick slam would be perfect to run the stops.
GDX #1– GDX did make a new low yesterday and then put in a good reversal. This looks like a bullish move and normally I would have bought this as a trader, but lately each day is a different direction. You can see Friday was a reversal higher. Monday was a move higher, Tuesday dropped , Wednesday hit new lows & reversed higher. It has basically been a sideways move.
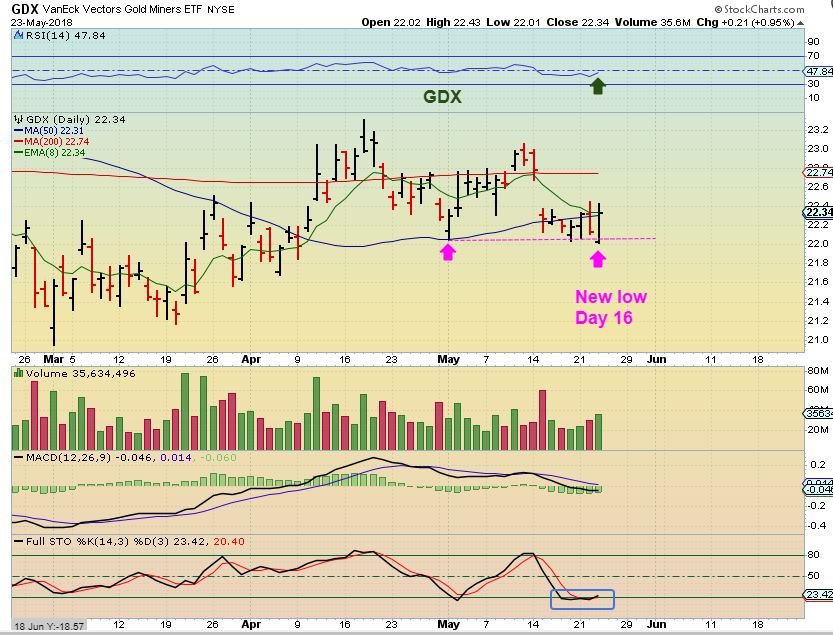
GDX #2– This move was after the FOMC MINUTES, and they really seemed to have mentioned not fighting inflation aggressively. That is Bullish for Precious metals in my opinion. Will Miners pop & drop as shown? If Gold has an ICL ahead, this is my best guess. Anyone that wanted to BUY This reversal could do so with a stop under Wed lows, and raise it immediately. I do it still anticipate a drop soon, though, but this is a tough set up with Silver & Miners holding up well.
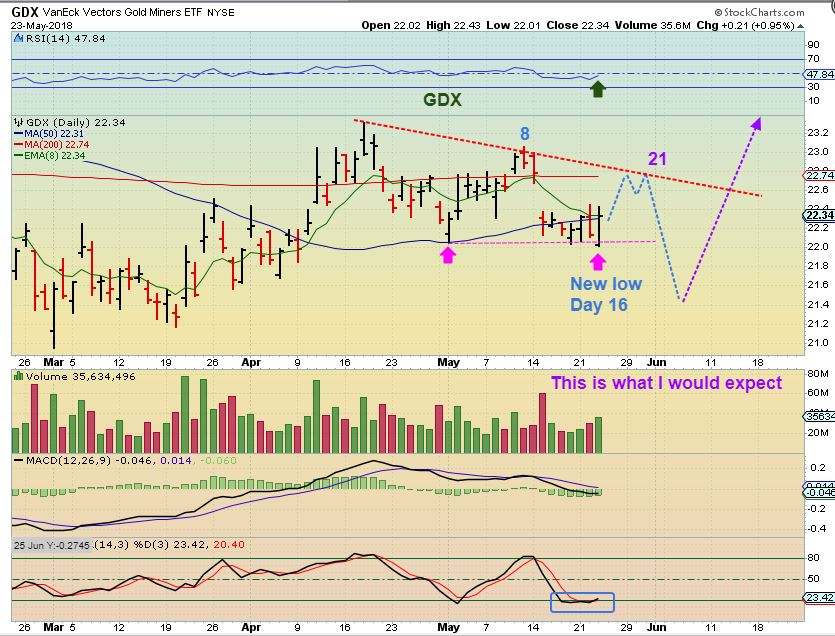
GDX #3- I just dont think we will see this, since day 16 broke the dcl lows ( I forgot to remove the purple writing, that was from the above chart)
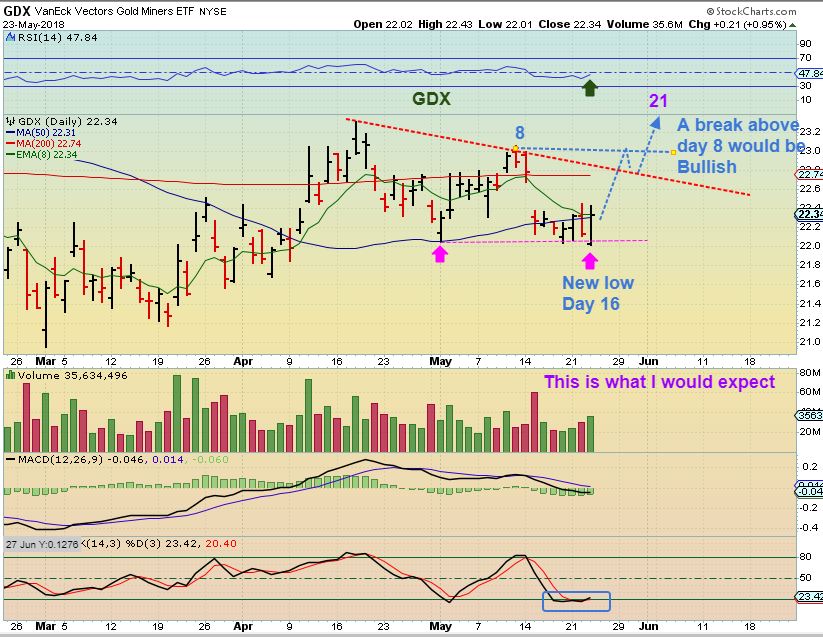
So we still need more time to see how things play out in the Precious Metals sector. I know that I have been hearing about a lot of people on Twitter buying this area for Gold already. If we get 1 more slam into an ICL in the next week or so, there will be a lot of stops run, and that usually does happen at ICLs.
On the other hand, If GOLD breaks above the 200sma and down trend line pointed out in GOLDS CHARTS in todays report, it would look like a shake out took place, and that would look to be the lows in place. We would simply have seen a milder ICL drop that took place a week ago (Less likely). I still find that less likely, the way things are set up. The above report lays out the parameters that I am watching for Gold.
~ALEX
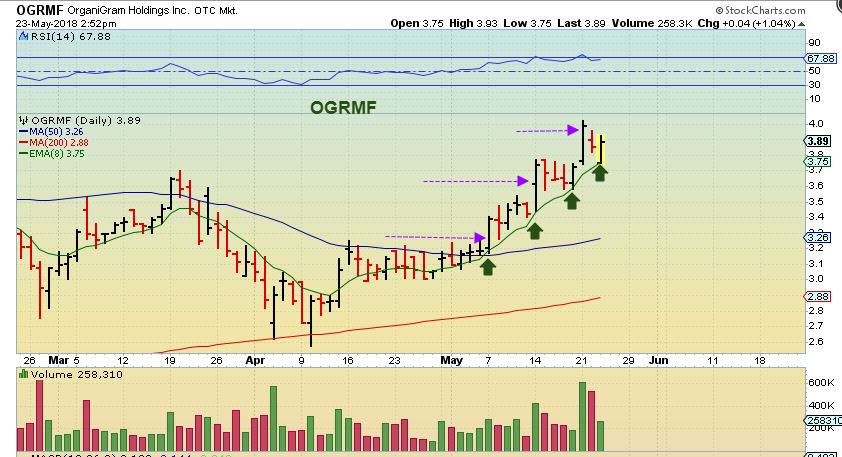
OGRMF – This is still acting like a normal bullish move higher, running along the 8 ema.
WEDNESDAY MAY 23rd – Hump Day 
 FRIDAY MAY 25th
Scroll to top