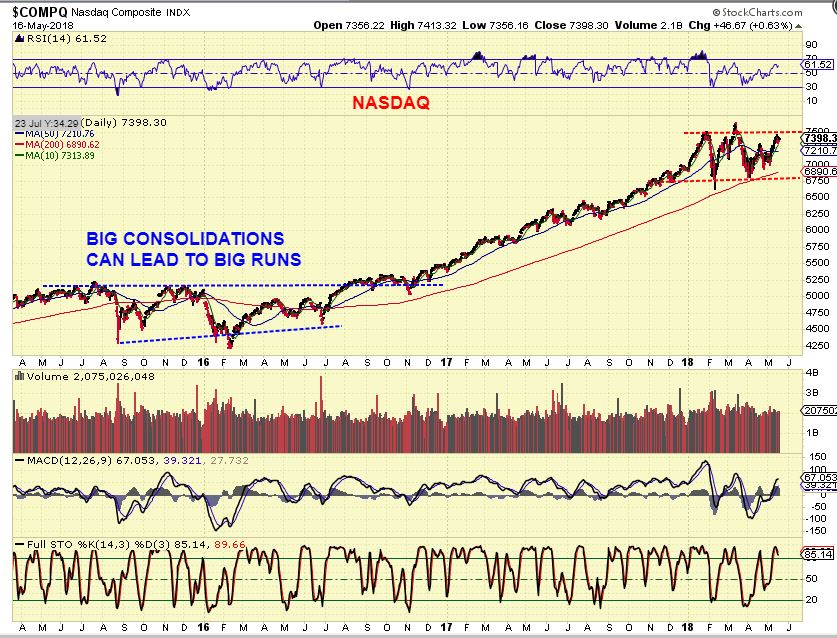
NASDAQ – I mentioned months ago that it looked like we could be starting a consolidation period ( or a topping process) in the General Markets. You can see that we are doing just that. I also mentioned that it is possible that individual stocks may do well, so we will briefly discuss some individual stocks later in the report. Also if this, over time, breaks out to new highs, it would be very bullish.
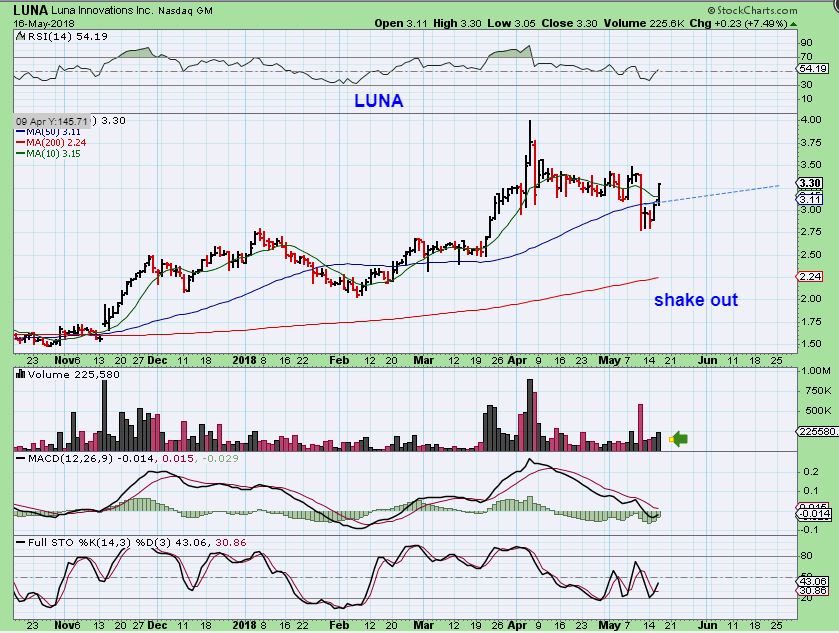
LUNA– I owned this in early 2018, but only as a short short term trade. It dropped below the 50sma and seems to have been a shake out, since it recovered. Earnings already came out, so this could be bought right here, and a stop under the 50sma makes it low risk.
QD – I would put this on my watch list. It was quite bullish in Jan – March, but then it dropped from $17.50 to $9.50 in 2 months. Now it has a round bottom base and regained the 50sma. It looked like a recovery story, BUT— Earnings come out next Monday. If they improve, I think that this will run back to highs. Big gains.

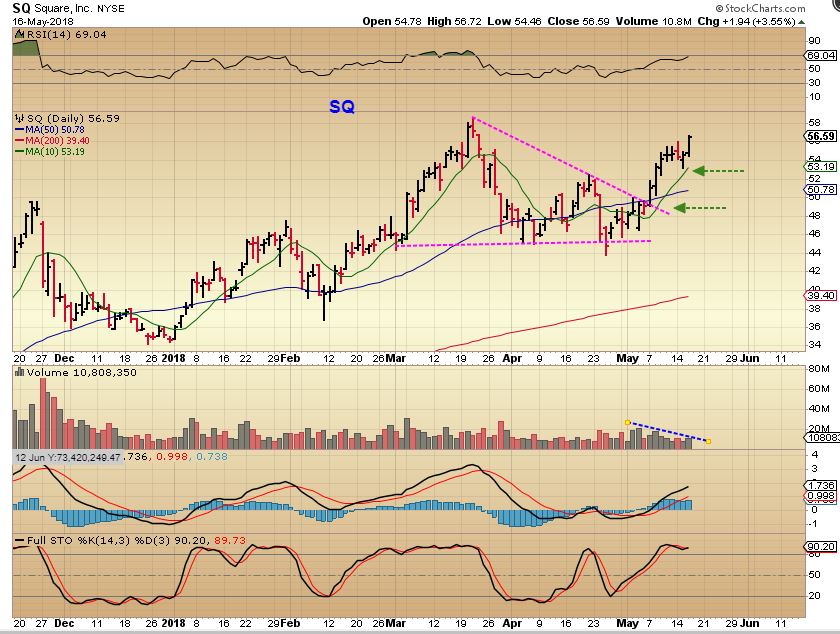
SQ– This break higher was a buy on MAY 7th

SQ– Continue to hold if you bought it, it is forming that cup as expected. NOTE: I dont like the volume dropping as it gets to highs though. If that continues for the rest of the week, I PERSONALLY ALWAYS SELL IT.
MU In yesterdays report
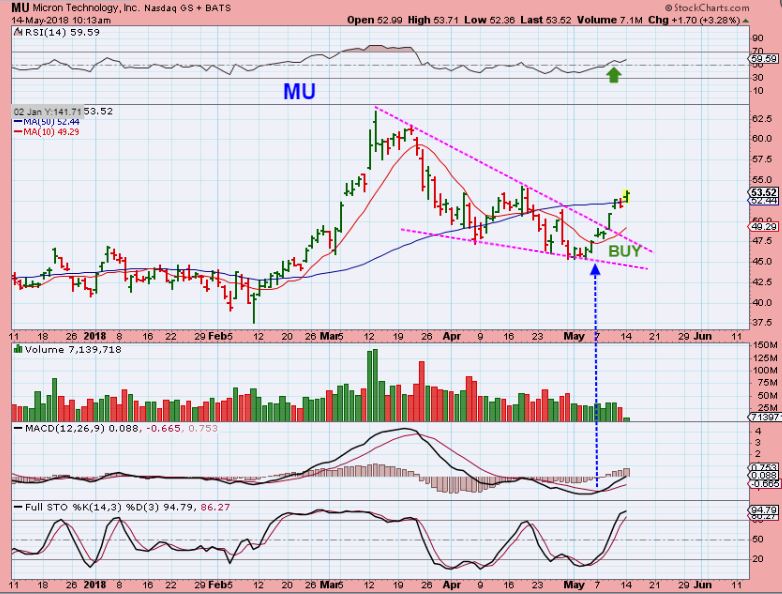
MU – This also continues higher to the former highs. If the gap fills and 50sma gets re-tested, you could buy it there and try to ride it from $52 to $62.

SPX – I still expect a dcl on the 50sma soon.

WTIC– Day 28, I still expect a pull back here as this wedge hits the Apex. ( $52 – $54).

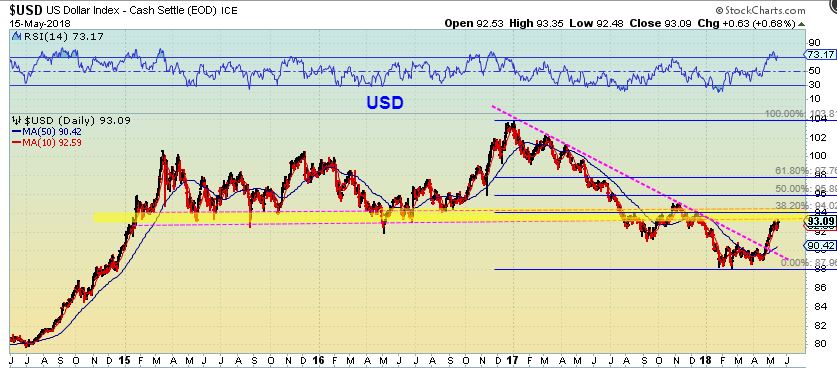
USD – From yesterday, the USD ran a bit higher on Wednesday.
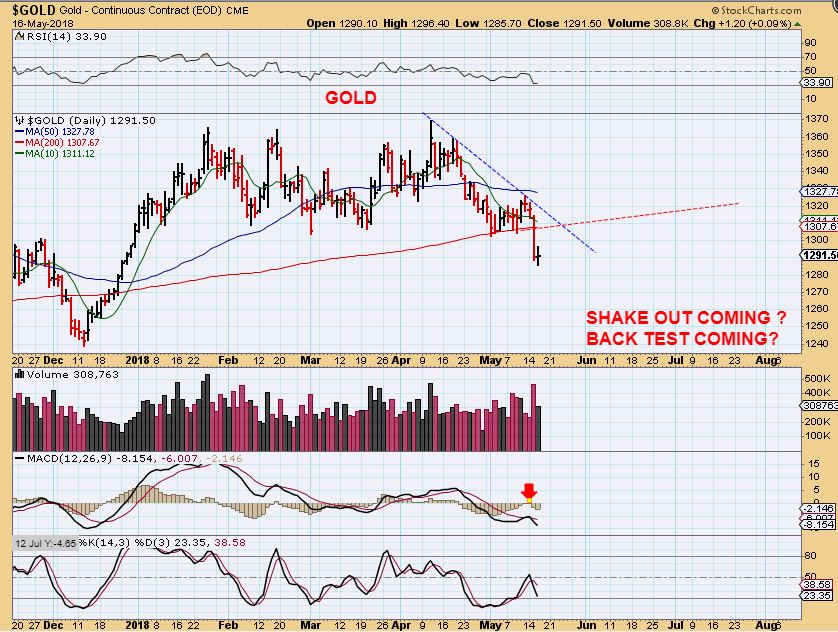
GOLD – Gold put in a doji. This can lower the parameters for a swing low, but I still think that it is too early. Instead, yesterday I called for this pause when I mentioned…
GOLD – I posted the ICL in Dec as a drop, pause, drop, pause, drop etc. We now have a drop & a pause, so we’ll see what happens.
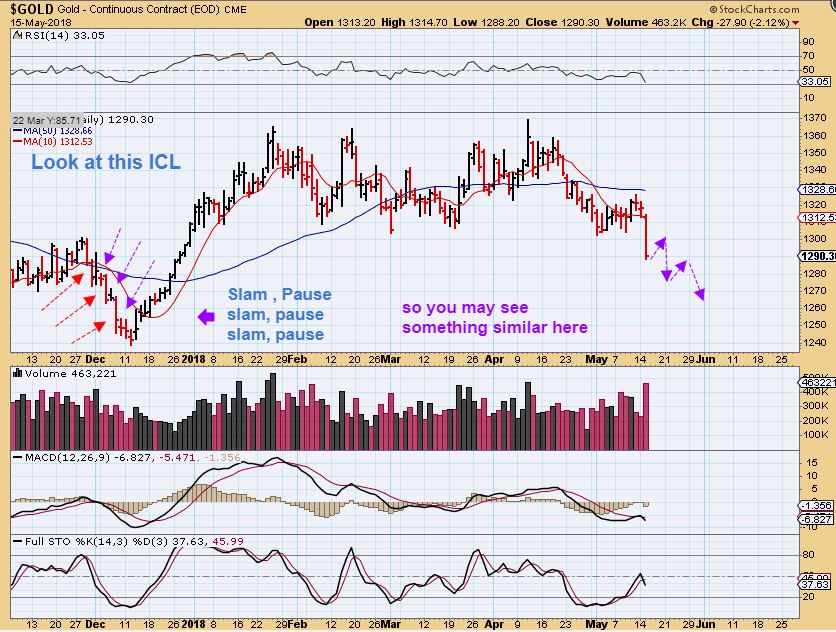
GOLD – I also mentioned that a back test of the 200sma can buy time, so that the ICL doesn’t break DEC lows.

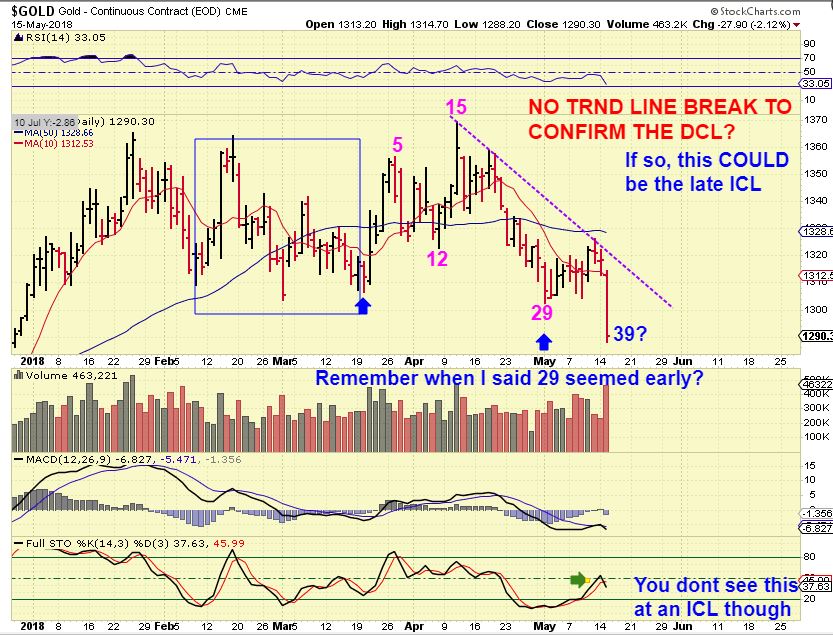
FINALLY, GOLD as an outside possibility to keep in mind : I posted this yesterday, that GOLD never broke the down trend line to confirm a dcl. So IF this count was true, we would have a day 40 low now. Since Miners did not sell off with Gold, it is an odd set up. IF GOLD SNAPS BACK, that may be a shake out.
AND MANY MINERS REMAIN HEALTHY
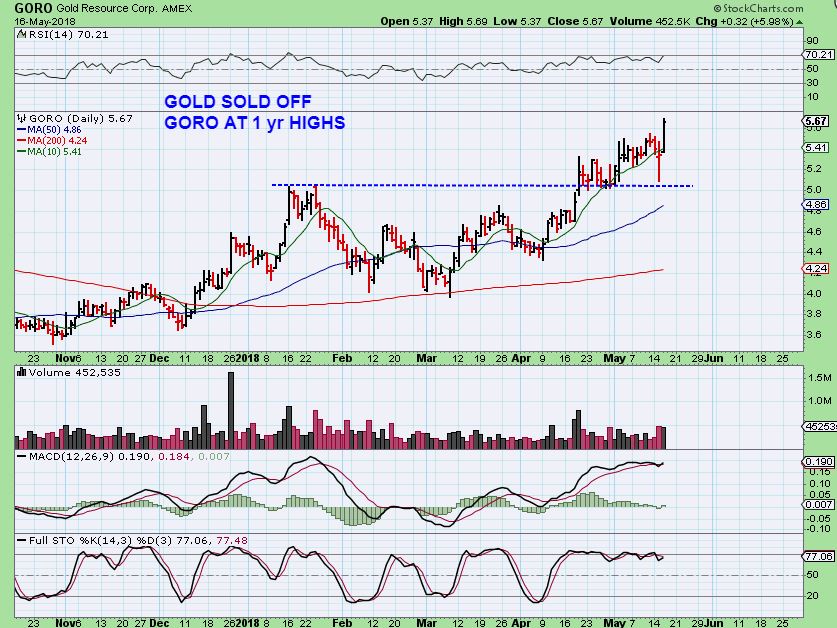
GORO – While GOLD sells off, LOOK AT GORO. NEW HIGHS. Some Miners are very much out performing now, and this should help us to see that the next ICL for gold should be an EXCELLENT BUY for Miners.
AG WEEKLY – Look at the RSI. We are seeing bullish change in these Miners.

MAG – MAG looks ready to break out too. This is Silver, but basically shows that some of the Miners have ignored GOLDS break down below the 200sma.

And that is encouraging. Below I will discuss some trade set ups as we continue to watch and wait for what could be the last great buying opportunity in Miners. Enjoy your Thursday trading!
~ALEX
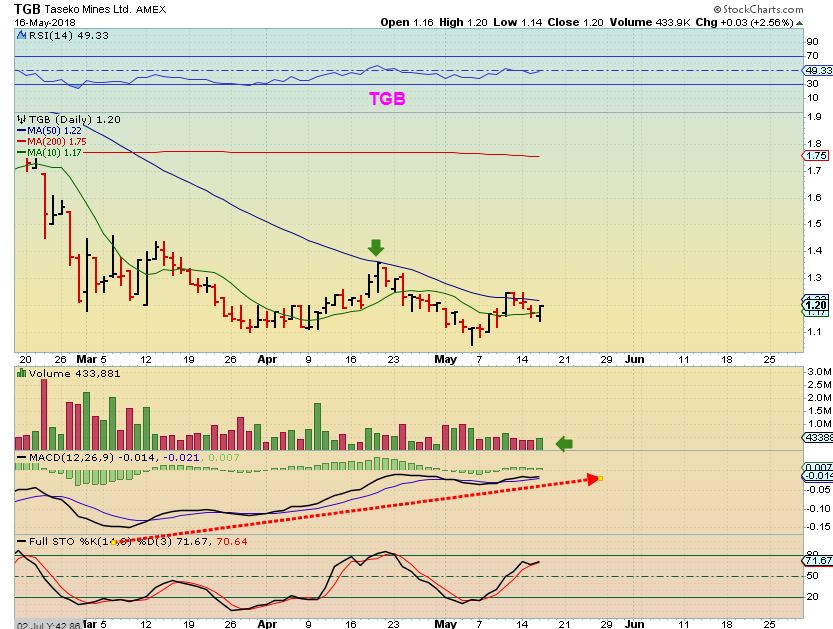
TGB – Talk about FRUSTRATING! I have been pointing out TGB for a couple of days. I decided to buy it ahead of a break out above the 50sma yesterday. I put in a limit order at $1.17 and had to leave for the day. When I came home, TGB had surged higher in the final hour, and it only filled a small partial of my order 🙁 I own 1000 shares of TGB, but want more. This looks ready to break out higher, doesn’t it?
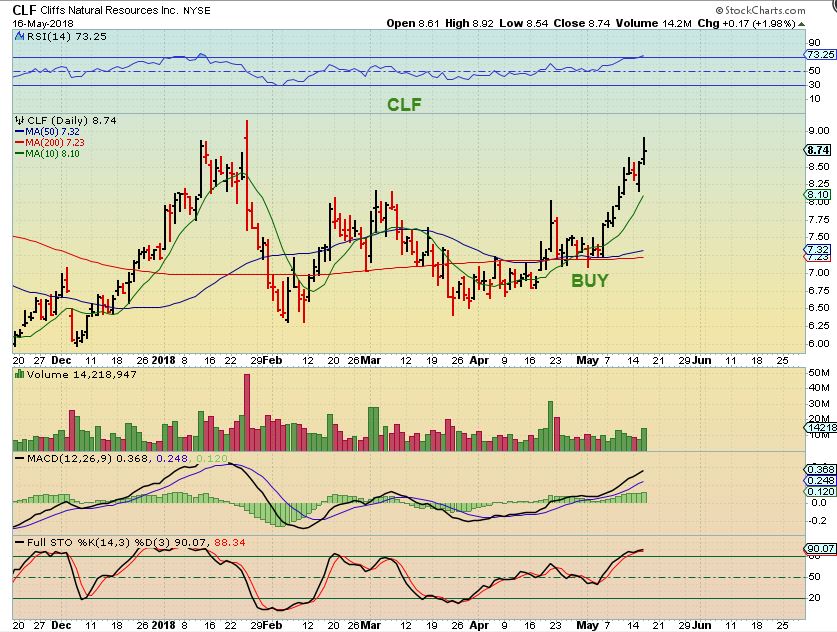
CLF APRIL 18 – This was a BUY and I posted it in the April 19 report. The set up looked proper, and this should run to prior highs of $9 minimum.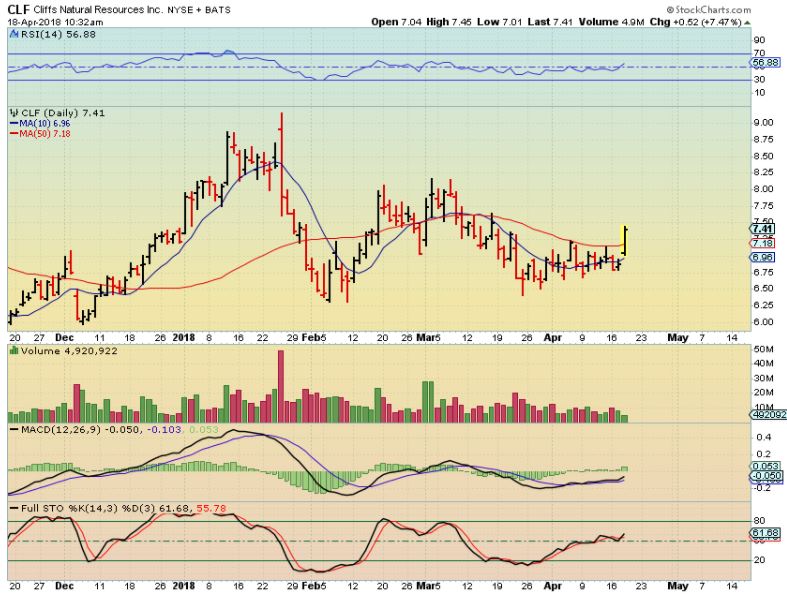
CLF MAY 10 – Last week I posted that CLF is getting follow through and other ‘Metals’ stocks are starting to look good too, like X, AKS, etc.
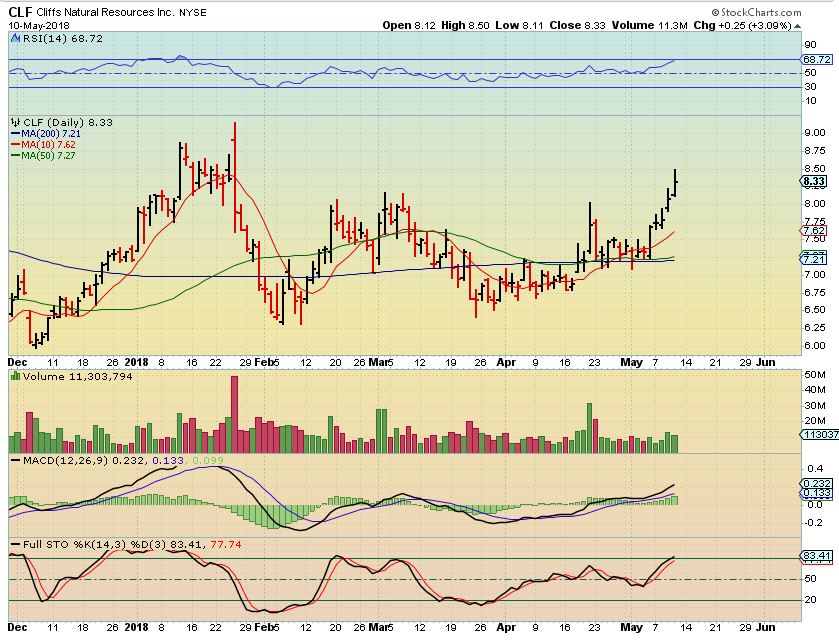
CLF– CLF continued higher to the former highs of $9. It could form a handle when it gets there, or it may just break out.
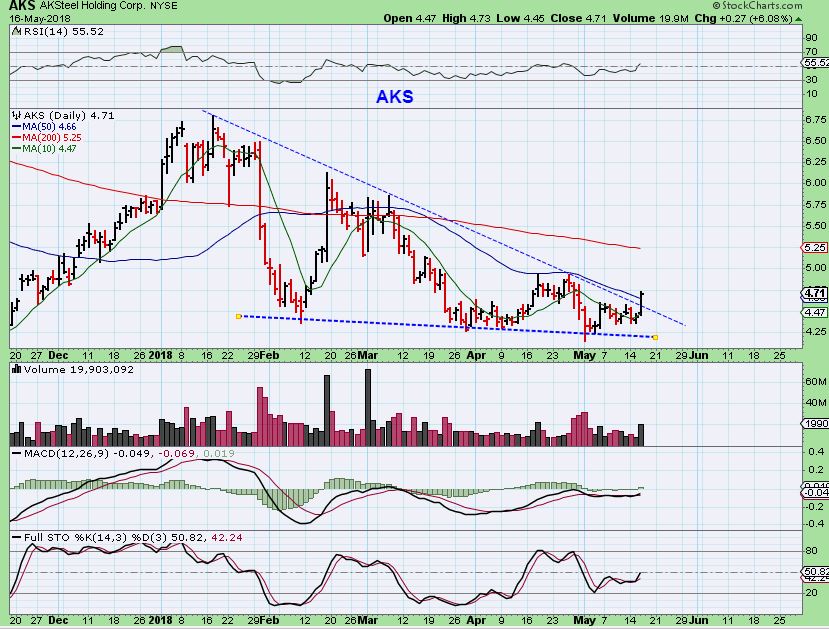
AKS – Breaking out, this is a buy.
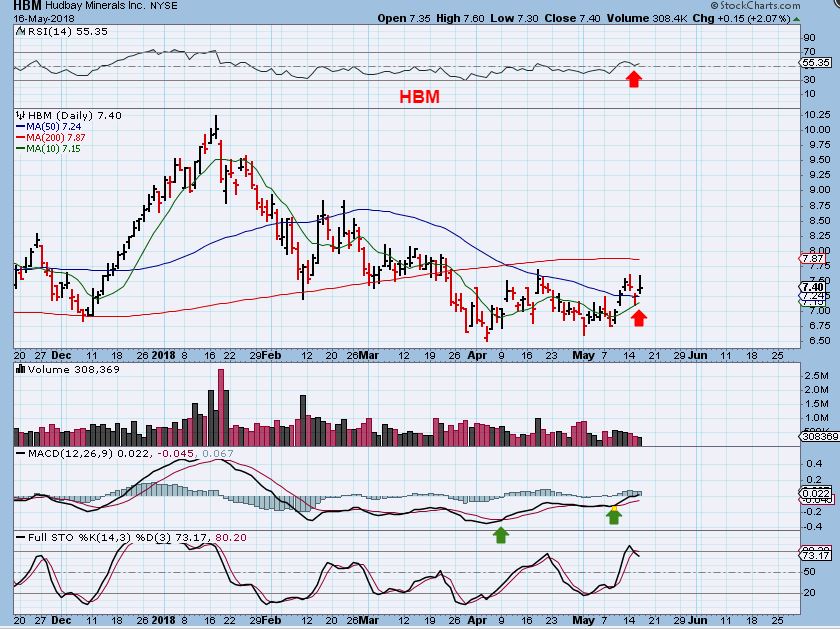
HBM – HBM has been in recent reports too. It has moved above the 50sma, and needs to break above the 200sma, and then technical traders will really step in if conditions are right.
X- US STEEL – X tagged the 200sma, and that held as support as a first buying opportunity with a close stop. It is now breaking above the 50sma after a 4 day pause underneath that 50sma. Another buy with a low risk stop.

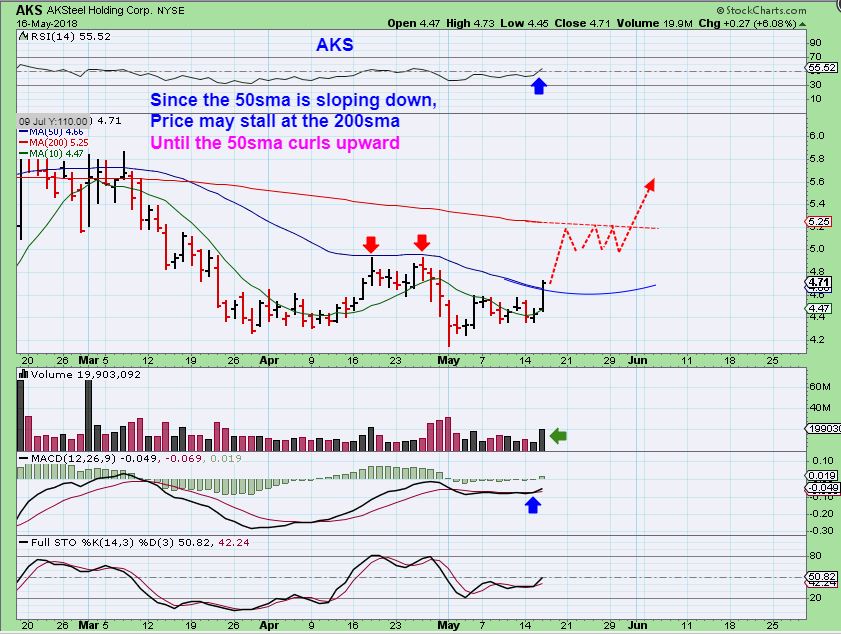
AKS – AKS popped out of a consolidation and broke above the 50sma. When the 50sma is slanted down, I find that price often runs and drops back to ‘test’ it, but this may just run to the 200sma and crawl, until the 50sma curls upward. It is still a buy.
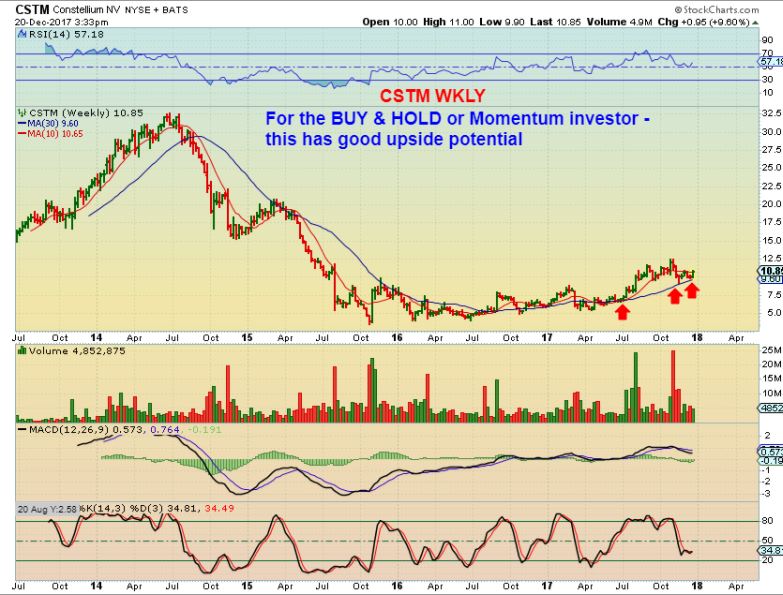
I LIKE CSTM FOR THE LONG TERM-
CSTM #1 – Last DECEMBER, I pointed out that I really like the Big Picture Chart of CSTM as it ran from $5 to $12.50 & pulled back to $10. It was in a consolidation phase, but looked ready to go again. It then ran to $14 and is now at $11 ish again. I believe that it is a good long term buy & hold, let’s zoom in.
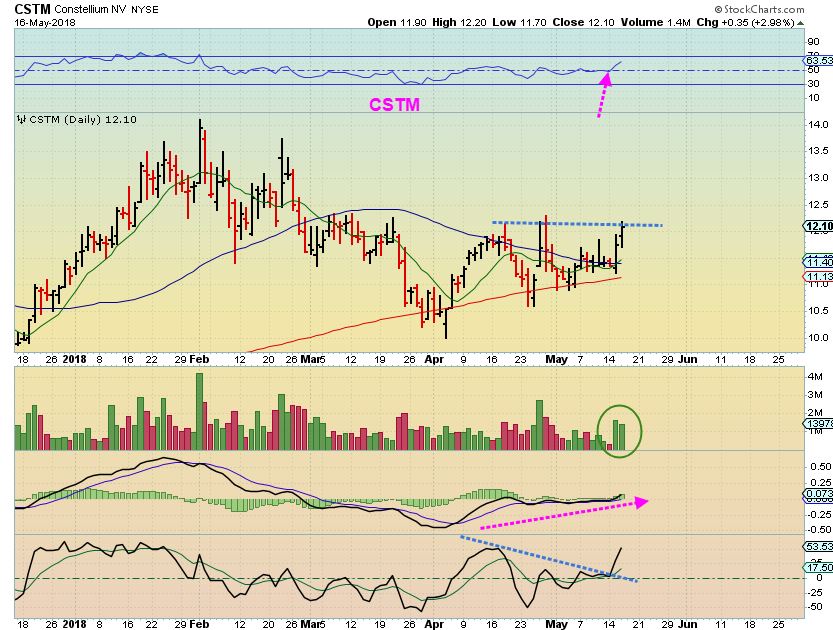
CSTM #2 – So it ran to $14 in February, and dipped to support at the 200sma. It is at the 200sma now. Shall we zoom out again to see the potential the BIG PICTURE? Chris? My long term patient buy & hold guy. 🙂
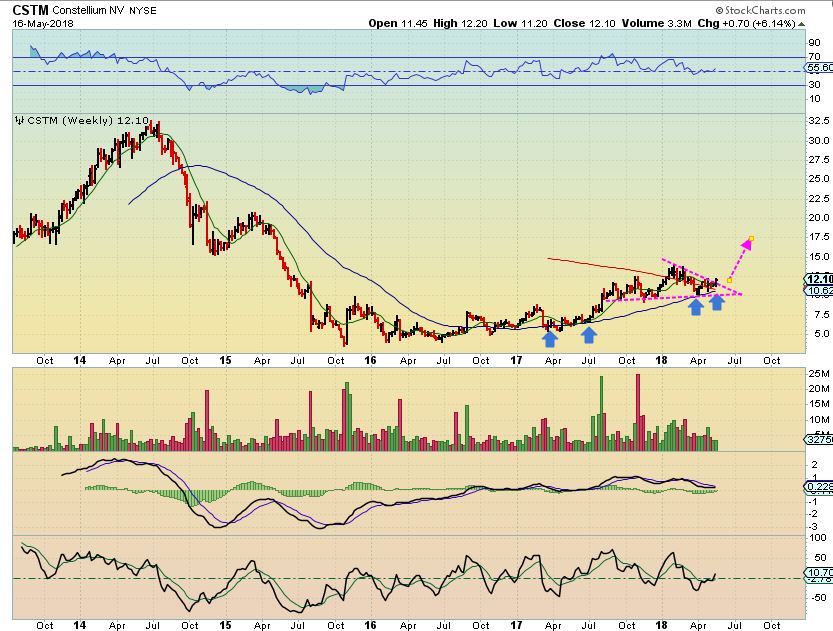
CSTM WKLY – This looks to be breaking out from a down trend line in that almost 1 year consolidation, and this has great potential.
LUNA – Just a reminder, LUNA looks to be recovering as a low risk buy here. MAY 2 was earnings release, and that gave it no reaction. I don’t know why it dropped on May 11, but it has recovered.
QD – ALSO QD for the watch list. EARNINGS ARE NEXT MONDAY.
IPI & ENPH are playing out very well
Wednesday – When Painful Cracks Appear 
 FRIDAY MAY 19th
Scroll to top

Great report, clear and concise. I see Bob Moriarty says the DSI is finally at 10 on both gold and silver as of a couple days ago. It can go lower, but he has been waiting patiently to buy until it got here.
http://www.321gold.com/editorials/moriarty/moriarty051718.html
To me, it feels like we have lower to go first, but it would be nice if I was able to avoid stopping out considering Moriarty has been pretty accurate on the major turning points the last two years. I would hate to have to exit just before they turn up.
Interesting!
I think so as well, though it might be more of a general area as in the next few weeks or month, rather than somebody rushing out and having to buy today. When these guys make big calls, I wonder how they decide what specific day to start buying, or do they just start small now and keep adding over 6-8 weeks?
Just an FYI to help the readers here–
That DSI can drop under 5 at an ICL too. I use sentiment as an indicator, like a contrary indicator, but not an exact timing tool. Same as BPGSM, etc.
So if anyone was to think that sentiment is a good timing tool, and bought JNUG when DSI went under 10- they could watch JNUG drop $3 or more from there if Miners got caught up in the ICL sell off
Hyst a heads up for those not understanding sentiment. .
Oh yes, I know. But it’s one more indicator that says we’re getting close. I’m thinking the stochastic says we have a ways to go also.
Yes, I posted under your name just so it would be on this thread, but not posted specifically to you.
Some readers might read that someone said DSI under 10 means we are at a low- and start buying right before a deeper sell off. I’m just posting a cautionary note. = )
It can go lower at an ICL.
Yes, more of a general area than a specific trigger. We are getting close, but probably not there just yet.
Even though I often look at the FOMC Mtg as a trigger, it may be sooner than that this time.
I just like the way Miners are holding up, GORO, AKG, & KL at highs, etc
Accumulation of Miners does seem to be overcoming the Sharp drop in Gold recently.
Thanks Alex and everyone for answering!
Ralph, what is DSI?
Daily Sentiment Indicator
it’s an expensive indicator from what I can tell.
Sorry, it´s not an indicator I follow, I just know several large traders like Moriarty that do. I recall it was pricey to access last time I checked. I do think that the DSI isn´t often above 90 or below 10.
I found this video where the guy that developed it explains a little on why it works, but not many specifics. https://www.youtube.com/watch?v=SEobocGSVF4
Good for extremes.
If it gets to 90, it must be time to sell 🙂
VKTX IOVA.
Are those symbols?
Yessir brotha… I like the bases and the potential start of the break to the upside
Sorry I mis-typed and they didn’t come up.
I like VKTX set up
Yup!!
Are you in either? They released earnings last week, so I am thinking that ( Even though biotech can be unstable) these set ups look good.
I MIGHT take one for a ride while I’m waiting for precious metals.
Although I still own more than 10 stocks, like ENPH, VSLR, IPI, TGB, ETC
I OWN VKTX at the open
I own VKTX from 4.90 half size. Im diggin this chart alot. I am waiting on entry for the other.
Check IMGN as well…
https://uploads.disquscdn.com/images/a1b67b828f560b2d2541727c4ec2bee8046cb1b4b7d45e723f2f05f728b8ee96.jpg
I just bought some, I guarantee the price will drop lower now, and $5.27 will be the high for the day!
I think the high was already $5.44 . It shot up & came back down so you could get in 🙂
LOL, I like the way you think!
It just sold back to my buy point 🙁
And if I look at the chart, I know that it could drop to ‘test’ that 50sma.
I hope it is just a temporary dip today
Both have released earnings too
Does anyone remember the oil stock that someone posted, I can’t remember who, that pays a great dividend?
Was it a Miner , or General Market?
I think it was in the general market. I remember something like the symbol MLVP, but that doesn’t come up. This person thought it was a great oil stock with a great dividend and asks what you thought. I went back a few days but haven’t been able to find it yet.
Hmmm, sorry, I can’t recall either, maybe they’ll see your post if they scan through the comments later & post it again.
Im in VLO, great stock that pays a dividend. I think $0.8 per share per 1/4
Yes. Thanks Bill. I think that’s the one.
I hear you Alex!! 🙂 LOL
Yes, it was you I was thinking of. =)
Not that this is your kind of stock, and it certainly has been a bit of a rough ride during consolidation, but I do like that chart Long Term, and it looks ready to break the down trend.
I had a feeling it might be!! Lol The description fits, especially the patience bit!! Would probably take most stocks if they eventually end up higher although I do prefer less of the roller coaster ride along the way. But then don’t we all!!? 🙂
EDXC doing well. CBWTF not doing well.
So CBWTF has gone up for about 5 days, breaking above the 50sma . A back test of the 50sma would be normal.
If it holds or closes above the $1.23 ( Which is where price is now), it’ll probably just be a back test
EDIT: Now below the 50sma, so hoping that it recovers
Darn it at 121 now.
Probably going to bounce off the 10sma
Thats a huge drop when you look at the hourly chart.
It does look big on an hrly – it is 6% on a daily
refresh
there is also a trend line , the 10 & 50sma in this area, so I wouldn’t want to see it close below it, but I am going to try to hold on to my position. It also has heavy volume so a reversal would be nice, instead of a heavy down day.
So far I have a drop to $1.21 & a bounce to $1.23
Note the numbers on the chart
https://uploads.disquscdn.com/images/3bf00b045d475b5c9a37e68e4c45f2757e50fddd40ffeac99dfe76d0c5a538f3.jpg
Back test!
I have $1,26 now- so far so good 🙂
Shake out. Looks to be rising nicely now.
Actually- very heavy volume at this point too
CANN hasn’t gone anywhere last few days but tight price action. BB squeeze, really love the chart here!
I own it and if it gets over $4 , I think it goes to $8 ( I know, sounds crazy, but if it gets over $4, I’m going in heavy. Look at the APRIL run, practically $2 – $6
That would be nuts, but great! Yeah, I was staring at the Dec and Apr runs for sure. Ready to add!
IPI still acting like a champion ( ENPH too)
Just. Don’t. Own. Enough! 🙂
Alex, when you see a stock like CREE, breaking above a previous high, you have to think that’s bullish, but do you consider that a good place to BUY? Too extended already? MACD looks great https://uploads.disquscdn.com/images/bb7f1e0bb3350386cf393a90dff8ad163bab8480bab049d67ab9000e9f241e92.jpg
In technical analysis it is a ‘buy’. I find that they can break & run, but also often they break, move higher and come back & do a back test, so it kind of depends on the sector & is that sector Bullish? , is it overbought by a lot? Should I start a position and add on a back test or just go in strong & hope for no pull back , etc
It is Bullish, but you may have to endure some consolidation.
ENPH is kind of at that point now too. It broke to new highs, but it may now stall
Thanks for the input. I think of it as a BUY, but I need to catch these earlier. Perhaps the MACD cross would be a better spot.
Bill, if you want a simple “buy” signal take a look at one of my favorites: the 9 EMA / 10 SMA cross on a daily chart. Notice that signaled a “buy” on CREE on May 3rd. If you didn’t want to buy on the first day of the bullish cross you could have waited for confirmation the next day and bought on May 4. The key factors to watch are:
1) Did the 9 EMA cross above the 10 SMA.
2) is the 9 EMA angled up (rather than going sideways)
3) The 5 day EMA is an “early warning signal” I watch, it should be angled up. Notice that the 5 day EMA turned up on May 1 and confirmed on May 2. That’s an even earlier “buy” signal but a “safer” bet is to wait for the 9 EMA / 10 SMA cross.
Once you see that “buy” signal it remains in effect as long as the 9 EMA and 10 SMA are angled UP on the daily chart, which they are. So CREE is still a “buy” but it’s a lot safer to buy closer to the turn.
Hope that helps. Everyone has their own charts and trading systems, that’s just one of mine. If I traded individual stocks that would have been a good one to buy at the beginning of this month. But I’m waiting for the major index ETF’s to give me a deep dip buying opp.
Good trading to all!
REFG making an appearance from the tomb. Back at the 200SMA
Above the 50sma too.
POTN also rode along the 200sma, and tagged the 50sma this morning.
It does seem like this whole sector is slowly perking up
Yes. Acutely aware of REFG’s progress anyway (above the 20 and 50). I have been holding since Dec 29th. They are somewhat unique offering banking accounts in the US.
Just released LBUY booked 42% growth last quarter.
Our OIL plays are so strong… DNR, LGCY, CRC, OAS, RIG, SN etc….m man even CHK from the 3.00 lows…
So true!
I posted about OAS, WTI, WPX set ups and missed all 3 , buying AREX and SWN, which were going no where for a while.
A traded a few on the side, but got out WAY Too early. Made pennies instead of dollars
and LGCY! Waited for a pullback that never came.
Strong run in those for sure!
Welp…. heres that pullback on LGCY lol
Holy Cow- Major bearish engulfing if that holds like that.
Added AREX back at .75
That chart has potential –
CF, got into ERX but late compared to oil cycles. Since you expect oil AND market to potentially drop here would you just sell now and take profit on today’s pop? I’ll at least tighten stop either way. Thanks!
I think I would hold on, the reason being that OIL is on day ( I forget, but near day 30). It CAN POP above that wedge and keep going, since OIL has 50 day daily cycles, so you may squeeze more out of ERX
If it was a good size position, you could sell 25% / Raise stops, etc.
Personally I do like it
Thanks! Ok, I tightened stop so I’m In the green regardless (unless huge gap down), see if we can’t squeeze more out. Was worried I was chasing but has been solid trade so far. 🙂
See my other post above, we posted at the same time 🙂
CASON, refresh
This may have been a 1/2 way consolidation. Maybe, maybe not, but worth holding some in my opinion
https://uploads.disquscdn.com/images/01ec62686b9a71de6d2c2ddc2cd5a6318df2ab37e51c207ff9d14b9dde132366.jpg
Gotcha. I bought the flag so at least getting the 2nd half run. 🙂
GORO.. You were right CF… mind of its own
It’s a beauty of a chart, especially with Golds slam down and hanging at the lows.
NXTTF over the 10 day, battling around the 50 day
OGRMF -My take on this chart, it is Possibly building a bull flag toward the 9 sma.
I would be adding here, but I already bought lower & added at the flag under the 50sma. I have what I want.
refresh
https://uploads.disquscdn.com/images/d5909e55497918f875c20b4d52d46c4e3ba0db0d035d8c1958490f53021af00f.jpg
Do you view that volume fall off as negative?
No, because it is light selling
Or do you mean lighter than December? I would like to see Decembers volume levels if we get to the top
I meant the last 4 days
CLF, X, AKS, CSTM – moving higher.
TGB- Not yet, still under the 50sma
LGCY .. why we have stops ..
sadly looks like GDX might fall 21.10’s.. started small position DUST this morning.. stop under yesterday low
I’m rather happy if gDX drops, simply because it is out of sync with Golds failed Daily cycle low.
Plus I’ll get JNUG lower, when I’m ready 🙂
that too.. then will be NUGT turn 🙂
junior oil AXAS looks setting up bullishly … near 3… thru 3 could run
scalp LGCY 8.10 off v bottom right platform tight stop in case bear wedge …
BZUN in 2 hour lower vol bull coil .. nice run on strong ER… IF pops coil thru 53.90 ATH with vol targets 55/56
Too late, already popped…….
not yet.. still in low vol coil .. has hold 52.25.. can’t anticipate.. have to have BO over 53.90 or they will run stop
Hard to buy after up 18% already…..
buy high and sell higher … jesse livermore 🙂
BLNK up again.
also in bull coil.. IF thru 8.65 then 9/9.25 but has to have much more vol
What does a lower volume bull coil look like? Do you have a chart that shows it and the subsequent break out?
Its a sideways consolidation
https://uploads.disquscdn.com/images/ef6e315f878c9127e0be64832085f79e1b0ab9069db1a021685611e0b31fde82.png
never broke out but what you want to see is big vol coming in to break it out to move up the channel
Bull flag on the 3 minute chart, I see……..
not a flag, a coil … heres CARV which shows huge vol breaking it out of a 3 hour low vol coil .. my buy stop likely would have been over 7.50/8 https://uploads.disquscdn.com/images/d68396d6fd5ca1ffbee1f6ed36108a4ea4693847a61af2b28c3e857dbad55119.png
just popped wedge again to 12 top of channel… amazing
Is this a long weekend in the US? in Canada the markets are closed Monday.
NOPE, we work in US!
In that case we work here too!
The following Monday is a holiday in the US – Memorial Day May 28th
CARV.. the low float du jour today… hard to believe a bank stock.. didn’t trade it .. halted now
Amazing…….How did you miss that one?
actually saw it this morning PM… but focused on other stocks.. long coil then it exploded
Now trading….up 173%…WOW
normal vol 14k shrs daily.. today almost 4 million
IMLFF sitting at the 10 day, trying to push through…MPXEF seems like it’s trying to move higher….
CVSI trying to move again
ACAN, boy that one certainly has not been easy to ride, but it is at the highs, up almost 135% in a month and a half
Let’s get out and push! I added this morning.
AKS starting here? Off the double bottom. following X
I just realized that I only posted 1 chart for AKS in the report, but I had 2, and the other one showed that AKS broke a downtrend line and the 50sma.
The chart that I forgot is posted here- it was a buy yesterday or this morning
https://uploads.disquscdn.com/images/51d77b37ce0870e2b2840dc0002378107a815b3f52b1ebc289f1b210a96275b2.jpg
TRUMP SAYS HE DOUBTS CHINA TRADE TALKS WILL BE SUCCESSFUL.. WS doesn’t like that
He’s probably just playing them, with the lopsided trade in their favor its to the Chinese benefit to deal.
agree.. but got the knee jerk reaction from WS
I’ve been waiting for TGB to pop, and WRN pops instead
Does anyone remember the energy stock HK?
Refresh
https://uploads.disquscdn.com/images/0d44abf754b3779babc5f33c007550965de572a308e071caba28436a8d3bd33a.jpg
Yes, I remember this one….for some reason it’s not in my watch list anymore, will have to go check it out….
Inspector General Finds FBI, DOJ Broke Law In Clinton Email Probe, Refers To Criminal Prosecutor
Im not shocked
CARV just broke out of wedge 9.60’s with vol… tagged 11.94.. from 3 to 12 today
I did end up filling my order for TGB, but I am early. A more bullish buy is if & when it breaks above the 50sma, but at this point, earnings have been released, commodities looked good, and WRN broke out big today, so I will just ‘jump the gun;’ a bit and see what happens.
This COULD still just base out for a bit longer.
CSTM great chart. Thanks Alex.
I like it too, long & short term
VKTX has been coiling or running sideways all day, forming a wedge on a 2 day chart.
It looks ready to break here, just not sure if it will have ‘follow through’ – I’m not seeing a big surge in volume ( which is preferred).
refresh
https://uploads.disquscdn.com/images/c40921a40d7e8b03449ac73eecf94f2ebe00a12bf91fced0008dc5a323bc9bca.jpg
Hey Man!! This was my secret alert to you!! why u sharing lmfao
Im in!
Ok the 3 of us, shhhhhh…. I didnt add when I wanted to today, in from yestrday 4.90… Got a little scared when it tested 5.05 today…. but happy again lol
IOVA was my other one – I posted both yesterdays report
I didnt get an email or any alert from you about that wedge?
Not the wedge, just the ticker LOL
traded VKTX before as junior bio….. thru 5.60 could test 7’s again
Alex…do you think CRON could possibly continue down to the 200? I know, it’s a crystal ball question…:)
It could or it could continue sideways until the 200sma meets up with it.
It is a 50 / 50 chance.
SPX, SP futures, TNA all seem to be breaking out. TQQQ not so much?
RUT ATH
Youre late on ATH! RUT BO after the double top.
triple top from jan.. today was ATH
SPRWF starting to look good……
BZUN BO of falling wedge as coil broke down but getting some vol finally
If you can time your entries an exits on EDXC, you can make some good $$$ fast. 12% swings all the time.
Amazingly tight range of trading today in GDX/J
CHK.. nice!
Crazy to see GDX trade in only a 14 cent range.
watched a great video on $CRSP last night…then forgot to pull the trigger this am…#alwayslate
CF, thoughts on MJ stocks? Some a took a bit of a hit today but on relatively low vol. compared with last few days. Maybe just a backtest? e.g. $APHQF
I think they look fine.
It is above the 50sma – 200sma – Then so far , its fine and may be a back test
These move big in both directions
Thx muchly!
Alex,Thanks for commenting yesterday on VALE. I went ahead and sold some shares that I had bought near $8, but held onto the ones I bought way back around $4. Like that company.
CBDS was down today ( I own it) And it bounced right off of a few moving averages like the 200sma, 50sma, 10sma, and closed up. I love that.
refresh
https://uploads.disquscdn.com/images/ddc16704f765e0dd7e762f7a1fec2ff60309e2e0e0954be0988a32cee65b0889.jpg
Oddly enough, HL: kind of looks like it wants to move higher
CDE too.
Its been stuck in the mud awhile but $EGO seems to be not hanging with its other miner friends.Actually looks OK here…but I’m new to this 🙂
Pushing on that 50sma, a break higher may attract buyers
HL-CDE-EGO They all have large amount silver!
CF have u gone over HCC?
Yes, in the past.
Fridays report has been released