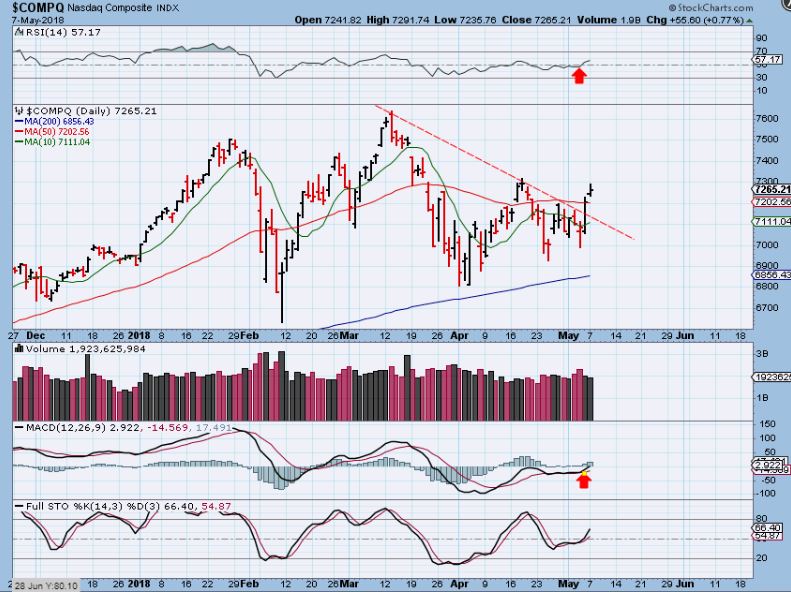
NASDAQ – The NASDAQ broke above the 50sma and has broken the down trend for now, this is short term bullish action …
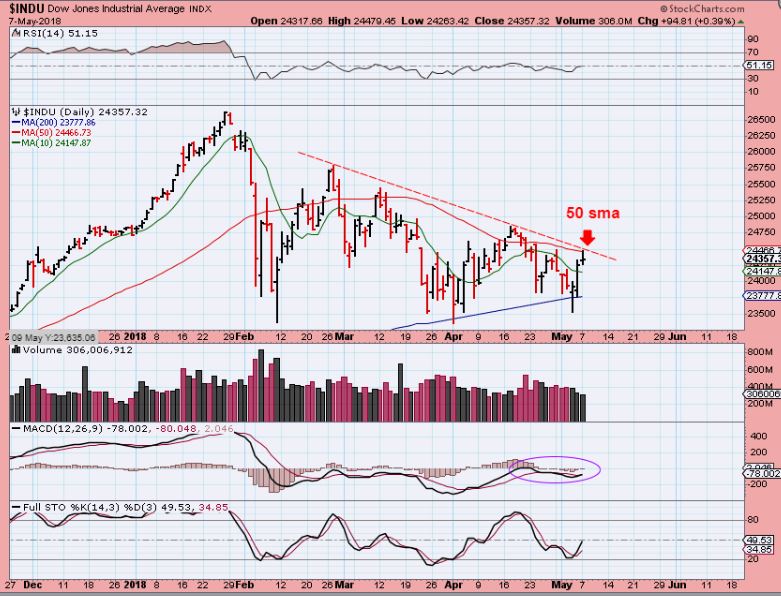
DJIA – The DJIA & SPX have not broken higher yet, so we will look for more follow through as the week goes on. The General Markets are still oversold, so as we watch for further upside, we will continue to monitor the strength (or lack of strength) in the move higher.
Some of the TECH stocks that we traded earlier in the year like SAIL, SQ, CAMT, LX, etc. are recovering and even look worth trading, but I still want to be a bit cautious in this area as time goes on. Some of the other formerly bullish stocks really got a little ugly in the sell off . I will show you that below…
SOME REMAIN HEALTHY LOOKING, Up near the highs, like …
CAMT- Back near the highs, this held the 50sma and still looks healthy.

SAIL MADE NEW HIGHS ALREADY ON MONDAY. I took profits in mine when I got tired of the choppiness.

SOME LIKE CASA, AQ, ETC are not looking healthy anymore. This shows us why we needed to be aware of when the earnings releases were due, and the importance of using stops.

SO I WOULD TRADE THIS AREA IN THE SHORT TERM, AND SEE HOW THE DAILY CYCLE PLAYS OUT AS TIME GOES FORWARD. I WILL HAVE A FEW TRADE IDEAS AT THE END OF THE REPORT.
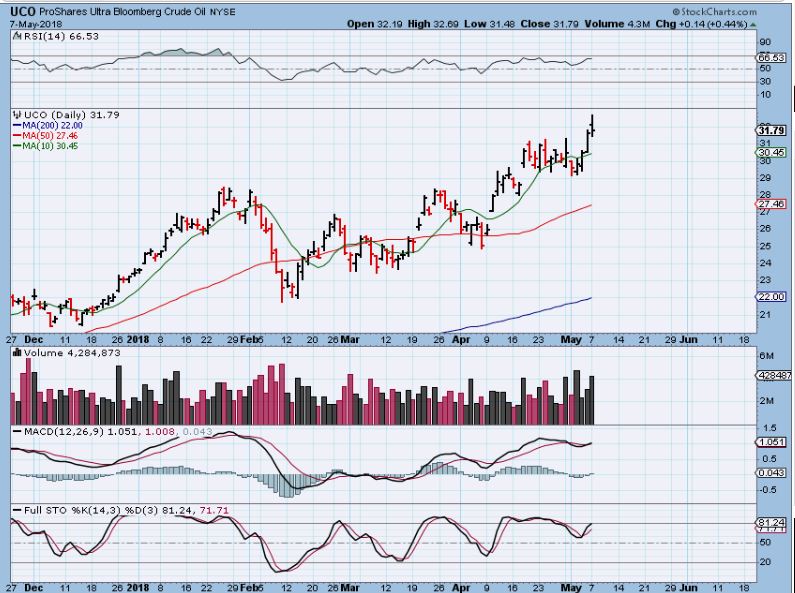
WTIC – Stockcharts shows OIL as closing near the highs, but it didn’t, it reversed into the close. So with Oil we see it continuing higher after breaking from a 2-3 week sideways consolidation Friday. This target would actually reach that $74 area, but since it reversed into the close, we may see a SHORT TERM pause. Many Energy stocks also reversed into the close too. Lets take a closer look.

UCO – UCO & USO do show the reversal for Oil. My GUESS is that this may drop to the 10sma and then resume upward climb. Oil still is a bullish set up.
XLE APRIL 27 – I have been pointing to XLE as having a mid point consolidation that should break out and tag recent Jan highs as Oil runs to $72-$74. ERX was mentioned as the 3x etf for this trade.

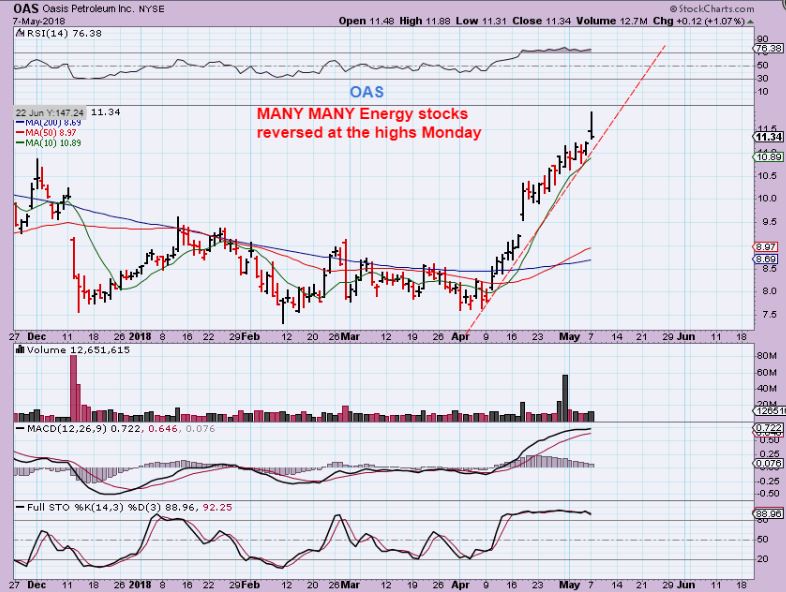
ERX – ERX broke out with Oil Monday, but also reversed into the close with Oil. Use a stop just in case this drops to the 50sma. Let’s look at a few Energy Stocks. I mentioned OAS, QEP, WPX, ECA a few weeks ago…

One concern is that these Energy Stocks are now really becoming extended. They could have rather large pull backs if the selling starts here, so let’s take a look.
OAS from April- I mentioned OAS here 1 month ago, and I wish I took this trade
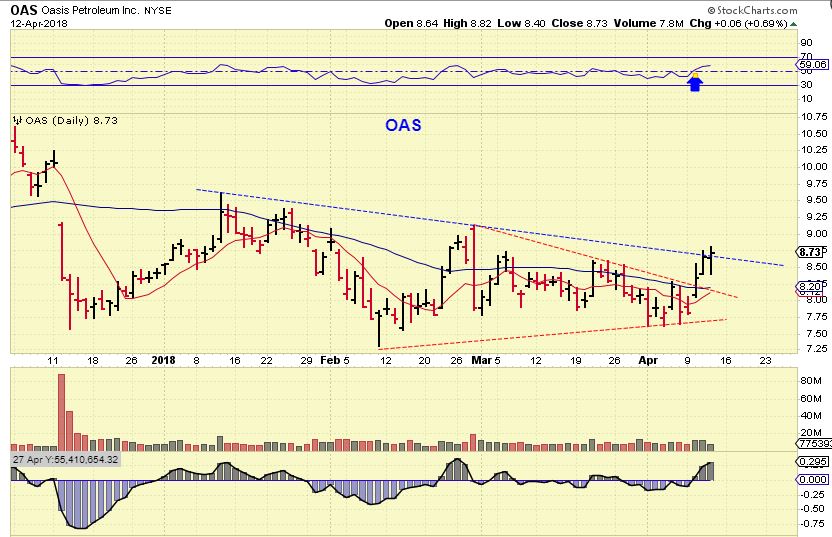
OAS – A nice steady run, but notice that it reversed with OIL after yesterdays pop. This could actually pull back 50% of this move if the run was finishing up. It may drop to fill the gap, and land on the 50sma. It is NOT a sell, but I’d use a stop to lock in gains if selling continues below the 10sma.
WPX – After putting in a running correction above the 10sma, WPX Popped & dropped Monday too. This is also very overbought and could slowly pull back to the 50sma. I’m not talking about a slam down drop, but maybe…

WPX JUST SOMETHING LIKE THIS KIND OF A PULL BACK. I would use a stop at the 10sma on these, just to lock in great gains. This may keep running for now with Oil to $72-$74, or if it dips you could look to re-enter later.

ECA – This broke out in the morning and looked very promising.
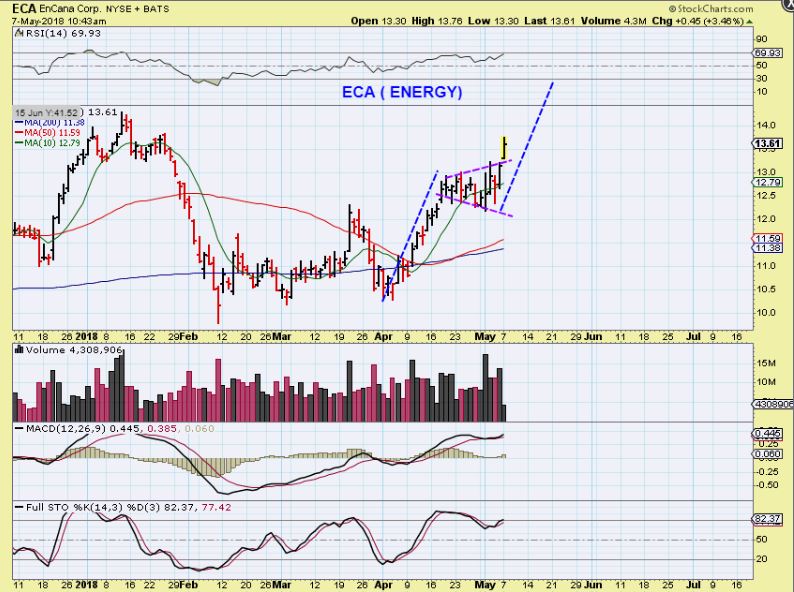
ECA #2- It also sold off into the close too. This was on my watch list and I almost bought it when it broke out. I’m still watching it.

QEP – I actually like the bull flag on QEP, but if Oil sells down, this could also get caught in some selling. It has already dipped below the 10sma a few times, but has just flagged out. I have this on my watch list

I don’t know why Oil sold down, some think it has to do with Trump announcing his conclusion on the Iran Deal Today. Let’s see what happens to OIL at that time. The set ups are bullish, but stay frosty.
GOLD, SILVER, & THE USD – Gold & Silver sold off and tried to come back, The USD moved higher again. I want to point out something that is noteworthy:
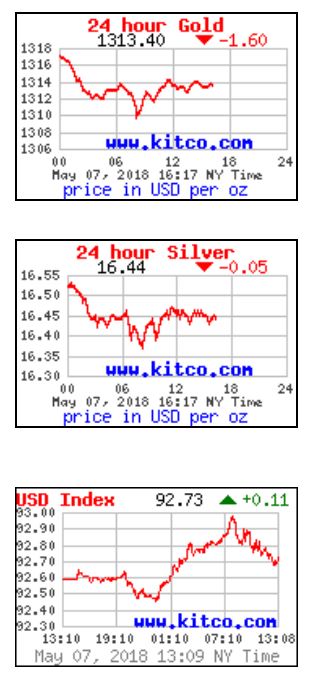
USD – Look at that steady vertical run higher by the USD. I knew that the move out of this base should be strong, and I somewhat expected that GOLD could drop down just as sharply into an ICL, but ( Noteworthy) Gold has held up rather well considering this strength in the USD. Look again at that straight up climb…
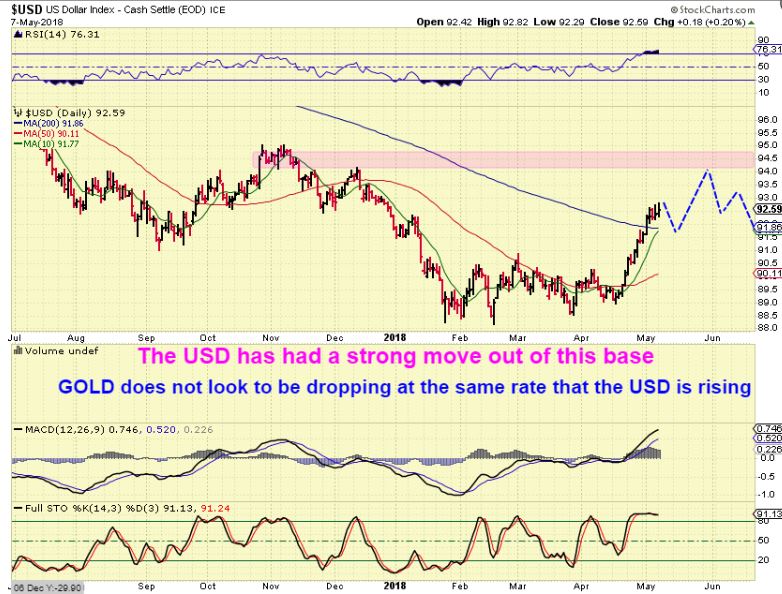
GOLD – Gold still did not crash down into an ICL, despite the USD run.
As of Monday, Gold did not get enough follow through to confirm a dcl by closing above the 10sma, but it also didn’t break down below the 200sma, despite a very strong Dollar run.

GDXJ DAY 4 (not 5) – Miners are acting a bit stronger, especially when you look at that USD chart again. I am hoping that this is a bull flag, and when Gold confirms a dcl, Miners should POP higher. If they do not POP higher soon, I will be concerned.

When I look at the USD and see how it has basically moved straight up since mid April, the strength of the Miners is encouraging. When the USD pulls back, I would expect the Precious Metals to get some upside traction. IF GOLD lingers along that 200sma and Miners do not push higher by day 8ish, we need to consider the possibility of a L.T. daily forming before a final drop. That will mean lighten up or tighten up stops. I am watching this sector closely this week.
Below I will post some charts of possible trade ideas for traders here, I currently have a mixed bag of stocks right now. I will say this: I have entered some trades that did not follow through upside, they are going sideways. The environment is choppy and that makes trading a bit harder. Let’s say that I own 3 stocks running higher, and also 7 stocks chopping around, then the gains are muted or even outweighed by the drop of the choppy ones. It can be frustrating waiting for the trades to get going. I am just mentioning this because this is the kind of environment that we are in, and some may just wish to wait for set ups that are trending higher. That said, I will still provide trade set ups , as requested for now- Happy Trading!
~ALEX
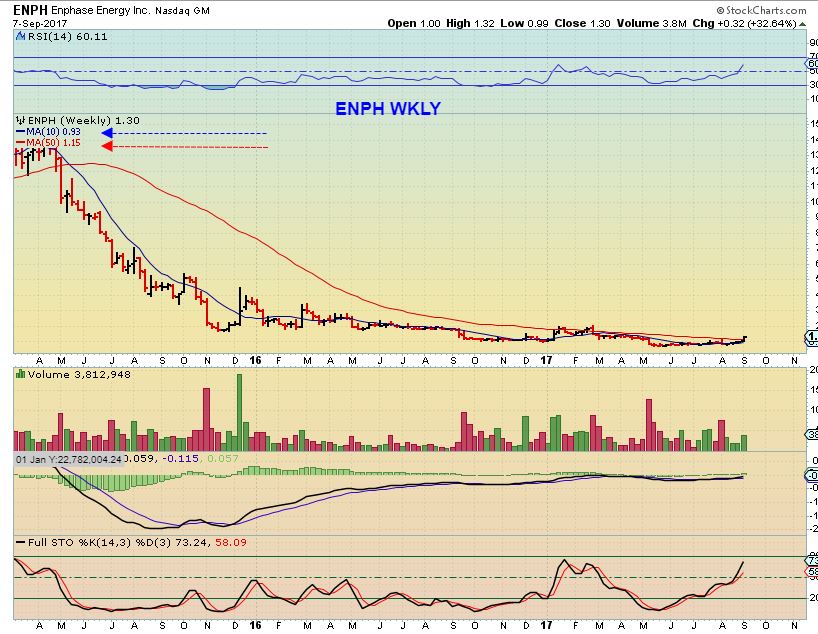
ENPH – I own this and added on Monday. It too is choppy, but it is a good set up. It seems oversold and set up to make a nice run higher, this stock has done very well for me in the past when it breaks and starts trending higher.

ENPH LONGER TERM _ I have pointed the long term outlook in recent reports too, using older charts.
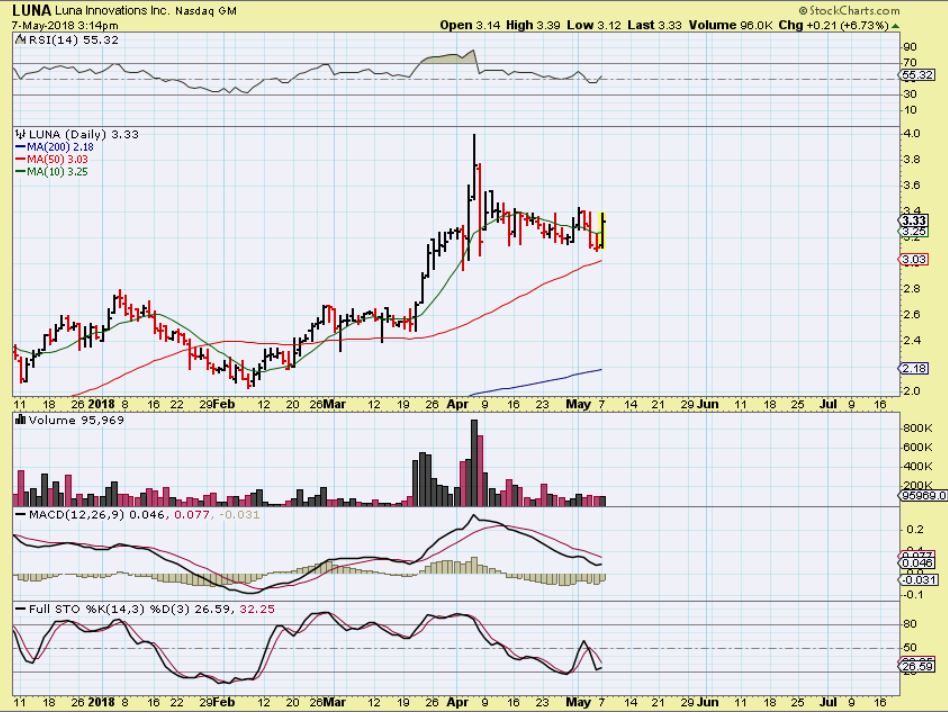
LUNA – Could this drop to the 50sma before moving higher? Maybe, but I like this set up and the good thing is that LUNA was not really affected by the recent selling, was it? It did a sideways consolidation, so I think that that it is a good buy. Earnings are TODAY AT 5p.m. Put it on a watch list.
SQ – Closed at $51.12, Earnings were released MAY 2nd. That is a green light , this could start to run higher 🙂

CAMT– Earnings on MAY 2 were good. I owned this for maybe a month in the sideways chop and sold for a small profit, but it now looks like it could break to new highs ( If the markets follow through). It was not adversely affected by the markets selling recently.
SAIL MADE NEW HIGHS MONDAY, I also sold mine simply to lock in gains in a choppy market. This still looks bullish to me.
COUP – I drew this chart on Friday, I liked how COUP tagged the 50sma and never violated it during the NASDAQ choppiness. Monday it…
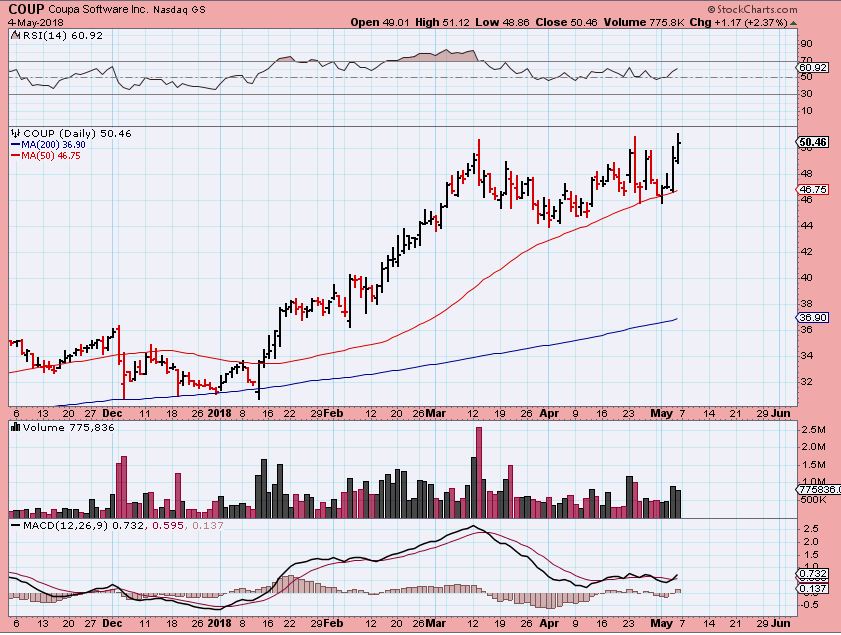
COUP – It popped and dropped. It may just turn higher & Run, or it could build a handle as shown. I do not know when earnings are, please look for that before buying. This is a bullish set up.

I wrote about Medical marijuana stocks recently and pointed out the set up in MEDFF as Bullish
MEDFF APRIL 17th – Breaking above the 50sma, and then maybe a pause, back test, buy opportunity.
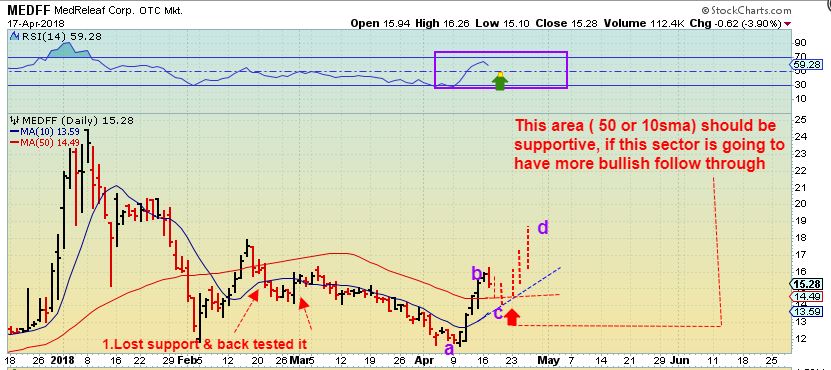
MEDFF – It paused at the 50sma as expected (Flag) then Ran higher. It has reached a ‘measured’ move and now may be at the next area for a flag or pause. A pullback would be a buy opportunity, it has run from $12 to almost $20 already in 2 months. The typo is due to my typing quickly and not proof reading .

OGRMF – With that, last week & Monday in the comments, I mentioned that OGRMF was forming a flag similar to MEDFF. It then POPPED later in the afternoon. I think that OGRMF may be ready to gradually move higher the way MEDFF has too. I bought it Monday because it was now above the 50sma again.

KSHB – I mentioned that I own this a while ago, it also has been improving, but it has NOT been all that easy to just hold during the choppy consolidation. It looks good to go now, though.

I am also holding CANN and CBWTF, but they are not running higher at this time. It is NOT easy just holding these, and even KSHB had gone sideways for a while. When they finally start trending you get a good %Gainer, but keep in mind that these may or may not be trades that give you fast results.
TWMJF – I do believe that this is setting up to eventually move higher too. It has higher lows and looks to be breaking from a triangle. Will it rocket to $35 like it did in December? Maybe not, but it should get there eventually if the sector remains bullish.

WBAI – With a long base, WBAI had a great run, consolidated those gains to the 50sma, and looks to be climbing again.
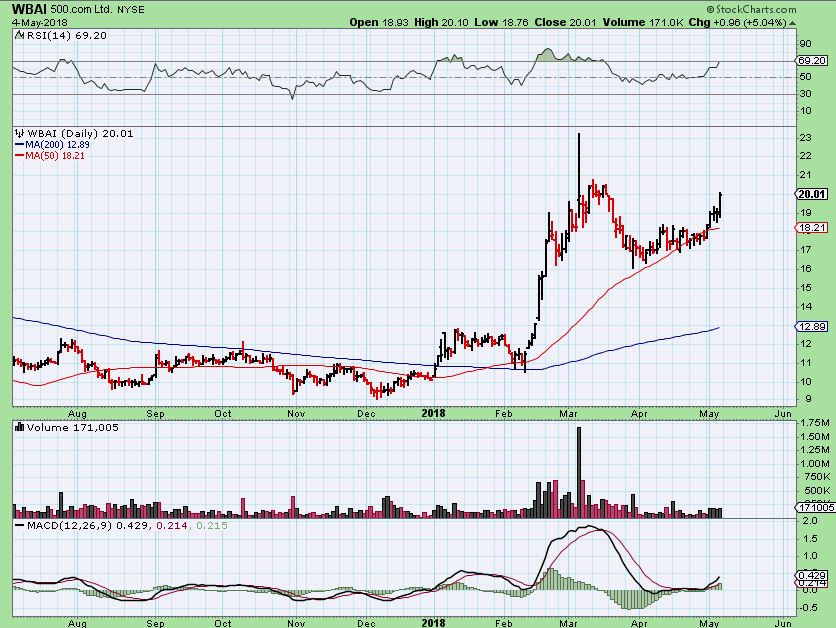
WBAI – It gained again on Monday.

CAKE – I have mentioned this one, it has become a bit choppy, but remains bullish and should run higher in time. That is a break out & back test

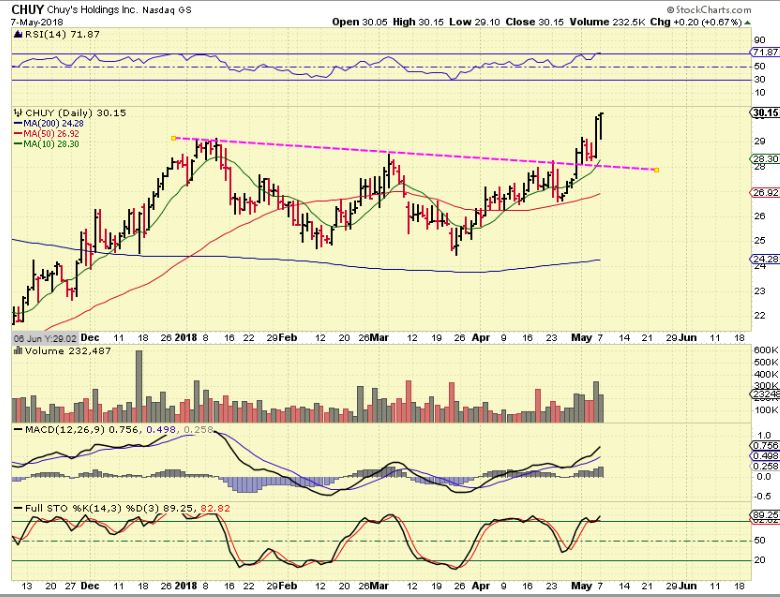
CHUY – April 27- Buy on the 50sma here or buy a break out

CHUY – CHUY is acting correctly. I would buy on a dip if we get one.
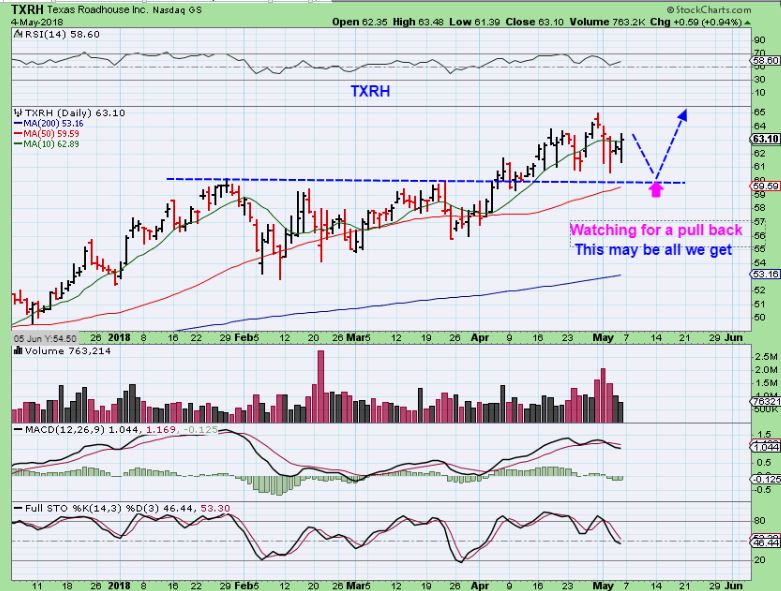
TXRH – Also a rising restaurant stock near the 50sma
URA – I have been waiting for another move higher in Uraniums, but they too are churning after recent gains. It is frustrating at times waiting for the choppiness to turn into a trending move higher, but I just wanted to point ou that this sector still looks bullish. However…

URG – I grabbed this chart midday when it looked ready to go- I was going to use it in this report. It eventually Sold off into the close just a bit, along with UUUU, UEC, etc- so the sector may have more work to do, but put it on your watch list. I own this one.

May 5th Weekend Report 
 May 9th – Close One
Scroll to top

CBWTF looking good in pre-market!!
Lets hope we get a run. I own it even though CF dumped it.
Me too.
You do realize that he is saying that I dumped it, because IN THIS REPORT I said that I still own it, right? And he wants me to scold him & tell him to “read the report again, Bill!” – lol
CBWTF breaking support. Im going to have to sell. I’ll give it a little longer
What about an overview of cryptos/coins/blockchains?
Overview is very risky
I use bitcoin to gauge the overview, and Bitcoin is still above 9,000, but it ran to from $6500 to $10,000 and is pulling back, so some of the cryptos will pull back too.
Then you have to take them individually.
SSC looks great, above the 200 & 50sma, SRAX is also above the 50sma – these are going sideways after a strong push higher.
XNET just ran from $9.5 to $14 and then became a buy again on the tag of the 50sma at $12.40ish and ran toward 414 again. Yesterday it put in a reversal , so one could sell of hold with it above the 50sma
MARA & MGTI are flirting with the 50sma, dipping below, recovering, dipping- they are going sideways but could drift lower if Bitcoin pulls back. I posted a chart of MGTI yesterday to show this.
If that makes someone uncomfortable because they kind of feel that they have to watch it all day- They may want to just sell it & use the money somewhere else or wait for a better trade.
And I have mentioned that these make VERY BIG MOVES in both directions, so it is a sector that makes big gains and big looses of 10% or more in a day. 3 days in a row in 1 direction can be 30+% – and even though the gains are awesome, some may not want to be in this sector if they haven’t experienced this kind of trading- it can, at times, be faster than JNUG or NUGT.
refresh
https://uploads.disquscdn.com/images/19c24441a864fb6b8da52954dffcc282ece0a3de17e6973d9b96dafa5117b9e9.jpg
Good morning, Alex –
Above you mention that AG is not looking healthy anymore – is that because of the weakening RSI? On a daily chart, it’s struggling to get above the 200 EMA, but is above the other moving averages, which are stacked favorably (including the 200 SMA but not the 200 EMA).
Just trying to learn – Thanks!
No , at that point in the report, I wasn’t discussing Precious Metals, I was discussing the NASDAQ & Tech Stocks. I used to trade CASA, AQ, CAMT, IO, SGH, etc, and I meant AQ
That clears it up for sure – thanks
That being said, AG reports sometime very soon – they are not saying when but it looks like tomorrow. In a pre-release of their production they are down 5% to 10% (off my memory) so will definitely report lower numbers.
Hello Alex, I have a question about your weekly ENPH chart. When I use log scale, the chart looks quite different. It has had a very good run since last year, percentage wise, and now it is bumping up against the downtrending 200 week ma. The MACD is rolling over as well as some other indicators I use. Of course, it could pop up for a good short term trade but it looks to me like it might have to digest some of the gains since last year. I guess my question is, when do you like to use the log scale, and when do you not? Thank you.
https://uploads.disquscdn.com/images/d0137c580a660eb3efb9a7d5a19121de4873f43fb6f60b23df50b9f9aee1c5e9.png
Hi Chap
As mentioned in the report, I have used older charts to point out the big picture in the past- that was a chart from Sept 2017. I used it in a SEPT REPORT , just to show upside potential out of a base-that is not current, so your chart looks different for that reason. The MACD looks the same on LOG to me.
Using a log scale on a weekly basis, I do not see the MACD ‘rolling over’ – it has leveled off. I do see price up against Resistance & has moved sideways. Currently Price has been in a consolidation and has gone sideways, so naturally the MACD will do the same. . On a daily it is moving off of the 50sma, so it is a trade on a daily chart, the weekly chart showed long term potential.
SEE THE ATTACHED CHART, it is LOG SCALE. This MACD sideways dip happened in the last consolidation and the MACD even crossed down- but it is not important when it has rallied and is well above the zero line. The MACD cannot go higher indefinitely, it is measuring momentum- it has to balance out during consolidations.
I never really use LOG anymore, to answer your question, but I used to use it for long term charts.
the attached chart is log & I have drawn in the chart that this CAN drop & consolidate further, but I am also using a daily chart for my trade- as ENPH rises off of the 50sma
https://uploads.disquscdn.com/images/6d14415db5e5909744d0733c71e89f8273e13097b85dae5e9ff533027d47c323.jpg
Alex, I did not notice it was an old chart, sorry about that. “Rolling Over” was probably not the best way to say it. Momentum on the weekly is weakening or leveling off as you said. Thanks for your explanation.
I should have used a current chart, but I was just trying to point out the long term upside, and have charts that I used in the past.
And yes, during consolidations, the MACD usually dips down with price, but above the zero line it is not overly concerning to me. This CAN consolidate further on the weekly as shown, but the daily had price at support on the 50sma, so that can be my entry & a stop
Got it, thanks again.
IAG & NSU Look good, but GDX, GDXJ, and GLD dipping down at this point.
could be going for the ICL now?
It is not out of the question, if you mean Gold.
The low was on day 29 so far and Gold did not confirm a swing low.
Gold could be on day 34. So far GLD is sitting back on the 200sma though- lows have not been taken out at this point.
There u go BKD!!!
Out half BKD from 7 at 7.75
All out BKD at 8.00
Took a starter KBH – breaking downtrend line, small size will add on retest.
Todays GDX GDXJ dip shows that that was not a bull flag forming.
Just talking out loud-
So I look at some Miners, they look fine KL, IAG, HL, CDE, AUY, GORO, etc etc
I look at GG, NEM, ABX for obvious reasons ( GDX) and they look like they could go either way. NEM & GG could dip down further and it doesn’t get ugly for the chart.
And GOLD put in it’s recent low on day 29, It never confirmed a DCL. If that low is broken, today could be day 34 today and GOLD could bottom later this week if the USD hits 94ish? And Miners could either hold their lows or slightly undercut and put in a DCL at the same time as gold.
refresh for NEM ( GG looks similar ) NEM & GG never got above their 10sma either. They look pinched in between the 10sma and the 50 sma. or the 10sma & 200sma
ABX look like it wants to just drop from here to the 50sma.
https://uploads.disquscdn.com/images/2170e3d71a1bcea0a8500cec10c7c0e3e2067f6d6ddd919ad41ed3938aa0f551.jpg
Hey Alex
I assume you ditched your leverage jnug?
So if the dcl is likely ahead do you think that is an icl or just a dcl? We never really got a bloodbath decline yet…
I did not sell my JUNG, but that is a personal choice – anyone else can sell when they feel necessary
I bought lower near $14 and I added at $14.80, average cost is basically close to where it is now and the lows have not been violated for GDX or GDXJ. I can take a loss if need be
Also, I have mentioned that various situations call for ‘position size’ being kept reasonable.
I am not all in JNUG or extremely heavy in JNUG, because we didnt know if this would be a DCL or ICL.
If it was a clear cut ICL, I would go in much heavier. This was at least looking like a reversal off of the 50sma for GDX, possible DCL, and so I went in with a starter position, and added as it moved above the 10sma.
Now I have to wait and see how this trade plays out, and that also goes for whether or not we have an ICL or DCL at hand. That will be determined later, but right now GDX & GDXJ & GOLD & SILVER remain above their recent lows. Gold did not break $1302, so lows remain in lace at this point.
Let me throw 2 scenarios out there…
RIGHT NOW , GOLD lows at $1302 are still the lows, though Gold dipped to about 1306ish.
GDX/GDXJ lows remain in place too.
Now let;s say that Trump declares the Iran deal will be ________? Gold rockets up $20- there you have it. The lows held for GOLD & it would confirm the DCL ( ICL?) – And that could happen.
or Trump says that the Iran Deal is _____? And Gold crashes down $20. There you have it, lows are taken out and it can happen. Gold would be on Day 34 and COULD fall into an ICL at lets say day 37 after a wash out sell off.
This has been the case all the time. Nothing has really changed, except that GDX & GDXJ closed above their 10sma & seem to have confirmed a DCL, but the MAIN METAL GOLD is the driver of the sector. We took a trade at the lows, with stops in place. We raise our stops to lock in gains, or keep them under lows to stop us out.
This has been the idea all along. I hate getting stopped out as much as the next guy, but it happens, and if GOLD rockets up after the Iran Deal discussion, I have a position. If it crashed, I am out & need to reassess the situation.
When the rally out of the ICL finally comes along, and especially if GOLD & MINERS break to new highs, this will all be forgotten again, as Miners go on to make great gains.
SO I CURRENTLY HAVE CDE, AXU, AUY, JNUG , and HL for the precious metals sector. Knowing the above 2 scenarios.
If this indecision was driving me crazy ( It isn’t ) , I could easily …
1. Cut leverage for now- hold my Miners
2. Lighten up by selling 2 of my 4 miners
3. Take my chances and hold what I have, but maybe cut my leverage down from my recent purchase at $14.80 & take that loss, keep my $14 purchase
4. Look at my position sizes and cut my AUY holding in 1/2 and my HL holding in 1/2
5. Completely sell my individual Miners , some for gain, some for loss- and sell my leverage, some for gains, some for loss, and watch what happens. IF GOLD starts to surge higher above the 10sma, I can re-buy higher but with a bit more peace of mind knowing that the lows held in place
6. Etc Etc ETc.
We always have choices if we view the above 2 scenarios Bull & Bear possibilities.
Or Add. 😉
I thought of that, but I didn’t want anyone to add until after 2 p.m. ( Trumps thoughts can rock the boat ) 🙂
GLD hit support at the 200 sma (I added) One could buy at current price here with a .0063% risk factor with a stop below the May 1 low….which is either an possible DCL or ICL based on your analysis.
Risk Reward is excellent imo…..less than 1% risk.
If one gets stopped out you ReEnter at the next buy signal.
Yes, buying with a tight stop has risk reward at a very good spot, I am heavily invested enough at this point though. Others may want to add
Excellent summary, Alex – Thanks
It is never easy with the Miners, huh? 🙂
You could also say the same comments on Oil with the Iran deal. 😉
Yes
Ok!
But if I get to vote, I vote for higher!
GOOD LUNA FOLLOW THROUGH , but I cant buy it before earnings release tonight 🙁
SQ & COUP look good too
Often we get a few stocks down, a few up, a mixed bag.
Today Several of the stocks in my account are down 2% – but not breaking support or violating anything that would cause me to sell, so basically my account is down almost 2%.
Need a good bull trend to ride, hate days like this
Days like this its best to just wait in a beer line!
Weather-Wise its not too bad of an idea too
OLED missed earnings slightly, chart looks good to me, moving higher.
Was BKD a Ron Futch or a frenchie – either way, thanks to whomever alerted it. Pulled in .75 and 1.00 on the play!
I think I just saw GOLD POP
(SHHH)
I used that pop to get out of SAND .. mehh… However, still in IAG HL and AUY
miners barely moved lol
REFRESH
Small things can make a weak day a bit more bearable
https://uploads.disquscdn.com/images/8cd2f4a8aec8869af86a413b22c2486e9d4b671f62b52b266532af8545f95578.jpg
CF:
Do you still have Oil on an ICL with the Feb. low ?
You were waffling somewhat on that ICL a while back…..
What I actually said was that using cycles it did not have all of the normal hallmarks of an ICL.
There are specific things that occur heading into an ICL , and they did not happen with Oil.
So is it an ICL? It has had the follow through of an ICL, but not the characteristics of one.
And with Oil, Cycles are often much longer – daily cycles can be 50 days long , so intermediate cycles can stretch.
I have explained this before, several times, so right now you just take the bullish set up & trade it that way ,
and use stops & trading stops to protect gains
LOL…..my question was not an attack, just wondering what your “current” thoughts were.
I have been long since our last discussion on Oil’s Feb. ICL/DCL wave (2) low…….. I have now taken profits as of today expecting a wave ii of 3 correction soon.
extremely heavy volume on UCO & USO today
transitioning….Iran deal is done, traders have known for quite some time, price reflected on this most likely position by Trump the last few months. imo We shall see…..
In fact this would not be a bad short…….
JNUG glorious
Nice POP on Gold!!!
Nice follow through on Golds Pop
GLD came back to touch the 200 MA on the daily chart today, so far so good.
http://schrts.co/mN1LKP
I was expecting to get hurt today, instead accounts held in well for the decline, and now up on the day. Smaller miners doing better than larger ones, from what I am seeing.
Refresh- 2 down trend lines broken on the recent pops in gold
https://uploads.disquscdn.com/images/d3d296d717b7faeccc82a94df76eef0450871cf2b198a1a84e86a0ad4032ca3a.jpg
chart of FSM, NG, AUY and a few more now showing reversals from Red to Green
SO FAR , encouraging reversals
AKG, not a reversal but NICE
Possible intraday back test
https://uploads.disquscdn.com/images/d01a004f4fd4ed2d0f346bf8b344373b4c9de747666eee4ce81ba28b1e2cb782.jpg
EXK red to green. Bought some in the 2.75 range.
I see that Alex just got in with 40k shares… nice!
or Maria?
I was buying, but I missed the reversal on EXK.
Now we need follow through from here – A GOLD close above $1317 would be a nice start for Gold
EXK Looks good LC 🙂
LOL….. I thought you were “heavily invested enough”.
At that point I was heavy enough for the current set ups- my intraday charts were neutral
Leave your phone number in an email and I’ll call you for permission next time -L-O-L
ahhh….your transparency continues. lol
Sure you have my number. 🙂 Actually I told you to buy at the 200.
I am a ‘trader’ for a living- I dont meed to post all of my trades for “KEN” , sir.
The reports are for your information, the comments are where others can share ideas.
And your transparency is becoming blatant too
That’s the problem “you” do not post or follow up (change in stops) on your “trades”….hard to be transparent when you do not.
😀
picked up some aqms as well …;) kinda looks like it wants 5 …
sshazam
earnings tomorrow girlfriend :)-
yeahh…. i think it has a 5th up yet… if not.. ull hear me wince 😉
i like RUN too …
RUN looks pretty but earnings tomorrow too 🙂
lol .. yes i see 5/9 for run
ps. tradingview is showing 5/10 …??
CRK lovely finish
Anything higher than this price looks like a follow through break out
https://uploads.disquscdn.com/images/0811f5641fea8eb8434110cf97fe53ce0235a41c776ac7ef4a311e78b3ed5ee1.jpg
USD (UUP) also hit it’s resistance at the Dec. high. Hmmm…..
quite a lot of volatility after President Trump’s speech
Refresh
We have a bit more volume on Golds pops after 2 pm- really want this to close at $1320 or something
https://uploads.disquscdn.com/images/0c1fda89d029ab2cefb1d32eb79e003fdc50efa69ec1273a7adf85211e37d912.jpg
Who wants JNUG to close over $15.31 ✋
‘Yes’ – or higher please
definitely not me… 😉
SRI – got my buy signal https://uploads.disquscdn.com/images/201ab94451c22204a231ae5a80c9440bc091dfc7256b72ace0b4ffdab715b162.png
The final hour or 1/2 hr of trading may be interesting for Gold.
Chart for LUNA still looking really good
GLD is over the 10sma, Thats a start
I’m really looking for GOLD $1318 or higher at the close- then Gold would finally close above the 10sma
C.F. gold taking another dump overnight, testing recent lows – we’ll have to see if miners can hold up at the open tomorrow.
Really wish gold would have taken off. Looks like oil was the place to be and I missed it. Really getting tired off waiting on this sector, patience isn’t my strongest point.
MGTI & MARA do not look as good as SSC & SRAX in the block chain sector, since they are closing under the 50sma.
I sold my MGTI & MIGHT place it in SSC if this breaks higher. I already own SSC, so this is a good place to add.
See charts of SRAX & SSC
refresh
https://uploads.disquscdn.com/images/42448f37535bd22f9164c0bbe149ba14befd4b5df85bf56a6b1bb990d20a80db.jpg
I DO HATE THIS LIGHT VOLUME THOUGH- I WOULD THINK THAT IT NEEDS HEAVIER VOLUME TO BREAK OUT
nice.. i was watchn GBTC .. but i like SSC
Better volume on GBTC, but it also MIGHT sell down more since the stochastics is mid point.
Tough call, but I already own SSC, so I was just thinking-
” I own SSC and MGTI And one gains and the other loses, I end up balancing out. Maybe I should flip to SSC , because it is above the 200sma and 10sma.”
Maybe I should just stay in SSC , dump the other, and be satisfied 🙂
And I really cant believe that GOLD cant just push to $1320!
Looks like we’re going to end the day right where we ended yesterday – but it sure doesn’t feel like it!
I feel like ERX wants to break out (or is at least toying with the idea)… it back tested today’s resistance, and it bumping up against the trend line set yesterday…
https://uploads.disquscdn.com/images/ec2908531ce302a14564bc408c475d764c6ef1d67c5546dda00a56086914e001.jpg
I know, I was looking at that too, because the candle on UCO recovered too, but it may be part of a short term topping candle.
ERX is still in that consolidation area- at least you’d have a tight stop
XLE – tough call on what it wants to do.
refresh
https://uploads.disquscdn.com/images/9d6383e815a638e7816417e6be53e554776cc62afef439bc3cc1f4fb323d400b.jpg
hmm .. mux getn perky….
I actually bot this today.. that and AKG (finally and prob at the tippity top)
Israeli Government: Iranian attack may be Imminent. If so ……
I’d like to get your technical take on AMLP? It’s the oil MLP ETF, yield is 8%. If oil has bottom sticking this one in an IRA collecting the div’s with upside looks attractive. Thoughts?
Pistol Pete!
Sorry, I went away, but I looked up the chart. It has been selling off for quite a while but had a nice rally going into the end of last year.
refresh for a chart
Now it almost looks to be an Inverse H&S, it held support, and looks like it does want to break higher.
The 200sma is overhead and might act as resistance short term, but if it gets above that & the 50sma curls higher- it could do well
https://uploads.disquscdn.com/images/11bebfae8723afab799801480f945780af317b69d5d367140fba4ceb36d362d8.jpg
Wednesdays report has been posted