
May 5th Weekend Report
Usually for the weekend report, I like to take a step back and see the Big Picture, but for this weeks report we will have several daily charts too. This will help us to focus on what to expect in the short term as well as keeping the longer term Big Picture in view.
NOTE: If you have been a subscriber for a while, you may recall that I have said in the past, ‘ My observation has been that due to the shape of a Triangle, the cycle count can get obscured ( or messed up).’ My experience has been that as price closes in on the APEX, it can’t make new highs until it breaks out, so it can be bullish, though it looks weak and the count can also become unclear. Things look left translated in triangles. WE JUST SAW THIS with Miners in February. A triangle formed and it became bullish as it broke out, though the count was unclear and it looked weak in February until later…
SPX WEEKLY LAST WEEK – Last week I posted this chart, and it is a large triangle. Lower highs look weak, but that can change later in a triangle break out. As price approaches the apex, it looks bearish close up, because it looks ‘weak’, unable to get a rally going, right? This is why I see triangles as tricky using Cycles, but using technical analysis, they quite often become Bullish if they break out higher.

SPX CURRENTLY– We got a strong reversal Friday in the General Markets, and we have our higher lows in tact due to the triangle shape. The 200sma is acting as support so far, and this could break out higher, which usually starts a new daily cycle ( When a triangle breaks, I often just start a new count, just like I did with Miners in Feb).
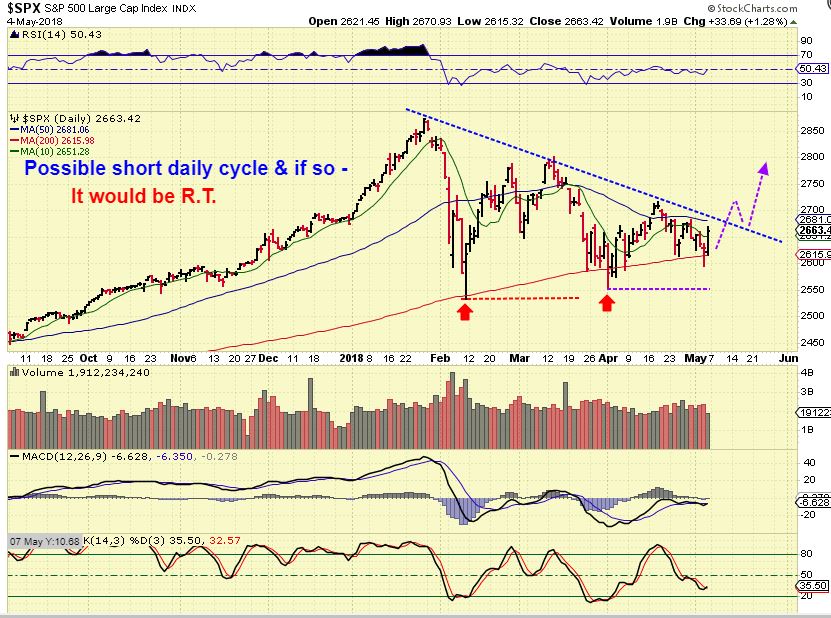
Conclusion: I can’t tell if the break out will occur now, or will this meander for a few more days within the structure and THEN break out, we do have some apex room available. So General Markets could be bought as a low risk trade here or after the break higher, with a stop under APRIL lows, not May. I will be watching individual stocks and see how they progress too. The FOOD stocks are still breaking out & remain Bullish .
Now see WINGS as of Friday, CAKE, SHAK, CHUY, etc
WTIC – Oil has been bullish and remains bullish, and daily cycle counts can be up to 50 days long. I have been calling for OIL to get to around the $70 area, allowing XLE to reach former highs, before possibly pulling back for a dcl. Well, This move to almost $70 Friday looks more like a ‘break out’ that could run even higher, and we do have daily cycle time to do so. So let me look at this another way…

OIL #1 – If I just look at this chart as a trader looking at a cup & handle and symmetrical patterns , how would I view this?

OIL #2 – I would get $72 as a minimum target, using symmetrical moves higher. It would be a bullish break out continuation for now.

This is definitely one time ( and I have really only really seen 1 or 2 other times, once in Gold & Silver ) where the COT SMART MONEY got it wrong for months. They have been extremely short for months as OIL broke higher. I admit that this tainted my view of what would normally have been a bullish set up. I grabbed Energy trades eventually in March, but I didn’t expect Oil to remain near highs for this long.
WTIC – The BIG Picture has always been long term Bullish, and we consolidated sideways as a bit of a back test from breaking out, and it continues higher. It has not been a straight run higher, it has been a break out and consolidation in the big picture, after breaking from a large base. This looks like Oil will eventually return to highs again. Seems quite Inflationary.
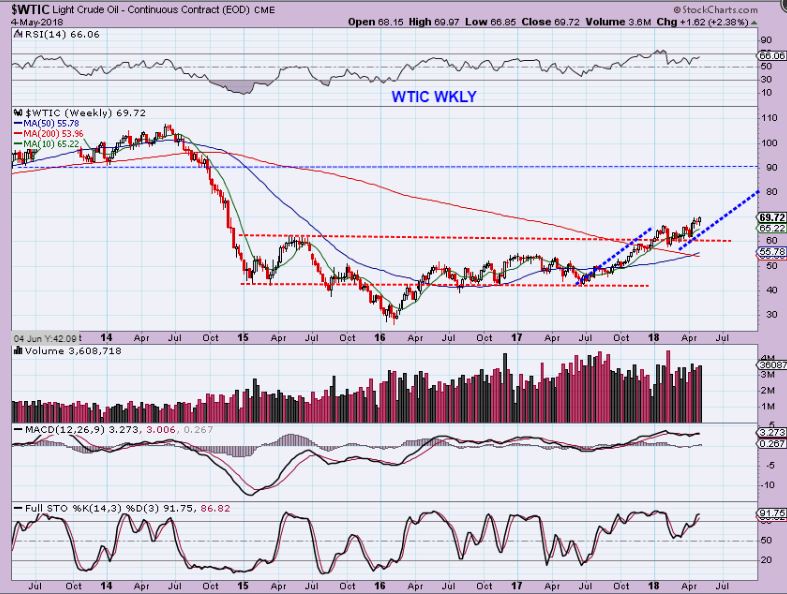
Conclusion: In My daily charts I have recently been thinking that OIL would get to about $70 area and may pull back for a dcl., it has a measured target of around $72. I think that we are seeing inflation gradually creep in, and Gas prices around my house have moved up 40-50cents/gallon in recent weeks. WHEAT, CORN, SOYBEANS, OIL, METALS, MINERS are coming out of lows, and the FED did not raise rates in May. Inflation might continue to become a headline, and by the way, that is good for GOLD, SILVER, and MINERS LONG TERM.
USD #1 – The USD broke from a 3 month base, so that gives it the energy to run higher too. I mentioned 92 – 94 as a potential target. So I will draw a chart here as though this is topping near 92, like a false break out above the 200sma. This would be good for GOLD – but I honestly don’t ‘Feel’ like this is topping after breaking from such a nice base, so see the next chart too …
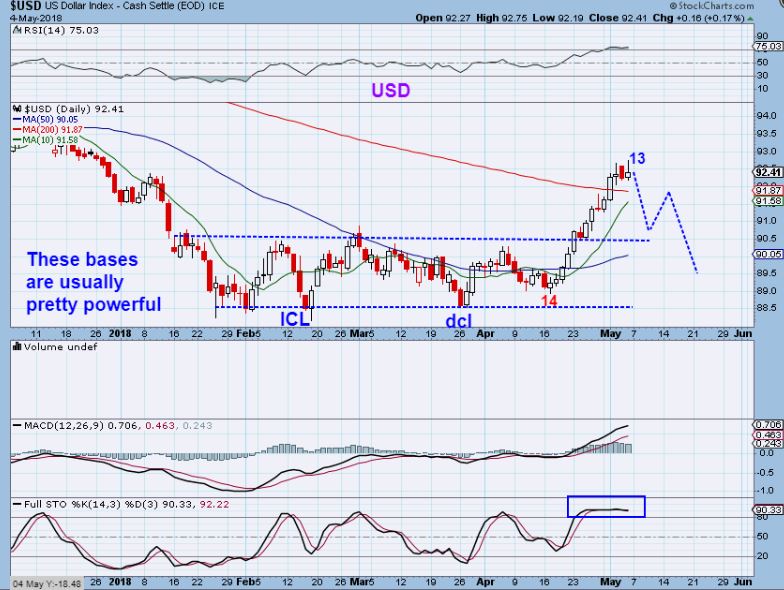
USD #2 – Bull flag to $94? Can GOLD & The USD run at the same time from here? It could, but we’ll just have to wait & see how this all unfolds together.

USD WEEKLY – The BIG PICTURE does have the USD at a resistance area, it has stopped right at the 50 week MA. If this holds the USD back, Gold can now run from a DCL or ICL.
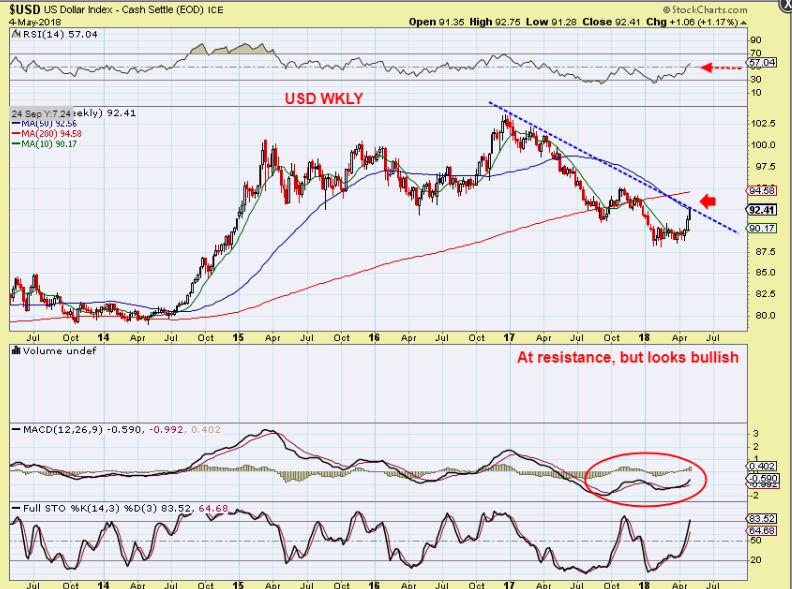
THE USD looks bullish breaking from the base, but it is at weekly resistance. We need more time to see how this plays out, it COULD get to $94 & the 200ma.
PRECIOUS METALS
O.K., Raise your hand if you opened the report and just skipped right down to this Precious Metals sector  , Yes, I understand that. It gets exciting when this sector starts to perk up, but if you did that, you may want to also glance at the USD above first, they have been a bit related lately.
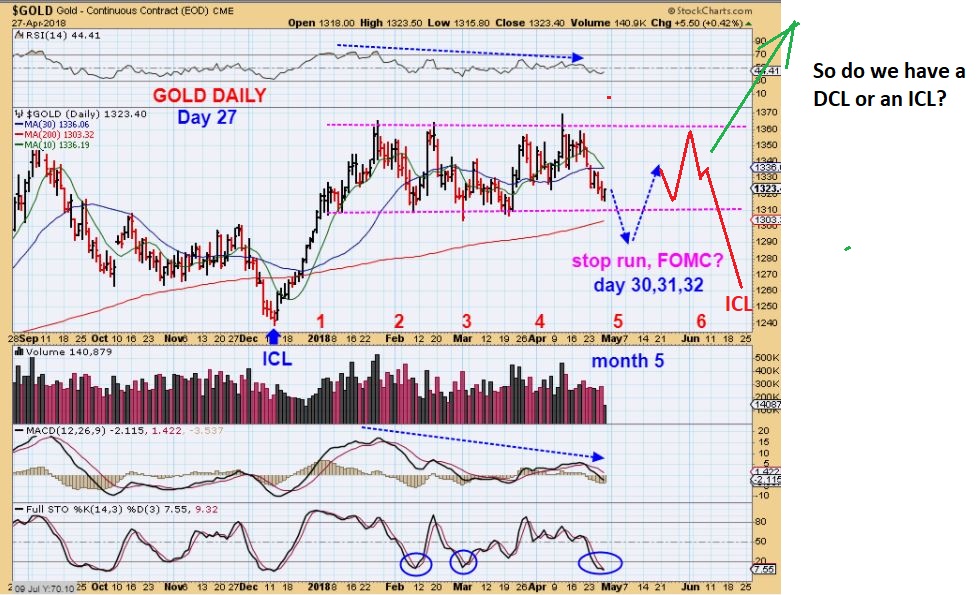
FROM APRIL 27th, What Do We Expect? I expected a drop toward the 200sma, and timing-wise we could look for a low.
1. A DEEP sell off could be an ICL at the MAY FOMC MTG
2. Or we may just get a dcl,but the FOMC is day 30 of the daily cycle
3. So either way, I drew a bounce off of the 200sma area ( DCL or ICL) and then we break higher or dip to the real ICL. Now lets move to today…
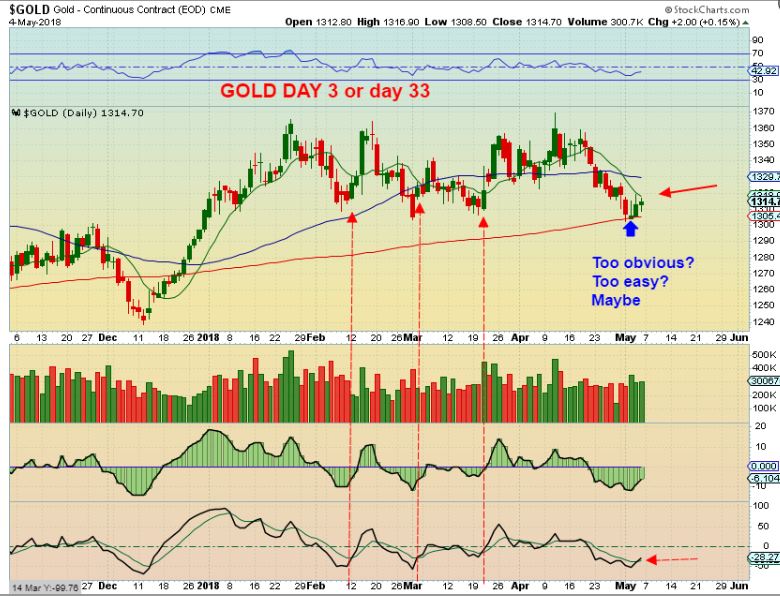
GOLD NOW – It has done as expected, but it almost feels too easy to buy this, right? We do NOT have a swing low confirmed on GOLD yet, the 10sma held price down, but Miners do look to have one in place. This means that we MIGHT be on day 3 of a new daily cycle, or we MIGHT be on day 33 with a quick shake out next week. I do prefer that, and make it an ICL please! With this analysis, I am LONG MINERS and I used some leverage.
COT – Notice that this COTs ‘Smart money short, Spec longs’ set up is near levels seen at the DEC ICL. Interesting. This was as of Tuesday, before the FOMC Mtg. The ICL last July was a bit deeper.

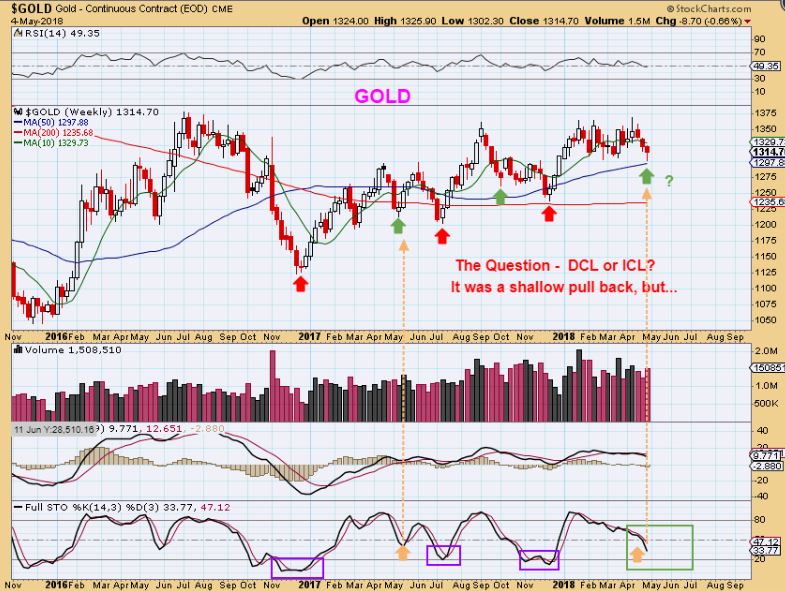
GOLD WEEKLY – I used Green arrows for some DCLs , RED for ICLs. Is this a DCL or an ICL is the question? As mentioned above, next week could shake down a deeper drop to an ICL. a big 3 day drop would scare many out. At the end of this report, I will have a bonus section, but dont skip there now  – it is best to read my thoughts on Miners first.
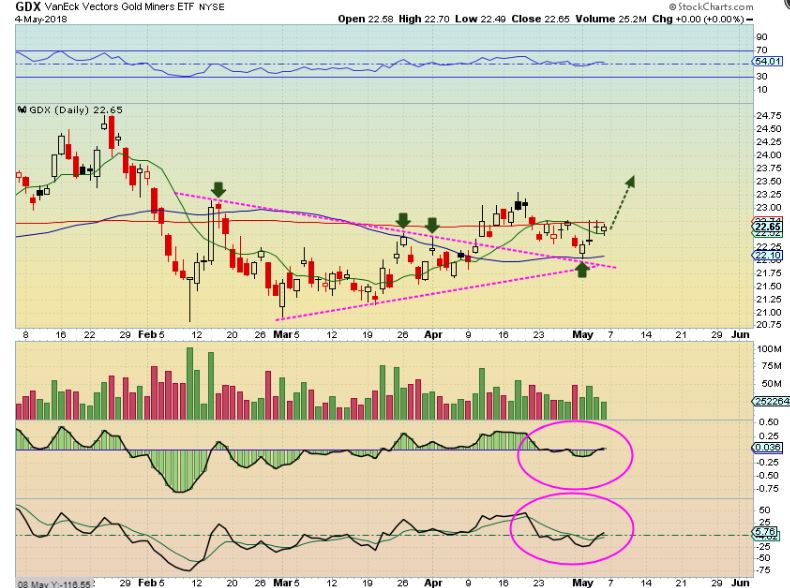
GDX #1 – This looks like day 3, and GDX has closed above the trend line and above the 10sma. Look at my lower indicators, they are actually quite bullish, with this tag of the 50sma only being a ‘test’ on my lower indicator. I usually see this tag of the lower indicator in bull market pull backs, not deeper dips of a bear market bounce, so this looks like a bullish pull back. As mentioned in prior reports, I am positioned long.

GDX #2 – The 200sma red line has held price back, but this should be able to push higher now. That should draw in technical buyers. I also now can view this as an even larger triangle / wedge, with a break out & back test. That is also bullish looking as a set up. I am positioned long.
If this chart below was a chart of AAPL, or TSLA, or GOOG – I think it would simply be viewed as BULLISH and people would readily buy it. This is GDX though, so now we all wait for the rug to be pulled out from under it, right?  I understand that too. We have all seen false starts in the MINERS, only to see the lows taken out, but right now, this is a bullish chart and the cycle timing is favorable for a low to be in place.
GDX #3 – So I took away the 200sma, and this is the current set up on day 3 or even day 33- I view it as bullish and I am long, as mentioned in last weeks reports. A stop can even be placed under the 50sma.

I have had people say to me, ” I am nervous, this low doesn’t give me confidence.”. O.K.- That is fine, why not approach it to the best of your convictions? Start small, no one said that you have to go ALL IN JNUG or NUGT, right? Start small and let POSITION SIZE be your safety. If it stays bullish, add on dips, etc.
GDX WEEKLY – Remember last weekend we were stuck in the middle, with a FED MTG ahead that could launch us higher or lower? Well that is where we still find ourselves, but it sure seems more likely to go higher now, right?
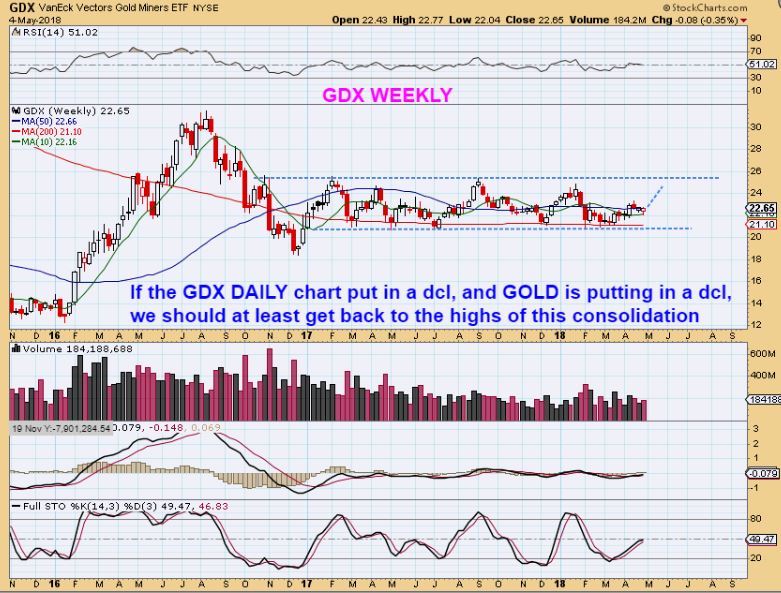
CONCLUSION: PRECIOUS METALS LOOK GOOD, BUT THE USD ALSO LOOKS BULLISH, SO IT MAY BE SOMETHING TO WATCH GOING FORWARD. FOR NOW, I AM LONG MINERS, I HAVE SOME LEVERAGE, AND I AM THINKING THAT PRECIOUS METALS WILL MAKE ANOTHER RUN HIGHER SOON. GDX CLOSED ABOVE THE DOWN TREND LINE & 10 SMA, THAT CONFIRMS A DCL. A STOP UNDER THE 50 SMA WORKS HERE. AND OF COURSE, I WILL COVER THINGS DAILY IN THE DAILY REPORTS AS THINGS UNFOLD 🙂
This is your weekend update, and I will have some bonus info at the end.
.
ENJOY YOUR WEEKEND!
.
~ALEX
GOLD – COULD IT BE AN ICL, though the dip was not very deep??
I am going to show you why that COULD be the case. We will know when the rally unfolds, but for now we watch for clues as it moves along. Let me show you just a few of the things that I am looking at currently that I have not mentioned yet. There is more than what I will add below, but time permits me to show a few more things that I have been taking note of, and then I can release this report.
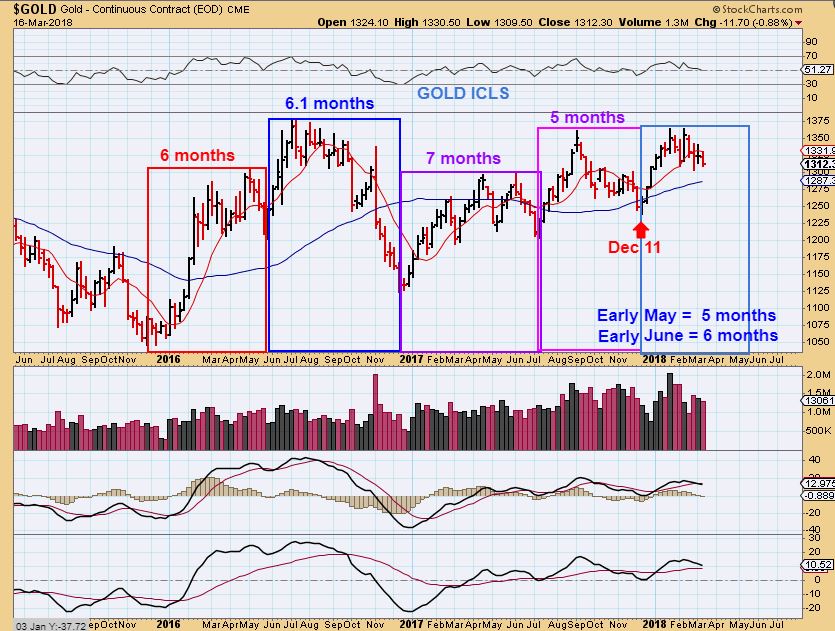
1. GOLD REMINDER from the MARCH 16th report– For Months now I have pointed to the MAY FOMC as a possible target of a 5th month ICL . I have posted this chart maybe 10 times. ICLs come 5 or 6 , maybe 7 months apart, and we had one in Dec 2017. We could get one in MAY, JUNE, or even JULY.
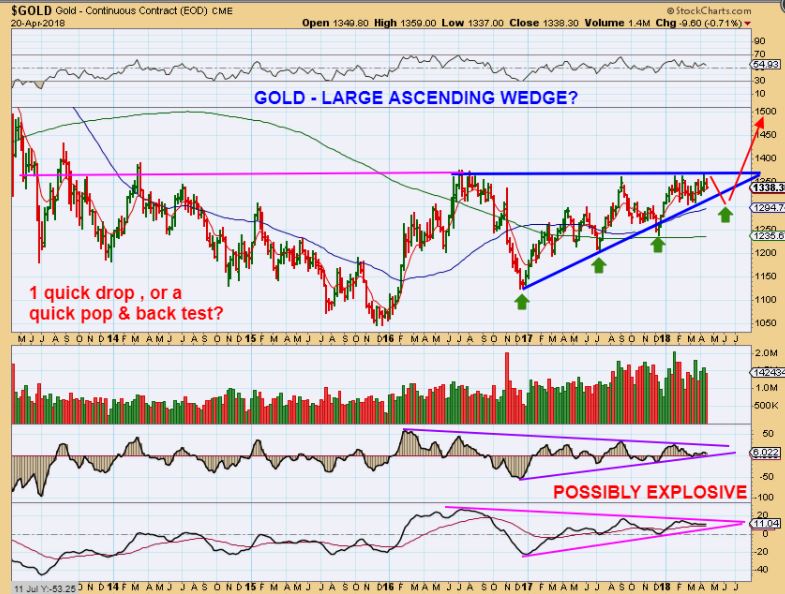
2. GOLD FROM APRIL 20th report – This is a bullish set up and in my opinion, it does NOT call for a very steep drop to set up the bullish break out. So I drew a drop to about $1300 here, and we dropped to $1302 this week. The lower indicators are building steam in my opinion.
THIS IS WHERE I WANT TO POINT OUT SOMETHING THAT MAY BE IMPORTANT AT THIS TIME IN OUR PROGRESS. I drew this last week and have kept an eye on it, and now is the time to share it.
3. GOLD – Look at Gold During Golds prior Bull Market Runs on the left side of this chart. After the 2008 Lows, the ICL dips did not really bust down below the 50 weekly ma, right? No, during that bull move they didn’t crash very much. See the Blue Arrows. So recently Gold HAS been making higher lows as ICLs now too, right? That’s a bull move. DO you see what I am eluding too?
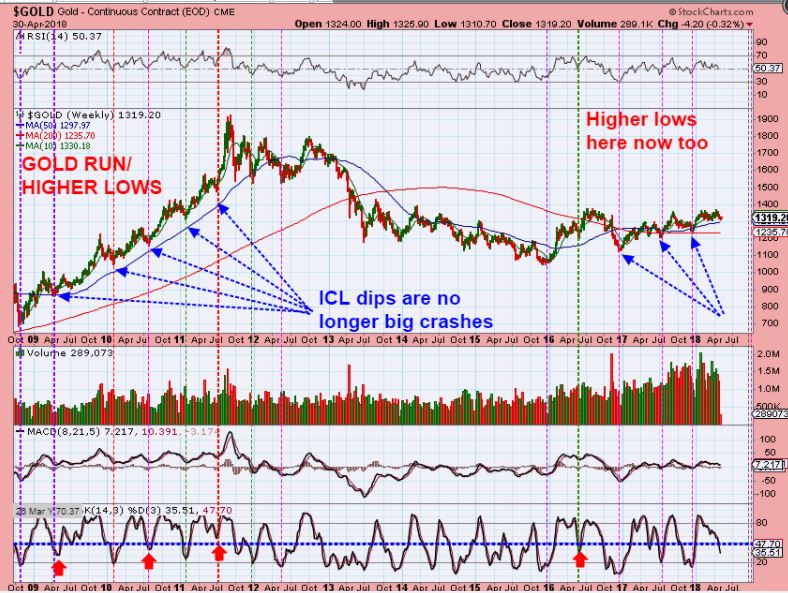
4. GOLD – ICLs actually held above that blue line from 2008 onward, so last week I decided that this dip may do the same, and that alone should NOT disqualify it as a possible ICL. So the dip wasn’t deep, but I am NOT disqualifying this as a possible ICL in a bull run for Gold simply because the dip was not deep. THAT blue line was $1297, and we hit $1302.
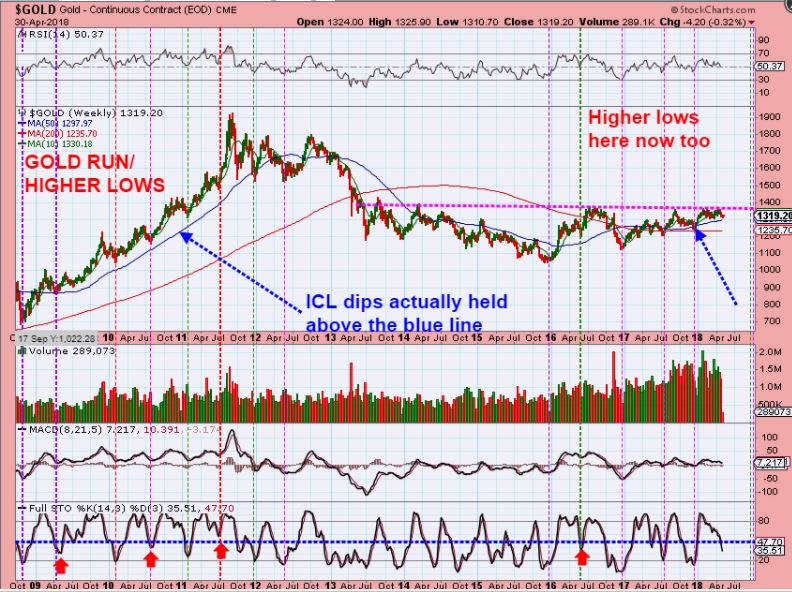
5. GOLD – I admit, the set up is a bit of a different situation, since we were going vertical in 2009-2011 and lately we are in a sideways consolidation, but we dropped to the 50 MA this week. MAYBE that is enough before we break out & start going vertical in 2018. Time will tell.
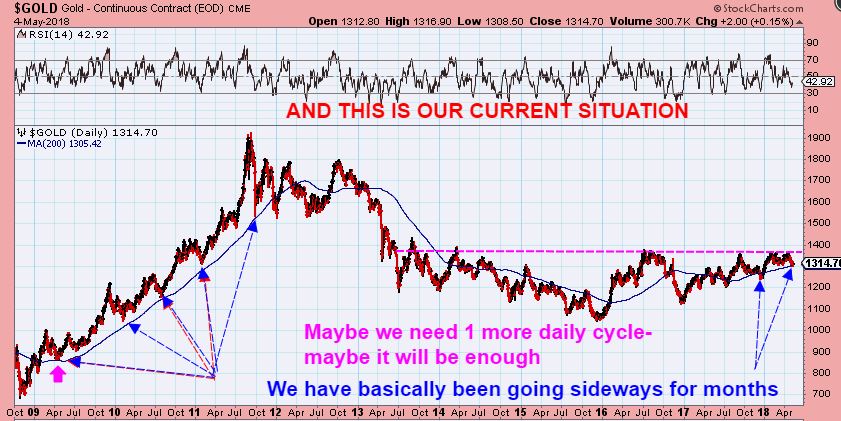
CONCLUSION FOR THIS THOUGHT: When GOLD confirms a swing low in May, it will be 5 months after Decembers swing low. The COT was close to Decembers ICL levels. Even if price holds above the blue line, it may be enough to give us a stealth ICL. It is not a guarantee, but my point is simply that even though the lack of a deep scary drop bothers me too ( when looking for an ICL), that may NOT mean that this cannot be an ICL, based on the above charts. Maybe its time to start going vertical? I will watch this and many other things going forward, and they will be reported in the daily charts as needed.


Alex. I don’t like to give you too much praise, because I know you know you’re a very good analyst, but I do think that this time you’ve out done yourself!!!
Thanks 5-0
appreciate the kind words.
It’s probably not my report that is special, it’s probably the set ups looking so special.
I seriously hope that they play out as the money-makers that they appear to be. I mean, when GOLD Finally breaks free out of the current base, and Miners get out of this GDX Consolidation, – I do think that the upside could tack on quick gains.
I keep seeing Hawaii with the recent earthquakes and lava flows on the news. I think of you and Cason when I see it,
plus I have friends out there, but they are not affected.
Gotta watch out for liquid hot magma!!
I’m on Oahu so no effect here, but all are certainly staying glued to the updates.
I think you bring a fresh perspective to your analysis and find the hidden clues that most would miss (I know I would) and that keeps me coming back for more!
Thanks Cason
Did someone say magma?
Yes the area being affected is very close to where we used to live. We had put our home on the market when the first one occurred taking property values to zero. Then when it stopped, after waiting three years, we finally sold with a profit. Maybe there is a God. What are the probabilities that we were able to get out only to have the lava return again. We are so sorry for our many friends who have most of their money in there homes who will probably be left with nothing.
Thanks for the thorough overview.
Ur welcome Nancy 🙂
Always good to hear from you
Excellent Report CF.
Although I would argue the following:
1) Stop on Equities would be the May 3 low. (if it breaks it would be a final wave “e” of the current corrective wave which could easily break the April low which you suggest as your recommended stop)
2) Precious Metals certainly worth a Long here (I am long SILJ, UGLD, SLV call options) with a stop below the May1 low on GLD imo but “seems” to early for a ICL imo. May 1 certainly looks like a DCL is in place though…..one more daily cycle low due mid to late June for the ICL would look and fit better ?
Thx Ken
1. Sure- Place a stop anywhere you like in the general markets, mine would be at a DCL failure.
2. 5 months isn’t really too early for an ICL, since we have had them on the past at 5 months, but you did say ‘Seems” and it does seem early since we didn’t get the steeper drop that they often have.
I do like the steeper drops to help identify it more clearly though, and if it happens in June or July- so be it.
It would be a good fit and should lead to a great rally when it comes along.
P.S. Bitcoin has been on the rise again.
BTC and ETH are long term plays…..both holdings in cold storage…..not to mention mining BTC.
If equities break the May 3 low your adding an additional draw down….not worth the risk/reward….imo it would behove you to reenter than take the draw down.
Yep this could be the ICL in PM’s so ya gotta be vested in it.
Alex, I want to thank you for continuing to extensively analyze the general markets since some of us like to play the index ETF’s (TQQQ,TNA, UDOW, UPRO) and your guidance is very helpful. I’m now back in JNUG pretty heavy but I learned the hard way back in January not to get tunnel vision and focus on just one area of the market at a time. I got chopped up in JNUG while missing a nice easy run in TQQQ. This time I’m watching both and I have a starter position in TQQQ hoping for a dip on Monday to buy more. As usual, my “target price” is around the mid-point of Friday’s big candle for TQQQ at around $148.95.
Good trading to all!
Ur welcome Steve –
It has been very choppy with a lot of sideways chop since then in March and April.
I’m glad that you’re still up big, many rode the price action and just had to get stopped out with small gains
or even losses.
Tricky markets in this triangle formation.
TQQQ has a higher high, might not pull back…….
soooooooooooo………………. are you positioned long? 😉
ps. i was wading thru some OLD charts and I found this one i posted here in Feb 2016. L O O K how that pattern ACTUALLY played out…. pretty freekn crazy … ;o) https://www.tradingview.com/x/kXU1E07x/
and the old post/chart:
fun with patterns…
this kinda freaks me out… just did an overlay/exact replica of 1999 … pasted it over this current diagonal.. whoaaaa… pretty darn close… any chance you see this move happening dear freak of the charts … 😉
https://www.tradingview.com/x/HVGl6M7P/
chartfreak1 Mod MariaVacationTrader • 2 years ago
I like that , but I dont like that. : (
That POP was 1999, and then it went ALL THE WAY BACK and tested those lows. That is in my wkend report.
The Good, The Bad, and The UGLY
2020 in 2020???
What is this riddle?
$2020 Gold price in the year 2020?
psst. DNR
I am not kidding, when I wrote that I was positioned long again & again, I thought that good ole Maria was going to ask me, ” But are you positioned long?” – funny.
P.S. I’ll take that ramp up in the first chart
welp, Ill chime in. I think we had the market almost burst a blood vessel over the past 2 or 3 weeks building in a rate increase – and then it didn’t happen, so there was a bit of unexpected strength in the market. And then Warren popped AAPL and everyone thinks the market is moving into a bull phase???? Thanks, but I’ll sit on my cash for now and play the PM trade. And some MJ too as I think the buy the rumour trade is going to swing into full force before prohibition actually ends in Canada in about July
Good discussion on gen markets – Bill and I had both hypothesized on Friday that this could have been a short/early DCL for SPY & NAZ. Frustrated that “they” got my stops a couple of weeks ago. I’ve had a pretty tidy profit by tomorrow if still in. But if we had dropped further would have been protected so…
Ready for gold to get kickin, deployed cash to GLD, miners!
Looks like USD #2 Chart in play this morning as USD and WTI go marching off higher hand-in-hand and we will have to wait on our miners. Possibly the smart money shorts on COT WTI did not figure on the dollar showing such strength the last couple of months.
Hi ED,
Refresh: I don’t really see a correlation where a strong dollar is necessarily good for Oil in the past?
Strong Dollar is often bad for commodities, but Oil does have a short term 72-74 price target with the recent set up
https://uploads.disquscdn.com/images/a6db91b3850e39fcb271a390372175347c87512ed3536b97a2fa45b28e75b0ff.jpg
Gold still hasn’t put in place a confirmed swing low or a dcl- it really needed to close above the 10sma near $1317/ $1318.
In the past we have seen that Gold CAN drop to day 35, 37 , etc?
With the USD breaking higher, I would watch Gold carefully and be ready to possibly sell Miners if they follow Gold.
They could resist, but if Gold decides to drop into a deeper ICL now, Miners may not be able to resist the selling either.
GOLD is at $1310 currently, and that is obviously not a problem, since it hot $1302 last week.
POSITION SIZE MAY BE IMPORTANT
But if we are on day 33 then, you would try to sidestep another 2 to 4 days down in gold? If I am not missing something in your analysis, I would be inclined to hold through such a short duration pullback, especially since it a timing issue more than distance it has to decline.
Yes, I wouldnt worry about it too much (Leveraged positions may feel some pain though), and what I would hope for is that even if Gold sold of to say $1295, maybe Miners would not lose their lows, since they did put in a swing low. Maybe they would show strength in relation to Gold selling.
Right now I am seeing some Miners green
Thanks for clarifying. 🙂
Alex, great job. Good hunting this week……….I’m currently in VLO, PAYC, EDXC, CBWTF and added JNUG and THM last week. Looking to add TQQQ and LABU this week.
I’ve been watching THM too, I sold that one a bit early & it shot up higher, but it has pulled back nicely now.
Here are some of the top marijuana stocks in U.S. exchanges and how the performed this past week:
22nd Century Group Inc (NYSE:XXII): up 9.4 percent
Aphria Inc (OTC:APHQF): up 0.6 percent
Aurora Cannabis Inc (OTC:ACBFF): up 4.6 percent
Cannabis Sativa Inc (OTC:CBDS): up 1.7 percent
CannTrust Holdings Inc (OTC:CNTTF): up 22.8 percent
Canopy Growth Corp (OTC:TWMJF): up 7.6 percent
Cronos Group Inc. (NASDAQ:CRON): down 13.5 percent
GW Pharmaceuticals PLC- ADR (NASDAQ:GWPH): up 3.8 percent
Hiku Brands Company Ltd(OTC:DJACF): down 4.3 percent
India Globalization Capital, Inc. (NYSE:IGC): up 5 percent
MassRoots Inc (OTC:MSRT): up 12.1 percent
MedReleaf Corp(OTC:MEDFF): up 16.8 percent
Scotts Miracle-Gro Co (NYSE:SMG): down 3.3 percent
THC Biomed Intl Ltd (OTC:THCBF): down 3.8 percent
Zynerba Pharmaceuticals Inc (NASDAQ:ZYNE): down 1.4 percent
Thanks Ron _ I know of many of those companies and there are some good chart set ups there.
Can I ask what you mean by “Top MJ stocks in the US exchanges”?
Are you pointing out top performers? Top money makers? Just top as in popular? I know some of those are Canadian companies headquartered in Canada, so I was just curious what they were at the top of in the US exchange.
Thanks
just a copy from benzinga on THEIR take on top MJ stocks.. .. thought was interesting
OK, thanks.
I guess I just like to know what qualified it as the top, and what it as even the top of.
If it was the Top % gainers last week, that might mean nothing going forward.
Top % gainers in 2017? That could be a good sign.
Top money making? That would be good to know.
agree…. will look at charts tonight
Some look good, MEDFF has looked good for a while now
I don’t know why, but I liked the chart of CNTTF , and I didnt have that on my list- but right now I dont see a BID or ASK price on it
I have watched CNTTF the past several weeks…go up and up…but the low volume has kept me out, didn’t want to jump in….guess the low volume wouldn’t have mattered….it’s just kept going….
QURE.. offering 28.50 last week.. nice daily and thru 32.71 could run as in gene tech ..
I’m just going to repeat that the restaurant stocks really have done well and are out performing hat the markets are doing.
CHUY, WING, CAKE, SHAK, have been mentioned repeatedly, but there were others that I didnt mention. I wanted to wait until they pulled back ( WING was one,but it broke higher Friday)
I think that TXRH ( Texas Roadhouse) may also be a good set up, but a drop back down to the 50sma would be even better
ERX is looking strong…
I agree- it seems to be breaking from that mid point, could run to $44
ERY watch for potential reversal .. no positions
SAIL – New all time highs ( I sold mine a week or more back unfortunately )
I added to ENPH back testing that 50sma again
Refresh” BAY TRADER has mentioned WBAI a few times, I do like that chart
https://uploads.disquscdn.com/images/4312c1e95b1965df9ad51c5b025ff8259af3bd9595e89b48b86e2d2657ab985c.jpg
Perhaps the strength in the USD has more to do with what is happening in Argentina and Venezuela, and the effect could be muted on commodities? Oil doesn´t seem to care about dollar strength. We have known about Venezuela for awhile, but Argentina caught people off guard last week with short term interest rates now up to 40%. Argentinians are very familiar with currency collapse and now that they can buy dollars legally, I can imagine the quantities being exchanged.
SN ( Energy) got smacked down a few weeks ago, but it has had some nice moves off of the lows recently ( 10% days)
ACAN taking off with good volume again ( Med MJ)
MEDFF – still moving higher and OGRMF has a similar set up that MEDFF had when it popped over the 50sma & went sideways, then moved higher.
Alex did you stop out of MGTI? It dropped below the 50sma.
No, I didn’t – I’m giving it some room ( Same with MARA).
Remember too that my original investment in MGTI was $1.20 & $1.18- It is still at $1.62 currently
Thanks.
MEDFF follow thru
SQ long this morning… confirming potential BO ..
BO=? Buy Out?
TWEM oversold scalp 22.53
LODE wants to go… just doesnt know it yet 😉
KSHB …nice Nog nice ..RNN enuff rest time.. move it.. lol
KSHB has been good to me, MEDFF Nice & steady climber
RNN may bull flag, and LODE does look like it wants another push higher eventually
CBDS- Light volume, so I wont trade it, but it POPPED , struggled under the 200sma, and is breaking back above the 200sma now. May make a run.
SQ, COUP, SAIL, I like those set ups
Remember trading DGLY, KNDI , GRPN – they seem to be set up again
Energy stocks – some running in an excellent manner, others not so great ( LPI took a dump last week)
😀
yes a stinky one … wow
ZOES another foody ….
Not bad- I didnt have that on my list- I’ll have to add it. That could get back to recent highs too
CRK too
NANCY – Refresh – This is another way to look at MGTI- It could drop further or it may just go sideways, but they seem to follow Bitcoin to a degree.
https://uploads.disquscdn.com/images/19c24441a864fb6b8da52954dffcc282ece0a3de17e6973d9b96dafa5117b9e9.jpg
Thanks Alex. I am keeping my eye on it.
scalp BLNK 2.36 on AMZN news .. low floater.. avg vol 38k.. over 10 million already
out 1/2 BLNK …stop under 3 rest
ECA looks like a short term trade to above $15
refresh- bull horn break
https://uploads.disquscdn.com/images/1acaf28e4d6cc20c8a80f10150653ba565208591b06ab391ca01cf2b8166795f.jpg
BLNK out another slice .. target 4.. stop under 3.60 rest
Are we on day 2 of a new cycle in the markets? Feels real, but I think its early count wise. And yes, I read your report Rusty Sticks! 😉
chartfreak1 3 days ago
“I wouldnt rule it out, but it does seem a bit short for a daily cycle.
Look at day 3 out of the APRIL DCL. Day 3 looks exactly like today, then look at day 5 – it dropped about as much as the POP on day 3, so .
when you have this kind of CHOPPINESS, it is hard to say.”
But in the April day 3 the MACD hadn’t crossed yet……..
I know that you “Read the report”, but here
refresh and read it again – lol
https://uploads.disquscdn.com/images/1755dcf59a89efbbac81404ff76708c2b3de3ebd3adf2bb83d0012039738e06e.jpg
.
When did this say that I would probably start to count this as a new DCL?
I read it again. I also followed you and bought AUY twice!
Ahahah awesome Bill
Seriously though, Don’t you think I get a lot of questions from this one guy ( name not included) that is pretty clearly put in the last several reports. = )
I thought I had you on retainer?
= )
Yeah, but what’s an extra question or two between drinking buddies??
I’m still waiting for this “tree House” gift pack 🙂
I don’t think I have your mail address! or else……….
I thought I was doing a day trip one day when the weather warms up.
Stand in line for an hr together & then sample a few 🙂
Do they sell lunch too? I’ll check the website.
**yes WE are ….
Let me know and I’ll meet you there. They sometimes have a food truck but no restaurant.
LOL – I am hoping that we have a bull flag on GDX/ GDXJ right now
BLNK out rest.. 20 mil shrs traded ..
TWMJF (WEED.TO) is a bit of a lagger in the MJ world, so I added here. They report June 27 Q4 and YE and they have a mountain of cash.
I’m riding KSHB and MEDFF (LEAF.TO) too.
ps that 37K trade that just went through was not mine!!
I’m in KSHB also, plan to hopefully hold that one for a while…:)
back in BLNK for potential wave 5 to 5.. very spec.. tight stop with house money
AAXN retested launch base. I like it here
I will say this- take a look at SPY or QQQ. That is VERY low volume so far.
Some of the individual stocks look good, but the etfs look light
Same with GDX/ GDXJ
It feels like a holiday week, the volumes are so light
So that’s a negative right? Higher prices on low volume = misleading
At this point, it does seem to indicate a lack of real buying. It can change, but higher price, lighter volume always seems like a caution to me
Small Caps seem to be where there is still strong action on this day 3 of the thrust. It’s getting very close to pushing through the April 12 high
I agree, I’d just rather see high volume as it pushes higher, like a surge of big buying, but maybe itll break out to new highs and get some of that.
Right now- I just see sideways chop that we have seen all along. Time will tell
AUY, grabbed in the high 2s, heavy… come on and kick up!!
LABU test 78.80.. then 80.50 .. light vol though
Grabbed some LABU earlier………
bought LABU fri on the 50 fib PB from 70.50 to 74.50 …. 72.55… SOXL & TQQQ also had 50 fib PB’s fri as well… added small SOXL ..
TSEM some vol thru 24.30’s test
BA back thru 50d
“…. Dive right in, baby, the water is fine …….” 😉
I like my hot tub at 98
CRK to 98 would work too (it was there in 2014)
NXTTF…..reports good earnings on April 30th but stock keeps falling, I wonder if someone somewhere knows something we don’t
BLNK some vol out of falling wedge .. mid channel test 4.28.. thru there 4.75 if goes .. raise stop to entry on this second scalp .. needs vol push thru 4
out 1/2 TSEM scalp +3.. target if goes gap fill 27
BLNK boom ! … out 1/2
have buy stop P over 7.25
SPX testing 50d … interesting insurance being bought also by the suits VIX unchanged
XTLB BO thru 2/2.50/3… missed this one… another low floater
If true, this is huge news for $BCLI. Patient saying he’s walking after 1 month of treatment for #ALS in their Phase 3 clinical trial.
Are you buying? 🙂
just saw post… haven’t seen confirmation
you have a link? I have a very close friend (36 yrs old) that is about 9 months post-ALS diagnosis. Would love to share this with him.
I tried to find it under the company name for you, but I only see the trials news and a few other news articles ( I couldn’t find that success story). Sorry
Appreciate you looking Alex. Yeah, I saw the info about the phase 3 trials but couldn’t find the patient success story either… If they actually found a way to stimulate the regrowth of motor neurons, it would be an amazing breakthrough for many types of diseases and conditions!
Yes, Very debilitating disease, with tragic end results at this point.
I found this post on Stockwits, which is from a Facebook post talking about her husband’s experience in the BCLI trails. So, can be real, can be fake, but likely not the Russians! https://uploads.disquscdn.com/images/84028394fe223e89102b30f6d16b759a195cf1f5dd13684221c0230a40954ce6.png
KOOL worth getting a few here. hourly flag
Good r/r considering the news on Friday.
earnings on 5/10
VICL
ACIA who took it on Friday? 🙂
BCLI.. phase 3 ongoing now.. no confirmation on patient .. https://finance.yahoo.com/news/bcli-phase-3-trial-nurown-154500928.html
Long SQQQ for a scalp 16.00
Got 6. cents out of this. Horrible. lol
so greedy!
I have a problem
careful 🙂
Oh I cut it FAST
I was hoping for a 200sma test on the 5 min… lol Nope
Youre BLNK, wowza, congrats brotha
may not be done.. coiling now
Took TNA as well.
there you go.. if thru 75…… retest 80’s
Yea, Im liking the Small caps much more than tech rn
SMH also strong
True, but I like it for a pull back to the 13ema, round 100… then maybe Ill go again
URG is POSSIBLY starting to make a move out of its consolidation
I’ve been sitting in this handle for a week or so myself
refresh
https://uploads.disquscdn.com/images/21bf5c62669ca519982fa5986b03b0754328d62f813301f0852a39449bc93dd9.jpg
nice. tx 4reminder
Sure- still waiting for the next leg up to start though. When it breaks above consolidation highs, it may find follow through
Short term it could be due fro a breather, but I like how leader FNV has reversed the breakdown on the daily charts, and evened out it´s 200 MA again. We need this one to be heading up if there is any hope for the group. http://schrts.co/7Gzgdq
KL is leading the charge
another ATH 🙂
That one has been a winner
Definitely improved after bottoming for a bit. Heading to the 50sma now
AAXN almost $1. beauty
NKE looks good on the day
PXLW gen frisky
I’m kind of liking GRPN here ( 50sma)
lol..yes yes i knowwww for the 89th time and 3 reports now …
*ohhhh .. snap .. that was for bill .. wasnt it …
*MYbad
snicker
Go back to work , please
what? left Translated? where are we on the SPX??
ahahahah
vroom vroom little ENPH
RNN is finding a base here.
KOOL (keep in in your radar)
I just added to that earlier today too. That little stock has been good to me over my time with it.
Hey!
😀
$OGRMF looks like it wants to go “higher”…
Deshy- your name has gone back to grey?
I took WBAI last week at 18.60 and .90 – sold half just now. nice cpl points.. LOW volume trader but chart is dope
market PB on Trump announcing decision announcement on IRAN tomorrow… oil should be interesting ..
Long DRIP scalp…
Out for .25 on half size.
nice….. DWT SCO also pop
Yessir!
Theres the scalp i wanted on SQQQ now…..
Down below earlier this morning, I mentioned that OGRMF had a similar set up as MEDFF – was crawling along the 50sma, and I liked it ( MJ STOCK)
This afternoon = POP. Refresh
My KSHB is still moving right along too.
https://uploads.disquscdn.com/images/f0f0e1457c861c558afa0135ec94e7d81e6b199c1f7f7a024e61169a89243c33.jpg
Can you say something nice about TWMJF so it does the same same
I CAN!!
TWMJF has an increase of volume today, and it is also pushing above the 50sma.
The MACD had curled up. I’ll put a chart of it in the next report- I think it looks healthy 🙂
It is a well know, well liked company in the MJ sector
For the Canadians here, THCX.V is a Quebec based pot stk that is moving nicely and near old highs to boot.
I am also watching NSRPF (NVO.V) as you’d mentioned it in a past report; I’d bought, sold for Happy Meal profit and for some reason just noticed that I had it on the watchlist lol!
IAG nice earnings. up 6ah
Up $6 after hrs- woo hoo!
Or was that 6 cents?
Or 6 miles? 🙂
The report was released at 3 a.m,
Good night 🙂
got it at midniight before bed :)-