
4-21 Take A Look
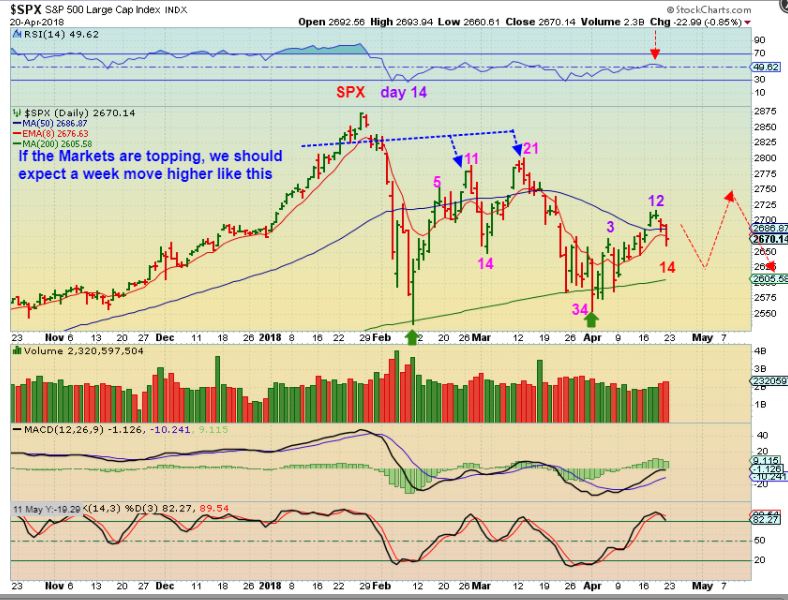
SPX DAILY – This is where the SPX stands with its cycle count. We experienced a bit of weakness at the end of last week, and you all know my Big Picture outlook. This could be playing out the way it was presented in the weekend report 3 weeks and also 2 weeks ago. On the chart I wrote week, and meant ‘weak’.
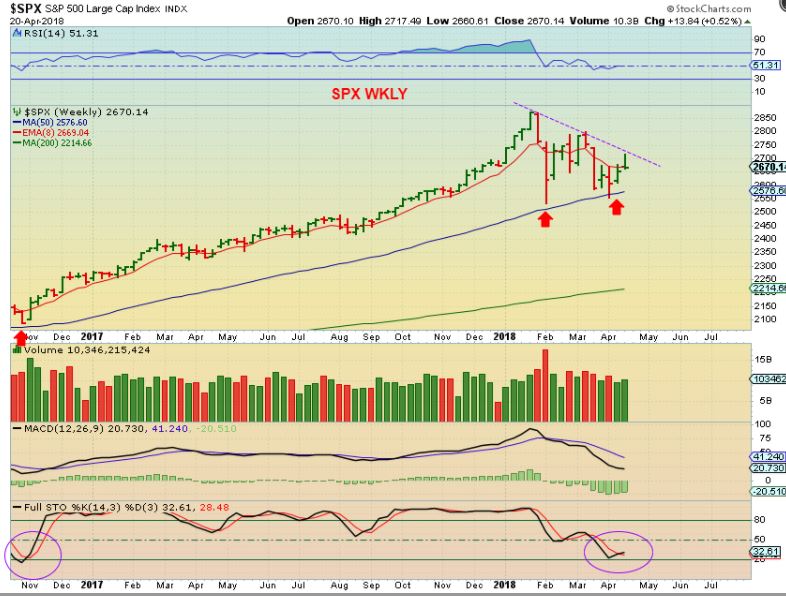
SPX WEEKLY – Nothing is wrong with the weekly chart at this point, but it was rejected temporarily at the down trend line, and I want to discuss the big picture further in this report.
I have mentioned that I want to see how the market action unfolds going forward, after we got our Feb lows in place. Just taking things step – by – step and trading along the way often leads me in the right direction sooner or later. Often sooner than later.
NOW I WANT TO LOOK IN THE REAR VIEW MIRROR.
IF ‘KNOWLEDGE’ IS SIMPLY THE ‘FACTS’, AND ‘WISDOM’ IS THE USE OR ‘APPLICATION OF THE FACTS’, THEN HISTORY OF PAST MARKET ACTION IS THE ‘KNOWLEDGE’ THAT CAN GIVE US SOME WISDOM MOVING FORWARD. IN OTHER WORDS, IF YOU WANT TO KNOW HOW PRICE CAN ACT GOING FORWARD, TAKE A LOOK AT PAST MARKET MOVEMENT. THAT REAR VIEW MIRROR CAN AT LEAST GIVE US THE CLUES WE NEED TO ACT WISELY.
LET’S LOOK AT THE SPX 2007 top – It came in the form of a double top for the SPX. Note that OCT 2007 was THE TOP.
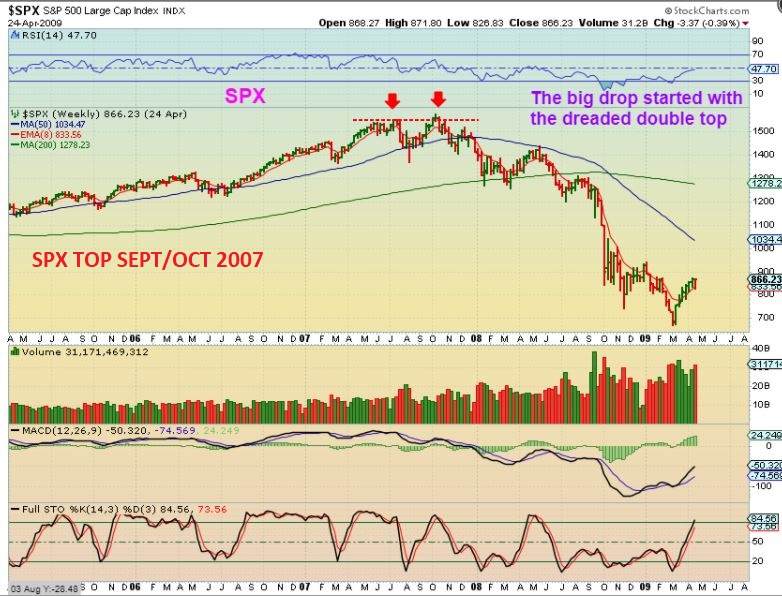
COULD THIS FORM AS A DOUBLE TOP TOO?– Yes, so we will watch many different things going forward, but already my Quarterly & Monthly charts have warned us of that possibility. Right here and now, this doesn’t look horrible, but Time will tell. Let’s dig deeper…
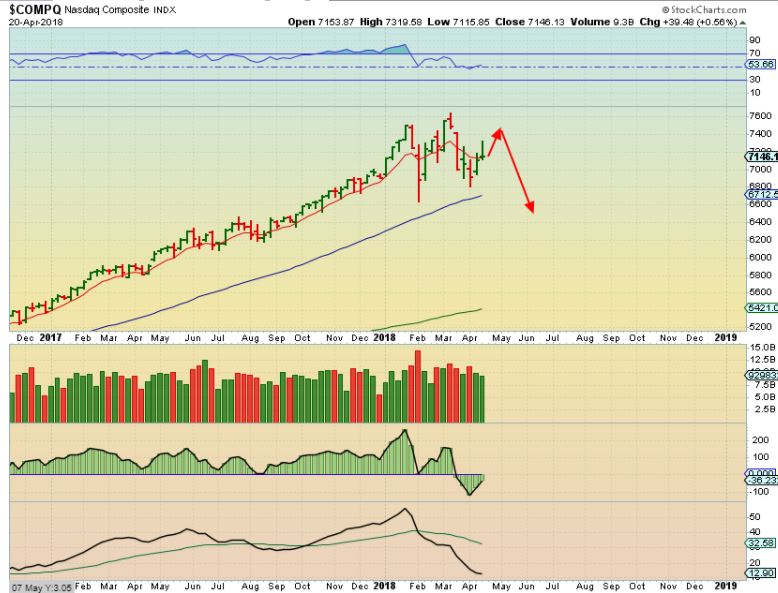
NASDAQ 2007 top – A different kind of top, not a double top like we had with the SPX. The NAZ had a higher top that formed a H&S. Note that THE TOP was also Oct 2007. Currently coming out of the FEB lows in 2018, we also just saw the NASDAQ form a new higher high, while the SPX & DJIA did Not. Are we currently forming a right shoulder here in 2018 too?
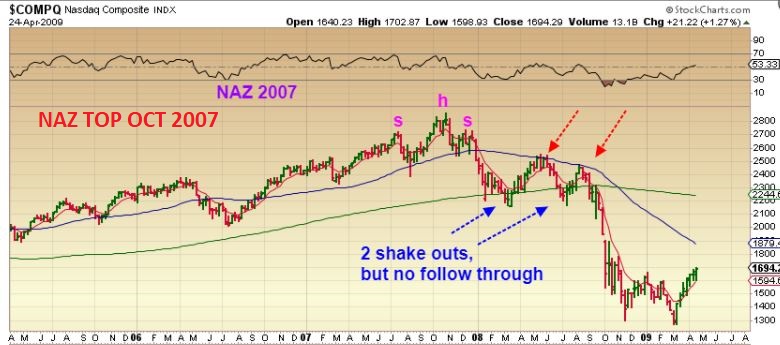
NASDAQ NOW – Are we currently forming a right shoulder? Time will tell, and I am constantly covering this in the daily reports. My weekly and daily indicators are showing weakness, so this needs to pick it up soon or it is in danger of topping or consolidating for a prolonged period of time.
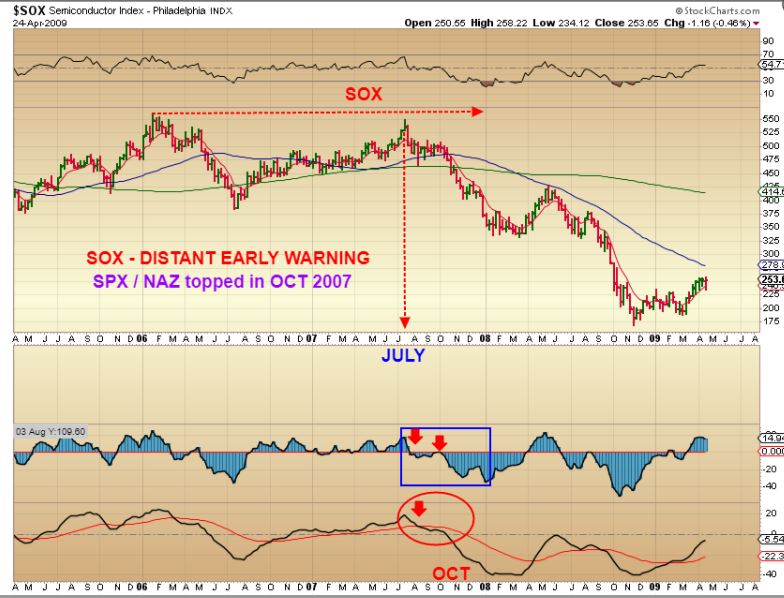
NOTE: In 2007, THE SOX topped Earlier than the SPX – Interesting, the SOX topped well ahead of OCT 2007 when the SPX, DJIA, AND NASDAQ topped. It double topped in JULY 2007.
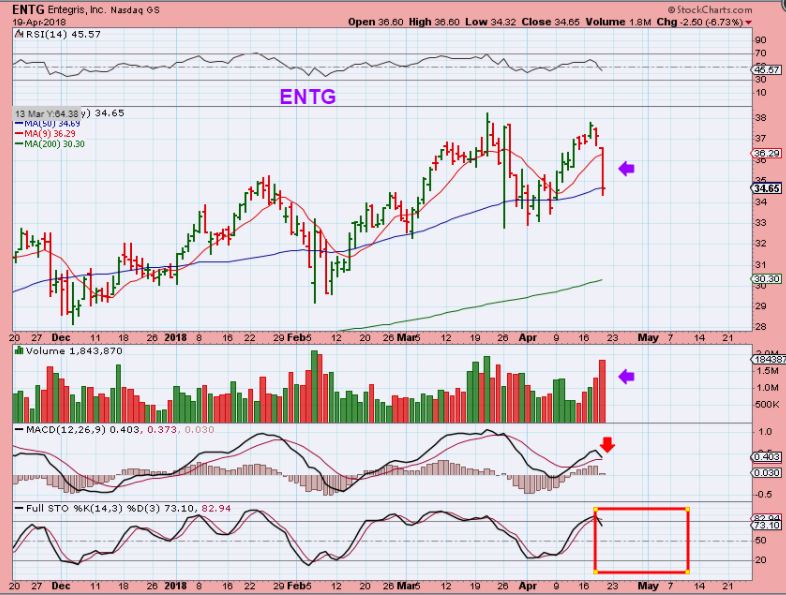
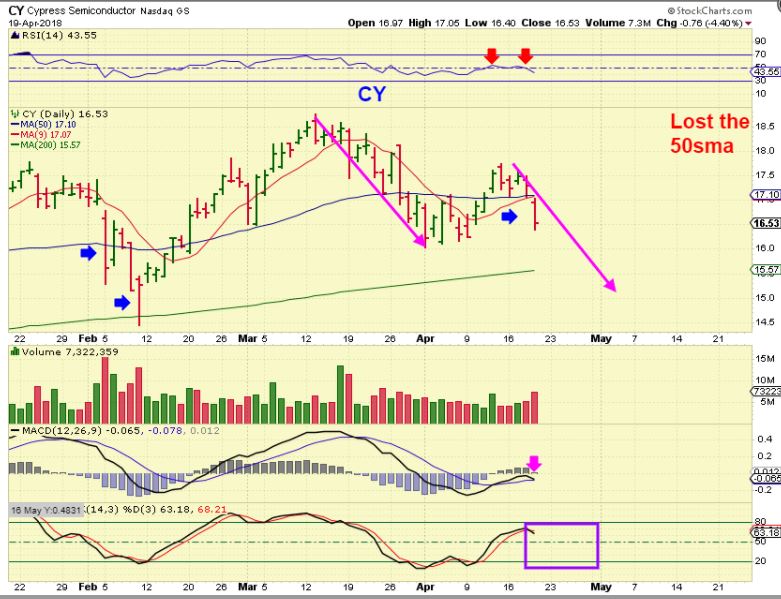
I posted this drop in our daily reports this week, saying that I am thinking about the weakness in SOX , and I listed several Semiconductor stocks that had a high volume drop too. Signs of a possible top in place for the SEMI s ??

EXAMPLES THAT I POSTED IN THIS SECTOR OF WEAKNESS THAT I WAS SEEING ARE BELOW

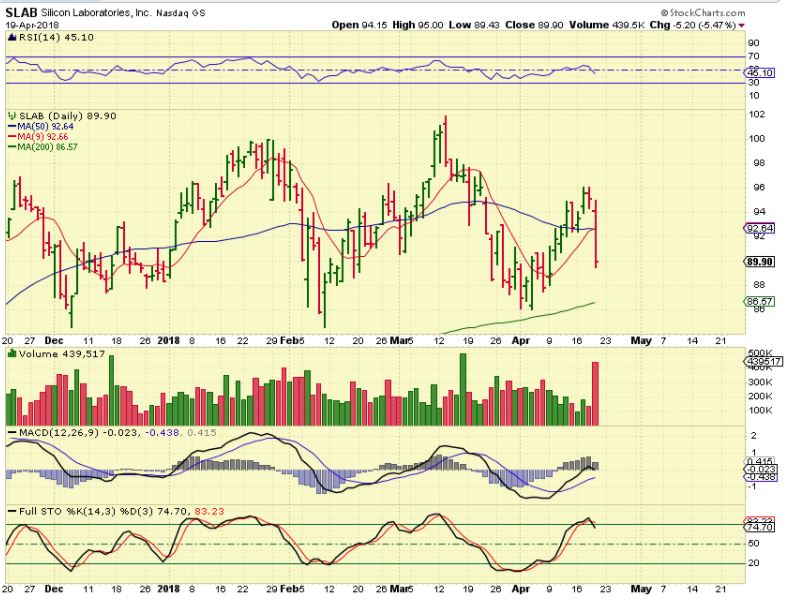

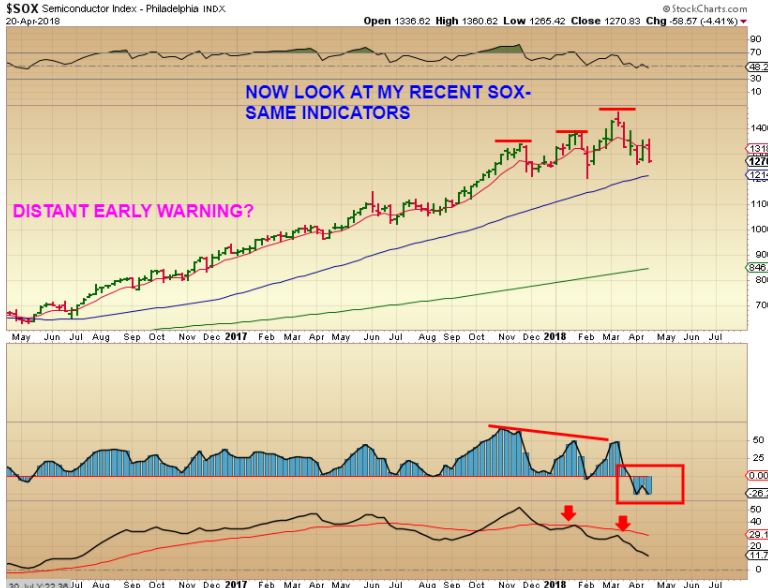
SOX NOW – The long term indicators that I developed are showing weakness on the last 3 new highs heading into March, and now the Semis are dropping on heavy volume. Look at the relative strength (RSI). This could be distribution at the top. In other words, it could be a top. I’m staying away from Semiconductors at this time.
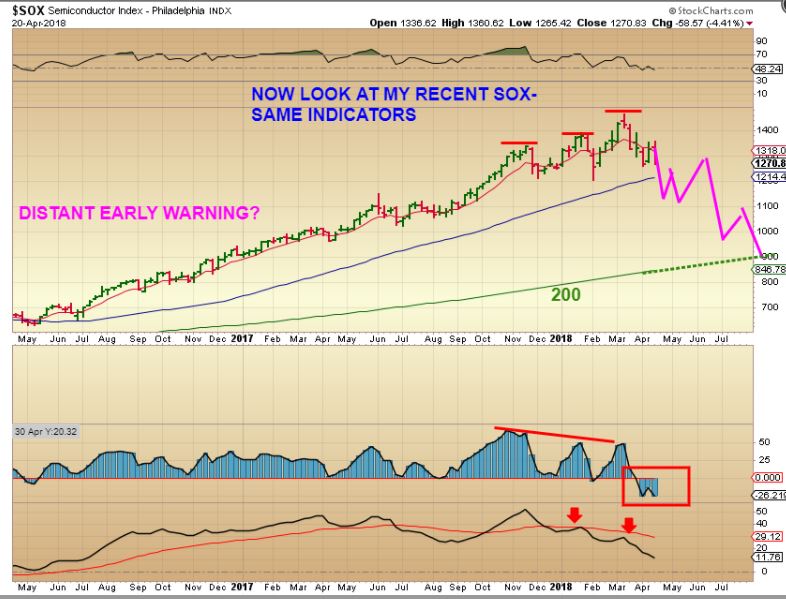
SOX POSSIBLE PATH – This is not a prediction, but it is a path similar to one that history says the Semiconductor sector could take.
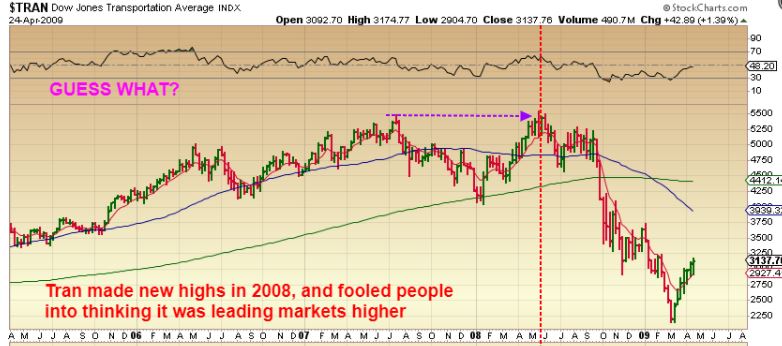
TRAN APRIL 19- What about the fact that the transports broke higher this week? I posted this nice push higher while last Wednesday with good volume.
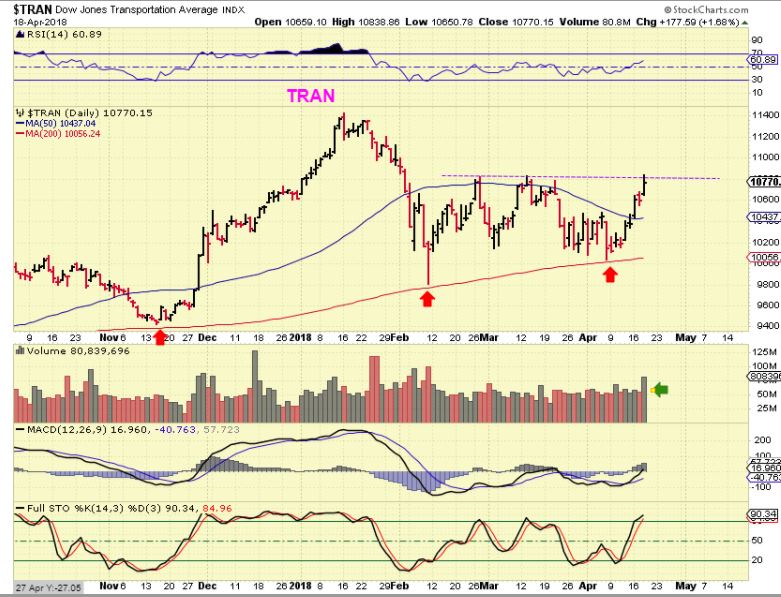
It might just be the shiny object that distracts us from the reality of a top forming. Look at the TRANSPORTS during that 2008 top. Remember that SPX & NAZ topped OCT 2007. Did the TRAN top on OCT 2007 like the SPX & NASDAQ?
TRAN TOP MARCH 2008 – IT ACTUALLY TOPPED 7 MONTHS AFTER SPX & NASDAQ TOPPED OCT 2007. So what does history tell me here? Don’t simply look at the TRANSPORTS to see whether or not markets are topping. THEY MADE NEW HIGHS 7 months after the SPX topped, but met the same fate later.
Conclusion in the General Markets: I have been reporting in our weekend reports my thoughts about the Big Picture and nothing has changed, even though the little day to day reports had some long trading set ups and some charts are still holding above the 50sma ( SAIL, IO, SQ, etc). I am sounding a warning of caution, we may be seeing distribution as a top forms. Not to worry, my reports have also been pointing out the ‘Bottoming Process’ taking place in other areas, and I know that they can be quite rewarding, also based on history and from my own experience.
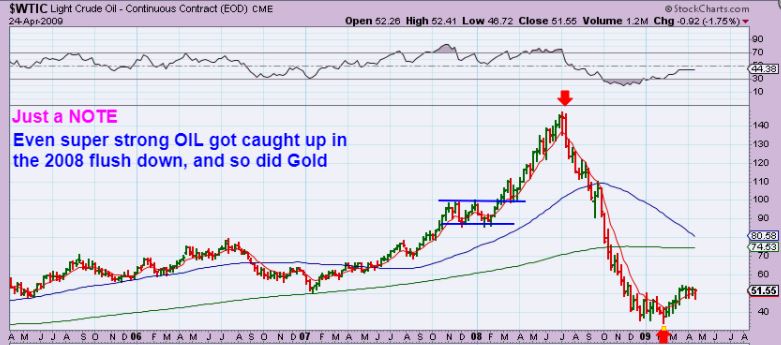
IF THE MARKETS DROP, DOES EVERYTHING GET DRAGGED DOWN WITH IT LIKE 2008? Good Question.
WTIC WEEKLY 2008 – Oil did get caught up in the selling, because we were having a global crisis, but notice that when the SPX & NAS topped in OCT 2007, that is when OIL RALLIED to parabola. The sell off came later.
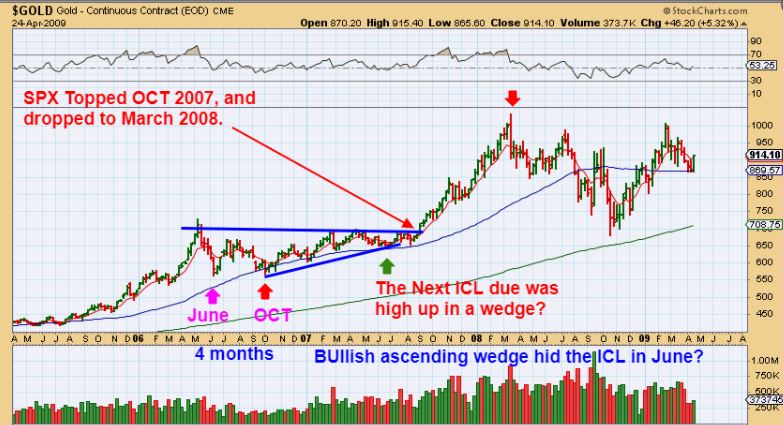
GOLD WEEKLY 2008 #1– When did the General Markets top? Oct 2007. Notice that Gold rallied for 6 strong months after Oct 2007, then it put in an inverse H&S and rallied into 2011. In 2008, Gold back tested the BLUE WEDGE break out as it dropped into an ICL. I WILL USE THIS CHART AGAIN WHEN I DISCUSS GOLD.
MOVING ON TO CURRENT MARKET CONDITIONS
USD DAILY – The USD looks ready to move higher ( Short term), and this can push Precious Metals down. Maybe it runs to 92?
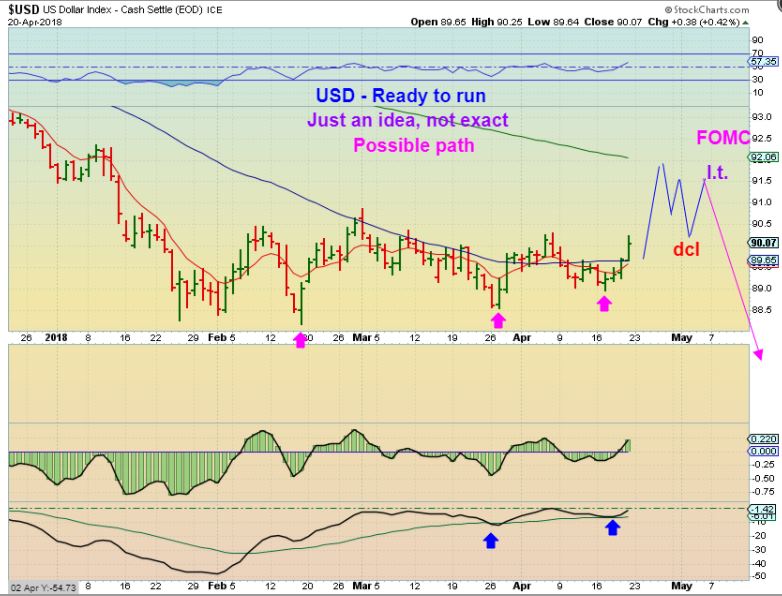
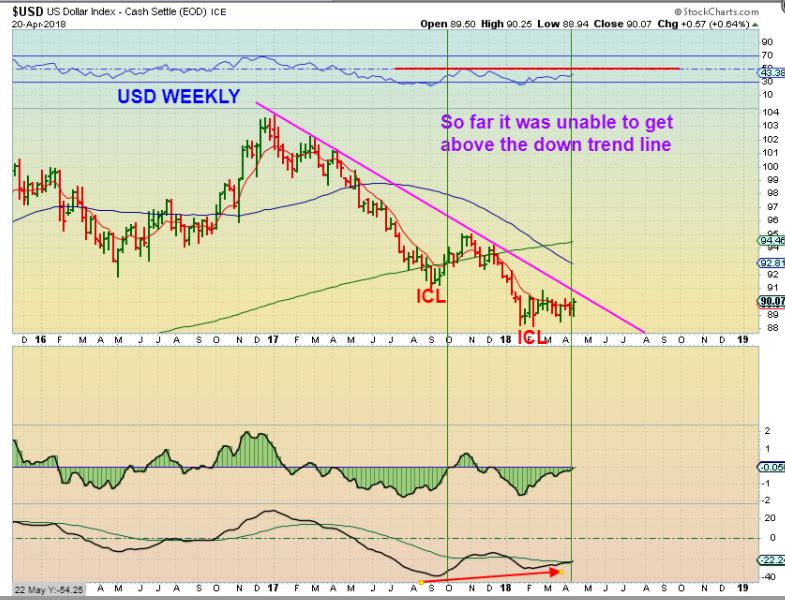
USD WEEKLY – The USD is in a major down trend and so far has been unable to cross the magenta down trend line. 91 or 92 breaks that line, so we could see a false break out.
GOLD WEEKLY 2008 #2– I found this to be interesting with this chart too, applying it to todays set up.
1. Markets were topping Oct 2007 ( They may be topping now) and
2. GOLD broke out from a wedge when it was really due for an ICL. THIS is the kind of thing that most analysts could miss. Let me explain…
3. Take a close look at June & OCT 2006 ICLs. WHERE IS THAT ICL 6 or 7 months after the OCT ICL? It was stealth in a wedge. BURN THAT INTO YOUR BRAIN FOR A MINUTE. A mild dip at the APEX?
4. I have always said that Triangles seem to obscure cycles counts & cycle action. I HAVE ALSO SAID THAT I OFTEN IGNORE CYCLES IN TRIANGLES. It looks like that blue ASCENDING WEDGE obscured the ICL and changed the way cycles normally act.
5. Again, BURN THAT BLUE WEDGE & ICL INTO YOUR BRAIN FOR A MINUTE. BUY THAT BREAK OUT.
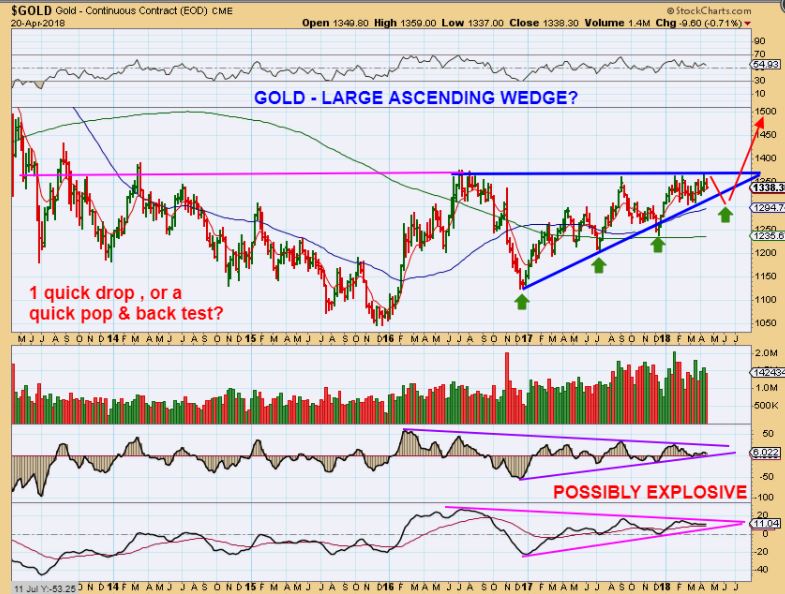
GOLD WEEKLY – Hey Look , a BLUE WEDGE with an ICL due. Gold is pushing on the 2017/2018 highs. So I drew in a dip, since the USD is set to rise, but we do not have to expect a DEEP DIP into this ICL, in my opinion. We’ll look for a confirmed swing low, but at the same time, we have been buying Silver stocks over 2 weeks ago, and they are higher.
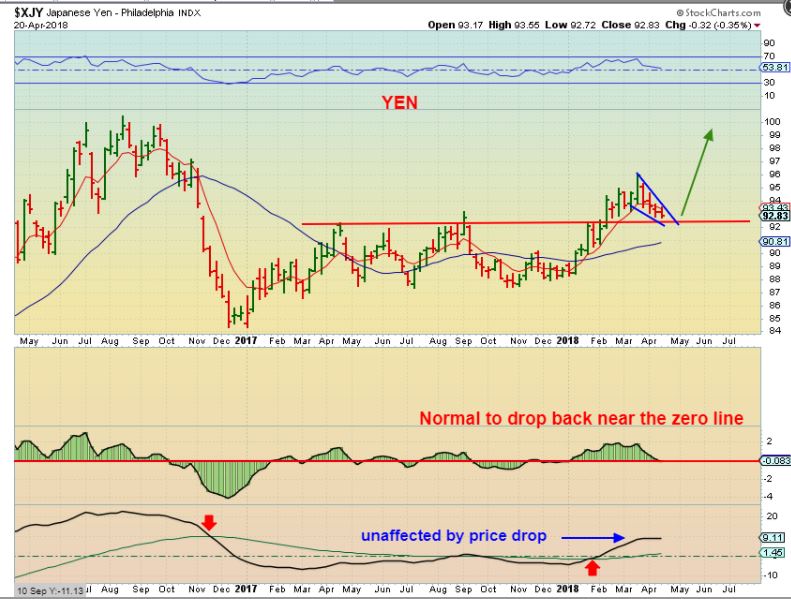
YEN WEEKLY – The YEN broke to new 2017/ 2018 highs already, and Gold tends to follow the YEN. If Gold did this type of break out, say at the FOMC MTG in early May, it could put in an ICL dip like this yen back test, as a June ICL too. Just an idea of how things could play out.
SILVER DAILY #1- Silver burst higher this week…
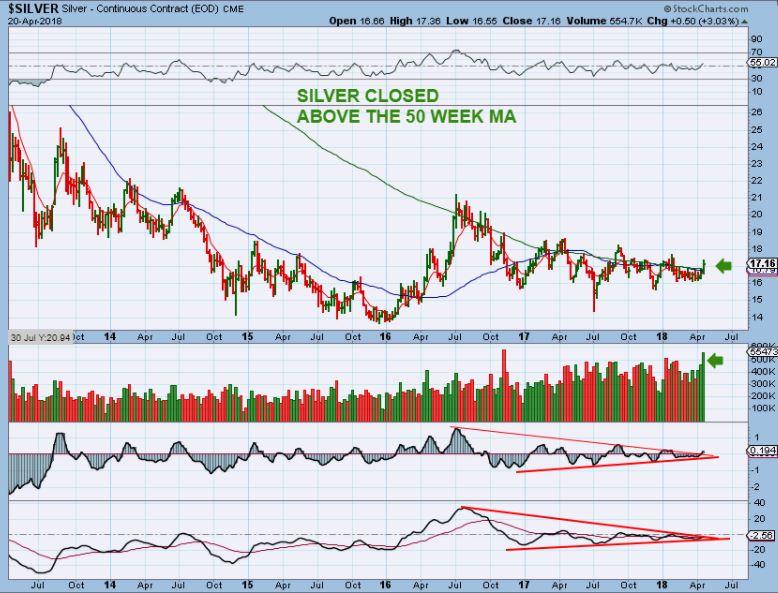
SILVER WEEKLY #2- Volume swelled, and we have been discussing the very bullish COT. It has paid off holding some Silver stocks, but it isn’t too late, this break is fresh.
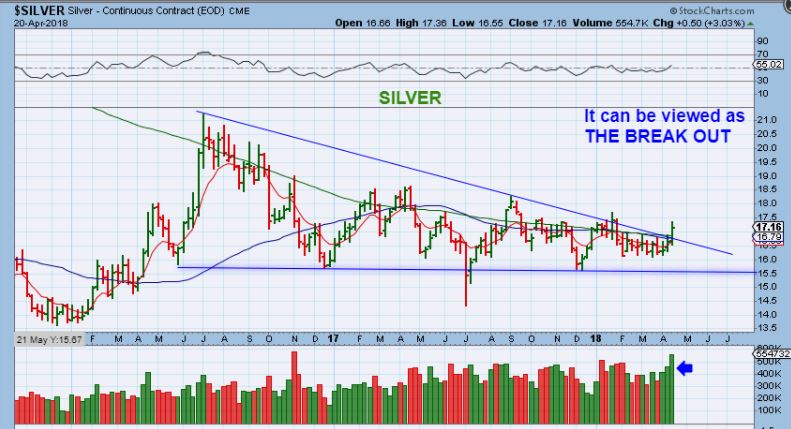
SILVER WEEKLY #3- The last few break outs fell back down, so I am looking for follow through.
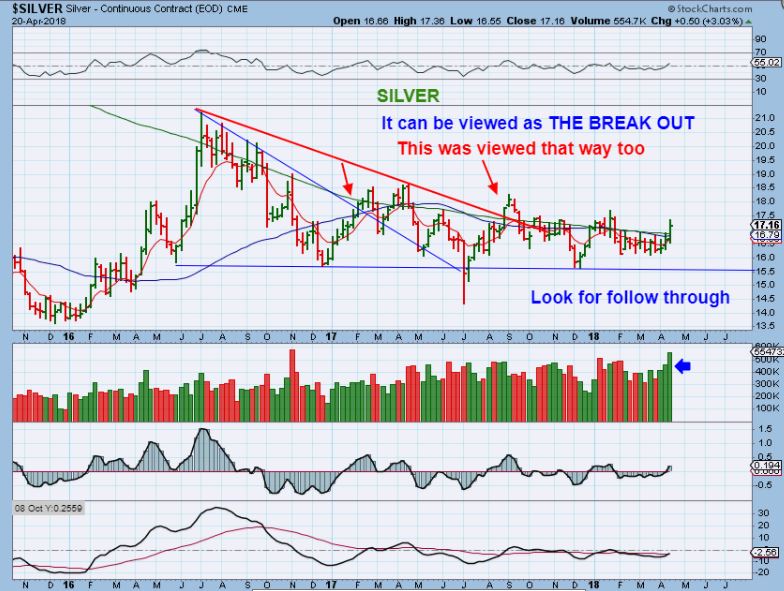
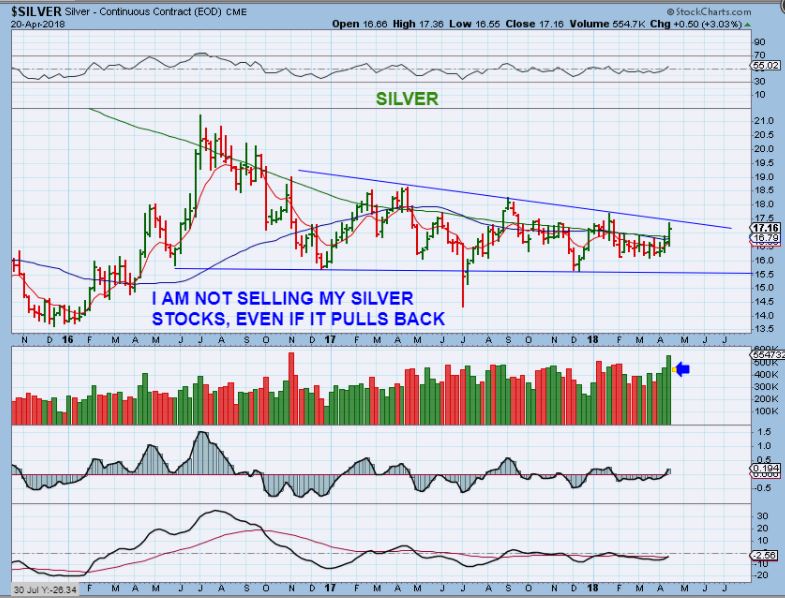
SILVER WEEKLY #4- Drawn like this, we need follow through to break resistance. This really becomes ‘Buy the dip’ or ‘Buy the rip’. The daily reports will discuss this further.
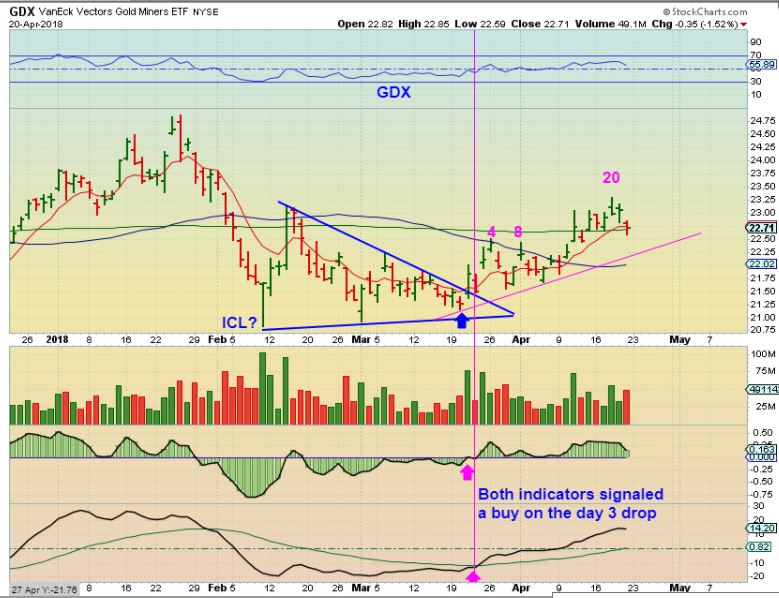
GDX DAILY – Day 20 really has this forming a right translated daily cycle. GDX looks like it wants to form a cup here at the $24 area. Does that match what we expect on the weekly chart?
GDX WEEKLY – We are at that line in the sand discussed last week. GDX have turned down here or continued higher. Please read the chart.
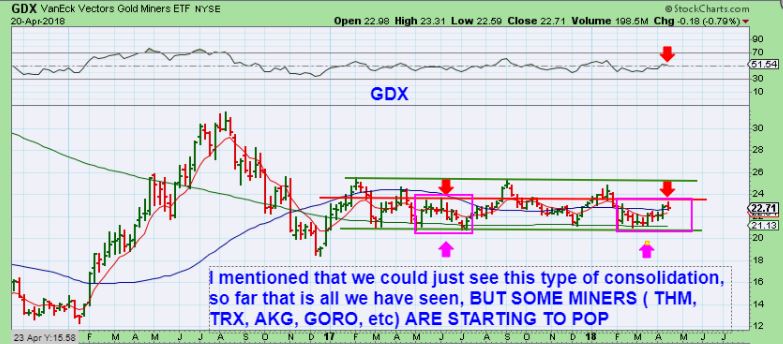
GDX WEEKLY – Some of the individual Miners like TRX, THM, GORO, etc have been bursting higher, so I am still holding the Miners that I purchased a while ago.

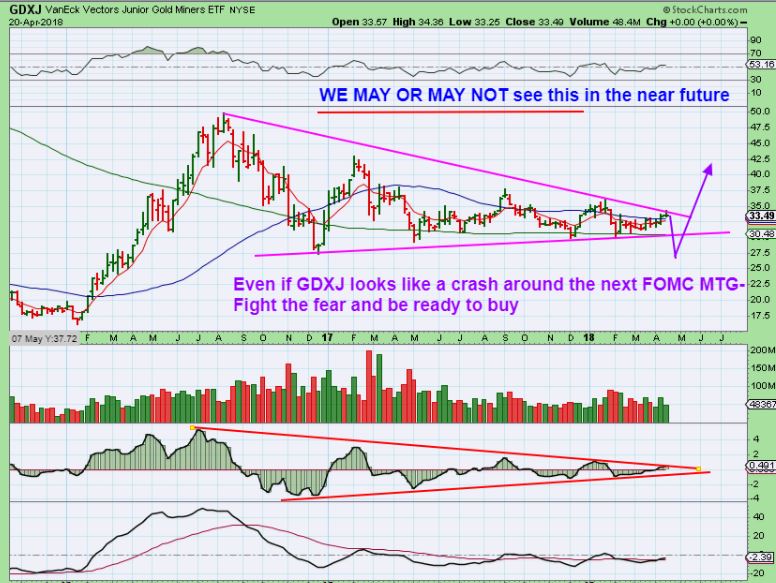
GDXJ WEEKLY – The Big picture looks quite bullish when it comes to our MIners, but a shake out or stop run is possible. Please read the chart.
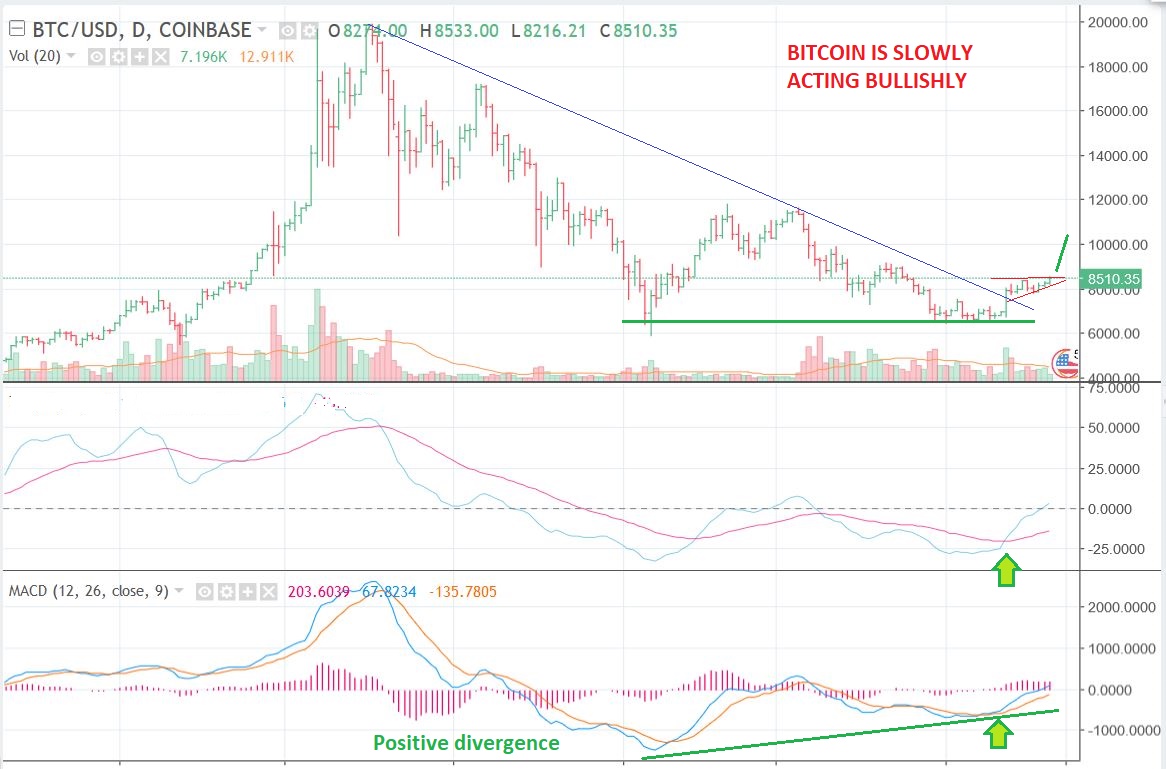
Conclusion: In the daily reports over the last couple of weeks, it seems that all sectors have stocks that are setting up and running bullishly. We have been trading Tech stocks, Biotech, some Energy stocks, as well as Miners that were lining up quite nicely, and as mentioned in the daily reports, BITCOIN is now becoming interesting again. I took on a couple of Block chain trades that are showing nice profit already…
Many stocks in that blockchain area ran swiftly in Oct- Dec have now based out and seem to be setting up to run again. Medical Marijuana is another area that ran almost straight up last the end of 2017, many doubling and tripling. Now we’ve seen a few perking up out of recently formed bases, so we really have not had a shortage of trades to look at. I think that most of these set ups will continue to play out bullishly too. Finally, most here have traded the Miners in the past. The gains in that sector, especially when timed correctly, can be exceptional. I am really excited about what is happening in the precious Metals sector, and I look forward to the coming weeks. These can be very profitable trades, and since they can also often be bought and held for weeks, this allows you to relax and just enjoy the ride ( and maybe you’ll even have time for a few other hobbies that you enjoy on the side).
.
Of course, we will continue to discuss these things further in the daily reports, but for now that is your Big Picture Weekend Report.
.
Thanks for being a chart freak with me, and have a great weekend!
.
~ALEX
MORE ‘REAR VIEW MIRROR’ HELP REGARDING GOLD WILL BE FOUND IN THE NEXT DAILY REPORT


Alex, thanks for your detailed coverage of the general markets. I really appreciate it since I like to trade the index ETF’s (TQQQ, UDOW, TNA) and I know that several of your other subs do as well.
I bailed out of the last of my TQQQ on Friday to lock in gains and I’m now 100% in cash because my charts are looking bearish and I am beginning to think that the medium term outlook for stocks is not going to be as great as I thought it would be at the beginning of this year.
Keep up the GREAT work!
Well, its still early in the daily cycle, and this should only be the 2nd daily cycle since Feb lows, so I would think that we can get some more upside, even a double top is possible. The drop with volume in the semiconductor stocks did seem to just come out of no where, and it could be another early warning, and there are signs that distribution may be taking place- so it is a cautionary weekend report.
I like many set ups that I am seeing, and would like to see them continue to play out bullishly.
2018 could be a change from what was more bullish, to what will become more bullish. There is still money to be made 🙂
Yes this drop may reverse quickly and I will get back in, just taking my winnings off the table temporarily. I’m trying to trade around the dip and as I said last week, sometimes that works, other times it doesn’t. We’ll see soon. Also, I want to move money into metals and miners, so I’m not expecting stocks to “crash” or anything like that just reallocating some of my capital.
Yeah, I’d like to see the markets regain that curled down 50sma pronto. I definitely see signs of weakness in various areas – SOX being the stand out – they need to resolve soon
Great report, Alex, helps me keep perpective when I´m loaded up. I also won´t sell anything into an FOMC pullback just because going lower, unless I hit stops in which case I will. Luckily, I have a decent cushion and my stops are far away at the moment.
I have debated moving them up some so I can´t lose if miners pull back, but those new levels are areas I would expect to see miners trade at if we get the pullback into FOMC, and they what would I do, basically have to turn right around and buy again maybe even higher. Because I don´t expect huge downside and don´t want to sell out only to try and get right back in, I think I will keep stops as they are. Especially since some of the names were more difficult to work into with big size, like FFMGF and SVBL. I am not sure I could buy those back easily as they often move 10% in a day, not with big size anyway.
I still have some money to add to positions, hope I am seeing straight and can do it, when and if the pullback comes. About the only thing I don´t like about my situation right now is that we are in the weak months for miners soon, but they didn´t respect history earlier in the year either when they couldn´t stay strong.
I pretty much agree with what your saying.
really wanted to sell my TRX the other day when it got extended, but I remember these runs in miners at the start of the 2016 run as they got extended- they’d start to drop in the morning, and end up green or ‘even’ by the end of the day. That would happen day after day- they’d hang at the highs until they were no longer over bought. If you get that for several days in a row, you end up with more of a bull flag or sideways move to the 10sma. THM & TRX feel like they are doing that at this time. They may drop/ they may not, so I don’t think that I will sell, but I sold FSM and it is holding on to recent gains too. Hard to get back in until we dip to a dcl.
That said, I know that a pull back will come at the next dcl, especially if it becomes an ICL, and the timing is in line with the FOMC. I’ll probably hang on to my TRX & Silver stocks & just add on the dip too. I’m not super heavily invested yet anyway, and I have other sectors to cushion the blow if they move higher while Miners pull back.
I like the cautionary message, but my guess is we will sees weakness until part way through the day on Monday and then the second leg up of the DC will start. I’m protecting where earnings are close and letting my stops rule for now instead of attempting to predict. I would like to wait for an ICL in metals. That always seems to be the path of less grief.
Yes, Ron, I pretty much agree.
I am not panicking by any means, but caution is what I see, and I need to start reporting that to my readers as soon as I see it so that they are ready to act, if need be. .
The SOX is breaking down, maybe even heading down to the 200sma for now.
In the big picture report, I cover the big picture, but I threw in a daily chart because if you check it out….
the SPX , DJIA, and NASDAQ lost both the 50sma and the 10sma Friday. The recovery will tell a lot, the lack of recovery would say a lot more.
I’ve simply been watching how this unfolds after the FEB lows , and the 2nd & 3rd daily cycle will tell me
Monday action will be helpful 🙂
$GOLD breaking ascending triangle to the downside. Let’s see if it holds…?beginning of ICL?
A fast drop into the FOMC MTG would be great , in my opinion.
That’s the one I’m patiently waiting for. =)
Me too , if a dip comes and we are in the timing for a DCL ( Possible ICL) at that time.
. MAY 2 ( NEXT WEDNESDAY)
Wouldn’t ICL be more likely May 16 at FOMC?
what about the USD possibly breaking the down sloping trend-line to the upside?
Yes. But should stop at 200 day.
I mentioned it in this report
I know, you mentioned that so far it has been unable to break to the upside – I’m not sure where your number would be to constitute a break, but it must be either there or getting close.
In the weekly chart of this report I said that if it breaks that done trend line, It could be a false break out , because I do not expect a bullish dollar.
In the chart above it I showed a possible 91 or even 92
No- the FOMC is not May 16, it is scheduled at May 2nd.
That is why I said in past reports early May ICL possible ( FOMC MAY 2) , next Wednesday
Ahh, I missed that.
Go MGTI! That and my MJ stocks are the few green spots in my account today.
Hope they ALL turn green for you!! = )
You too! And I will make that wish for all our fellow Chartfreakers! For now, our MGTI has gone over the 50ma, however briefly….now we request a giraffe neck up to the 200ma!
could become jnugable
I’m stepping out for an hr or two- might miss the market open, should be here shortly after, have a good one all
FWIW…just a revisit to that daily $BPGDM:$GOLD ratio, with PPO indicator (similar to MACD), I posted a couple of months back.
This looks like a convincing b/o… the significance of which, now remains to be seen
https://uploads.disquscdn.com/images/da6be49773c77dd642eca640d4af6982577246ec19018d676609cc1e35174e3c.jpg
Should eventually get us somewhere; I’m still expecting at least a decent pullback for now. Especially with the USD and rates absolutely ripping higher this morning.
took a stab at SOXL in the pre-market
perceptive, poignant, probe perspicacious purveyor …
plenty2ponder
peace&prosperity 2usAll
;o)
phew!
” …Burn that into your brain …”
Lol
A few observations on the miners and metals. Silver has been the recent obvious long and thus getting hit harder today than gold, while miners are still doing better than the metals themselves, in general. My smaller juniors are holding in much better than my more recognizable names, which has been the case for awhile now, if anybody is looking to get involved in the group.
Overall it´s not as bad as I would have though with both gold and especially silver getting hit so hard. I won´t be buying today, but will add if the weakness can continue into tomorrow morning.
I am in arngf, sgvsf and they do not want to go down at all for me to add. actually no trades in arngf, nobody wants to sell at a discount and nobody wants to buy too high?
It feels that way to me as well, as if there are only long term holders, insiders, etc left who are not considering selling, and just a few people that have bought recently and are more traders, so try to get out of the way of these pullbacks. The selling doesn´t feel heavy, or panicky at all.
I cant find ticker SGVSF
I gave you the wrong one sgsvf, Sabina gold
Ah, yes , Thanks-
light volume & so far dipped down to the 50sma.
It would be nice if that held & it just crawled along above it during a GOLD dip
Added HL at 3.79 – ready for the ride
True as much as metals are down, surprised that miners aren’t really getting smoked – but that has been CF’s message all along!
I bought MGTI as it broke the 10sma, and added again later.
My position is up about 50% already.
MGTI is at resistance and it could stall / pull back/ or MAYBE break out- but this is where I would usually take off 25% if I was heavily invested. I won’t sell it all, as you can see, it is on a buy signal and remains quite bullish for now
See chart
https://uploads.disquscdn.com/images/6f21d642656c5e7d1333e70657626216d3bd77ce8af1484d42fb526df1b200f4.jpg
Thanks for the update chart…and reminders.
FSM, AKG, THM are pulling back, a buy opportunity i n the future
TRX is green so far
TRX is now even moving higher. I’ll take it 🙂
Has anyone noticed a 3 month chart of PZG- That one snuck by me.
Alex. How are we going to judge whether the next dip at say the FOMC meeting is an ICl or just a DCL?
I have mentioned that I am watching Bitcoin and Medical Marijuana set ups, and taking some trades. I have warned that I may be early on some , they are a bit tricky & can be a rough ride. This is what I did last October, and after they moved off of the lows and traded predictably, I started presenting more set ups here on their pull backs. I am pretty much thinking of doing the same here, if they continue to act properly.
Recently I have discussed MGTI ( I own ) SSC, I still own, SRAX, I sold a while ago, but may re buy) and I am going to mention another . THESE MOVE FAST AND ARE TRICKY. Up & down 10% is not uncommon.
HVBTF- My average on this one is $1.13- I bought the base break above the 10sma, and added a bit higher= avg $1.13.
I added again here at $1.27. WHY? It is holding the 50sma for the 2nd day. Volume is good. RSI is above 50%. This could run to the 200sma, that alone would be a good % trade.
I will then use the 50sma as a stop for 1/2 of my position now going forward.
refresh for a chart
https://uploads.disquscdn.com/images/a9a07dd67d221b29f096f4be5fd3042bd2fa3abce157eeafab8110b7beed10b5.jpg
P.S. SSC dropped to the 50sma and held today. It was a pretty big drop, so I didn’t add, but it does look like it may hold.
Most of my MJs just got crushed today. 🙁
Anyone else think natural gas smells good here? I bought a little BOIL Friday.
used to trade all the time but just been too range bound last few months for me… pivots 2.659/2.79 … GL…
ugly HS intraday XBI/LABU.. scalp only LABD..
low float du juor today CHEK .. 1/12 RS last week to keep compliance with nasd
Terrible earnings = +86%?
sell 1/2 LABD
Short trade…….
yes.. day trade scalp as XBI ugly intraday HS ..
Really nothing to like about any of the action anywhere. Getting close to just selling the farm and raising cash for a bit, probably until at least FOMC.
TVIX scalp .. tight stop.. needs SPX break 2660
So will the supposed dumb money be right on silver this time, the speculators taking the commercials to the cleaners?
cashing in and calling day as so far 2660 holding… cheers..
Nice work
thx..
AAOI nice rounded bottom.. unconfirmed rumor take out at 50.. no position been on watch
WOW, THM is finally going to give us a chance- that is the one that I sold when I was holding TRX & THM
GORO dropped to the 10sma and recovered a bit- nice chart.
It could very well be that the Miners take a milder pull back, as we dip down here. That would be fine with me.
Yeah, but we seem to be starting the dip already. Doesn’t seem like a good place to add or start yet. But I’m getting a plan ready for when it’s time to BUY!
Tuesdays report has been released