
Thursday March 29 – Still Waiting
Well, unfortunately, neither the shorter term trading nor the medium term investing is really playing out very well right now. I have mentioned several trade set ups in the past week, and they have almost all started off great. Price popped and gains were there, but these choppy markets are causing those gains to evaporate. If I dont sell my trade in a day or two, I’m finding that the price comes right back down to break even or a loss. It does get frustrating when even the set ups that usually work out well get whip sawed.
THAT SAID: We could be close to a bottom in the General Markets, but really until then, I tend to think that it may be best to try and be patient and continue to wait for the market sectors to begin trending higher. If you cannot do that, at least do as I have been doing, and Keep positions small and on a short leash.
Let’s do a quick review, not much has changed…
SPX FROM MARCH 19 – Looking at past double bottom sell offs, we could see this.
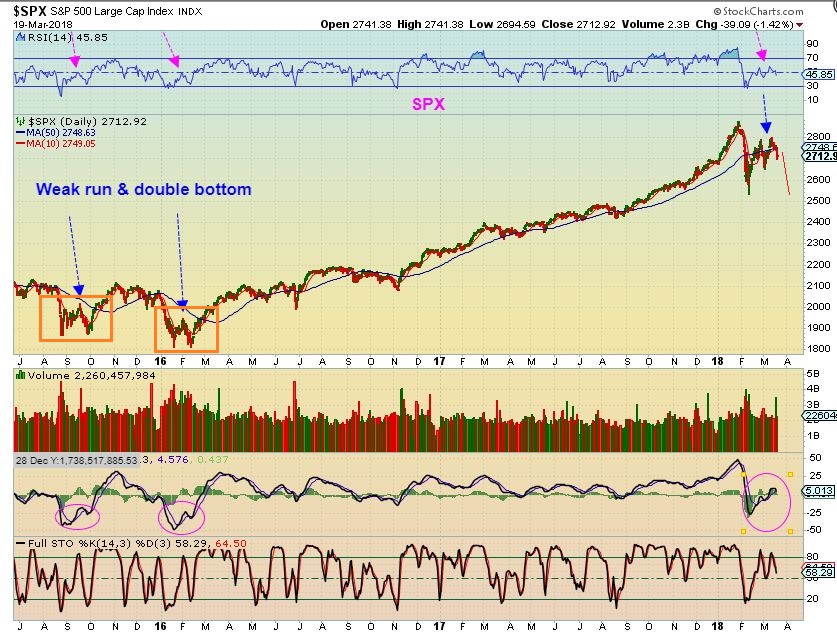
SPX – When we dropped, the SPX landed on a lower channel line March 23rd and …
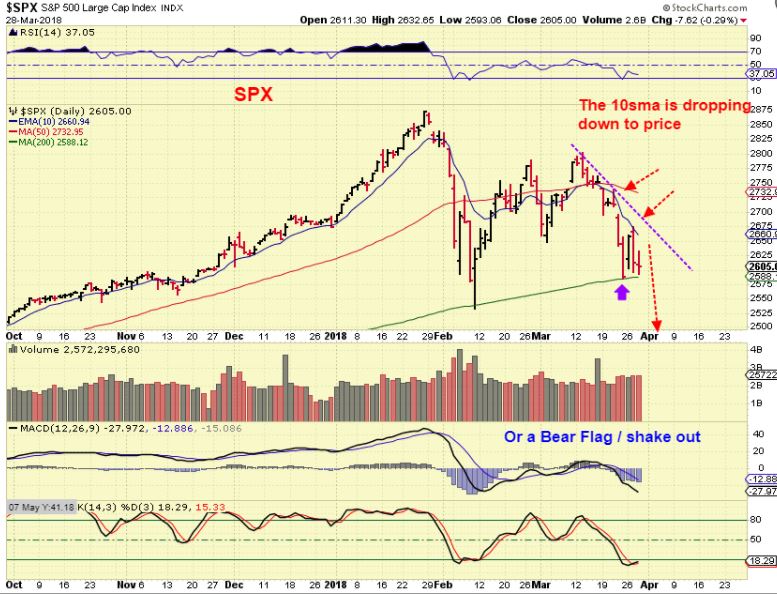
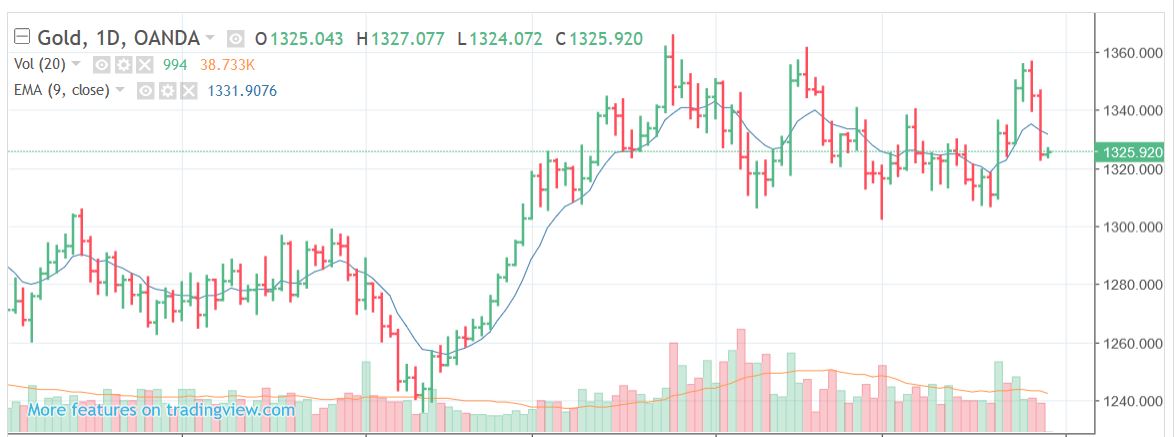
SPX – It is still there. The markets have been choppy, rallying, dropping and really not going anywhere. This has allowed the 10sma time to drop lower, so now it will be easier to move above it. IF the drop has finished and we get a dcl here, the ICL was at the February lows.
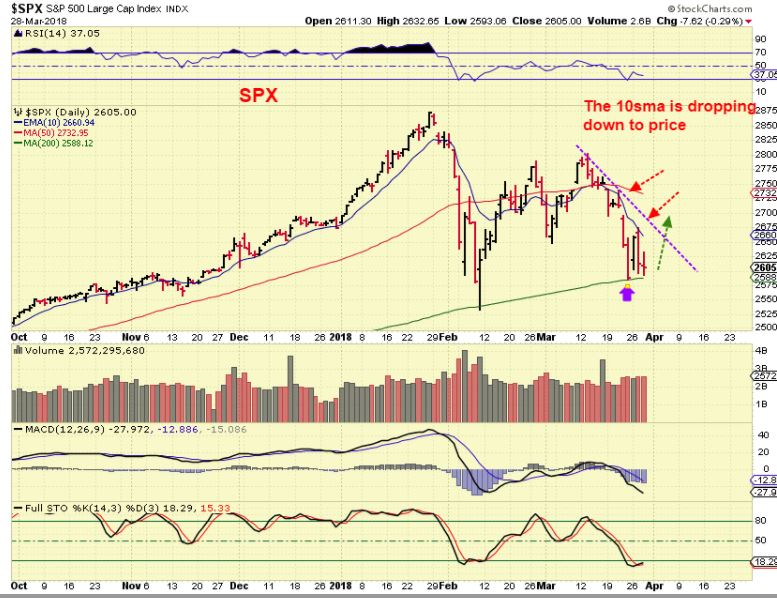
SPX – If we drop further, we could get a quick shake out and the ICL would be at that new low. This ‘pause’ would prove to be a bear flag, and at this point, a bear flag does seem more likely with more downside. I Expect a shake out here, so waiting for a confirmed swing low is a good idea.
COMPQ – The NASDAQ eased the parameters for a swing low, but this really looks like it could drop further too. Time will tell, We are still waiting for a confirmed low.
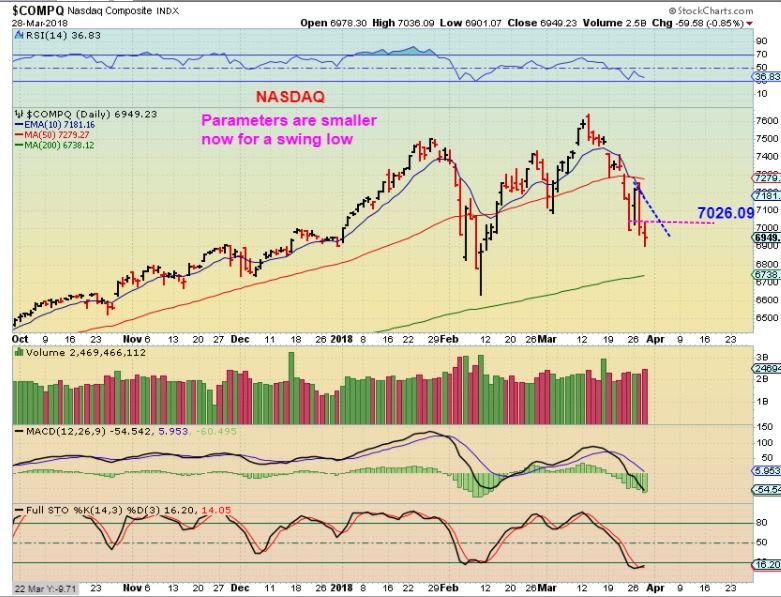
GENERAL MARKETS SUMMARY– We are in the early timing for a DCL, but until we get a confirmed DCL, I actually lean toward a bear flag in the SPX and another drop in the SPX, DJIA, and the NASDAQ. Each morning rally or Gap up sells off. Finding additional Buying to give us some follow through above the 10sma is the problem.
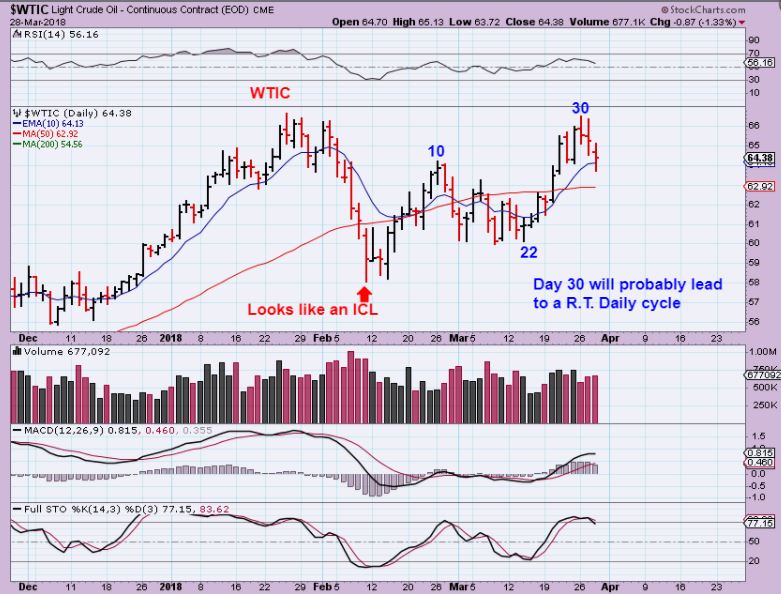
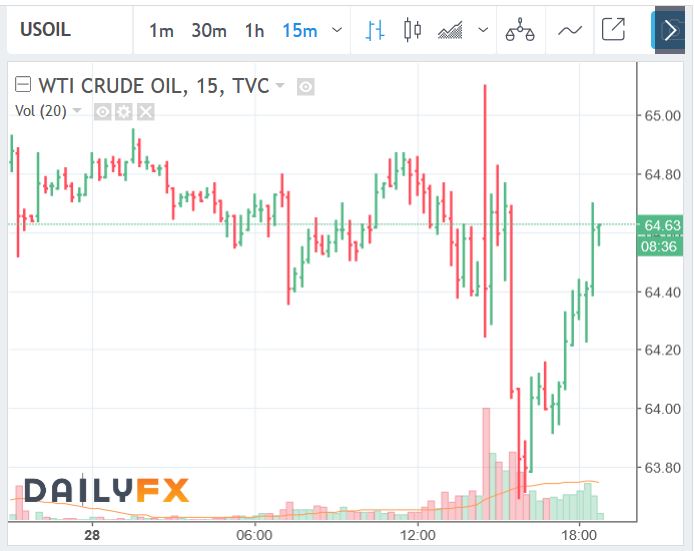
WTIC – The Oil inventory report was released and OIL put in a doji. Oil has formed a swing high on day 30, and daily cycles in Oil last 30- 50 days. This ‘Doji’ Wednesday was NOT as simple as this chart makes it look. Yesterday OIL was very choppy…
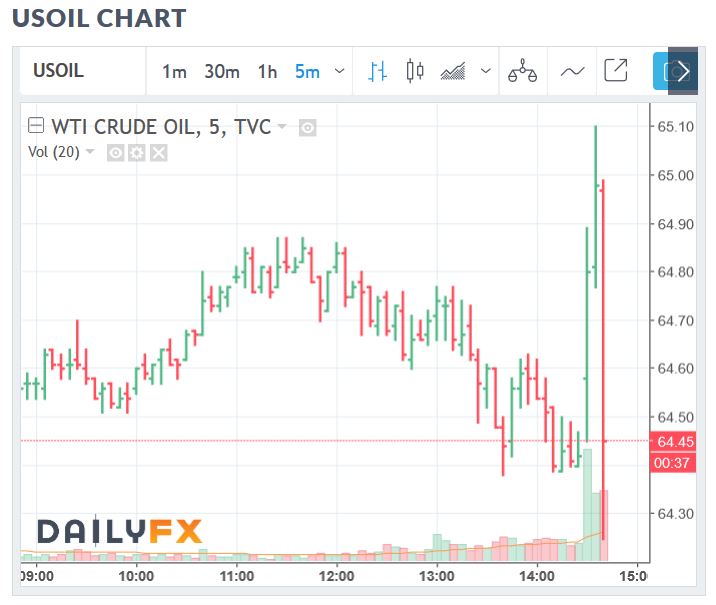
I was watching Oil real time, and after the release, Oil took off higher and looked Bullish. BUlls probably went long. Then it crashed as seen here on a 5 minute chart. That could have been a bull trap & a bear trap, and Bears may have jumped in short , but…
It wasn’t done. This is now a 30 minute chart and as the day went on, it rallied again and sold off again, even lower. Was Oil going to be Bullish or Bearish after that report? It was just going to be wild and choppy. And then after this crash …
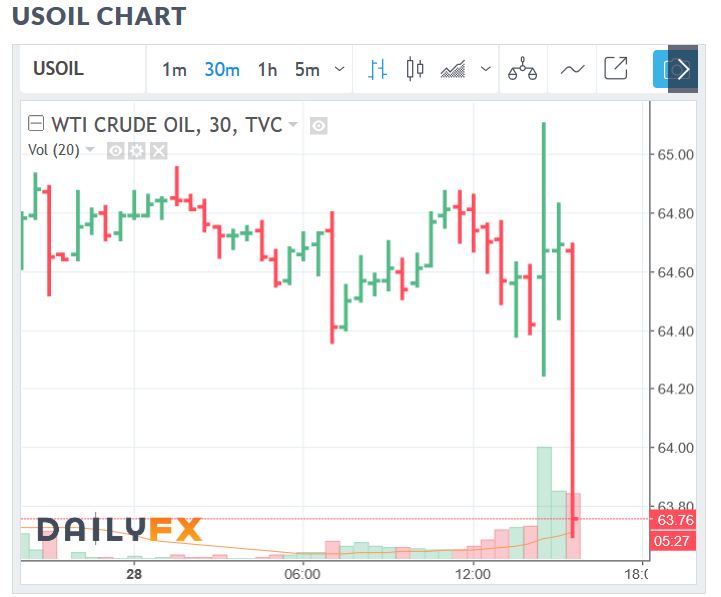
And that after this crash it rallied again? This would have been impossible and rather frustrating to trade, and this is how many market set ups are playing out intraday. They wont pick a direction, they are just choppy.
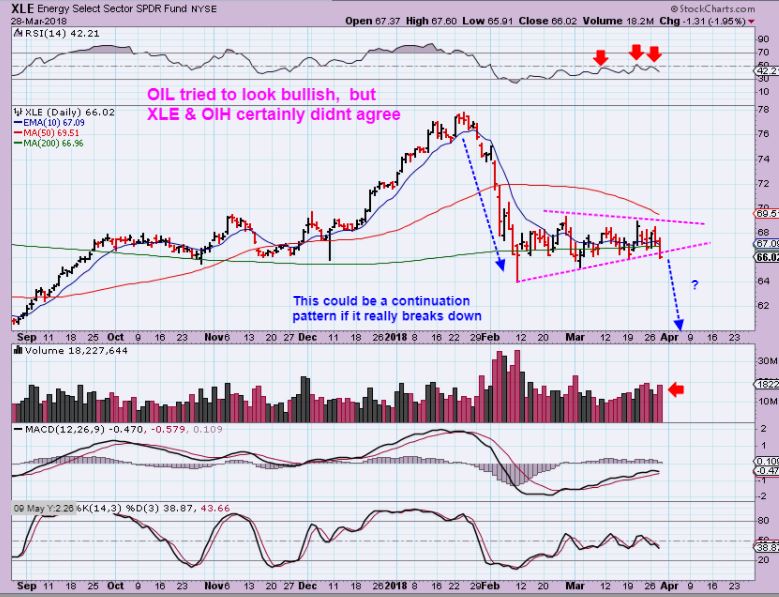
XLE – So Oil rallied & dropped and rallied, but the Energy Sector ETFs looked to want to break down. Maybe this is a clue to Oils real direction? MAYBE DRIP & ERY will be a good trade when Oil dips to a dcl. ( Short Energy).
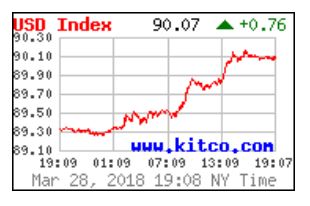
USD -The USD closed above 90, so I wanted to post this here, since STOCKCHARTS did not get it right.
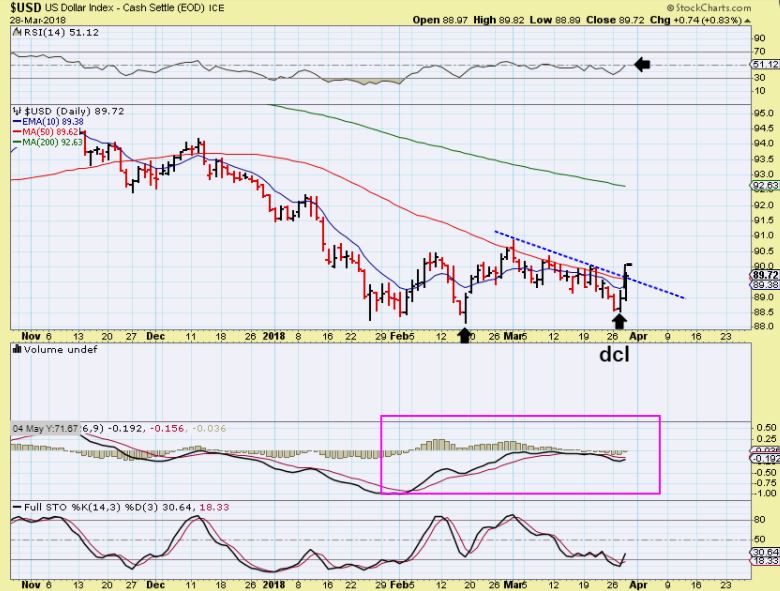
USD – I drew in the candle above 90 and we see a trend line break & a close over the 10sma. This is in the proper timing for a dcl. Notice that the last DCL or ICL did not rally much, but we’ll see how this one goes now that it got above the 50sma.
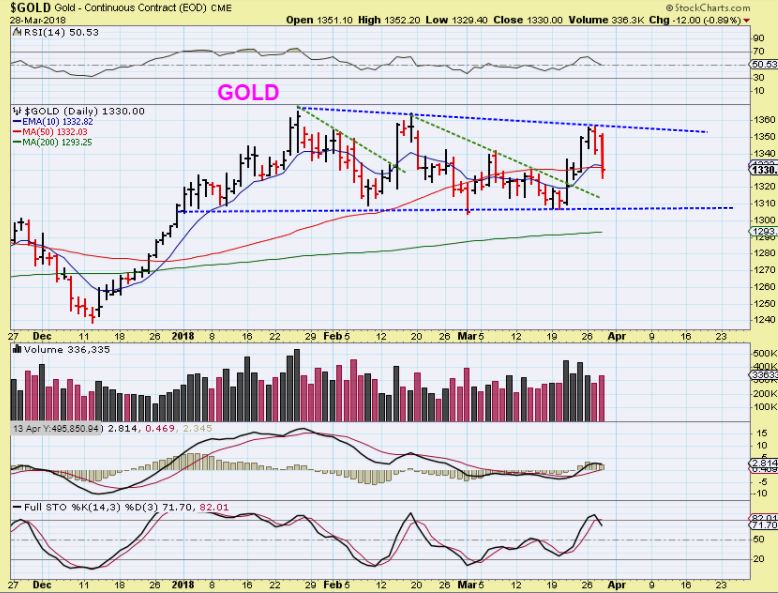
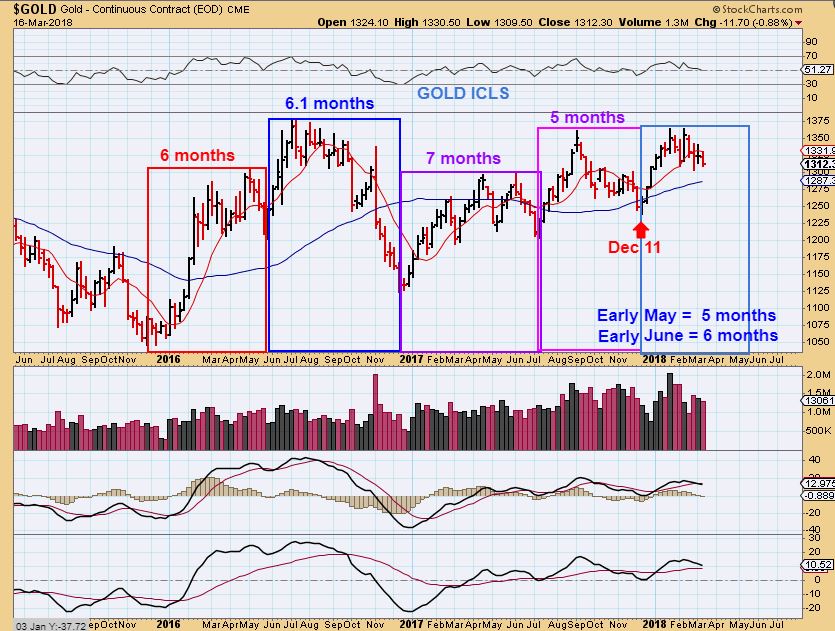
GOLD – Gold dropped to $1327
GOLD – So if you picture that here, Gold broke below the 50sma & closed there. So far, Gold has been sideways chop for Months. THe USD has been sideways and Gold has been sideways.
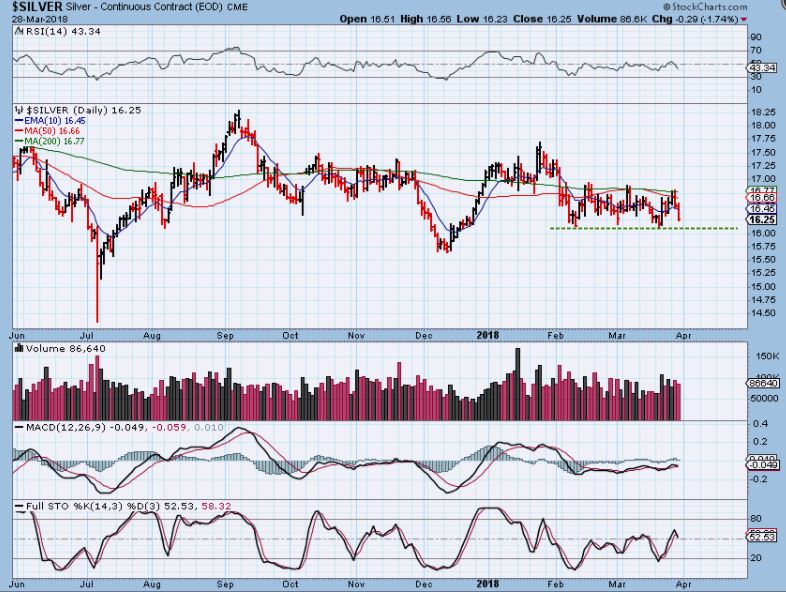
SILVER – Sideways chop here too.
GDX – Please read the chart, but they closed below the 10sma & Volume selling increased. THAT SAID…
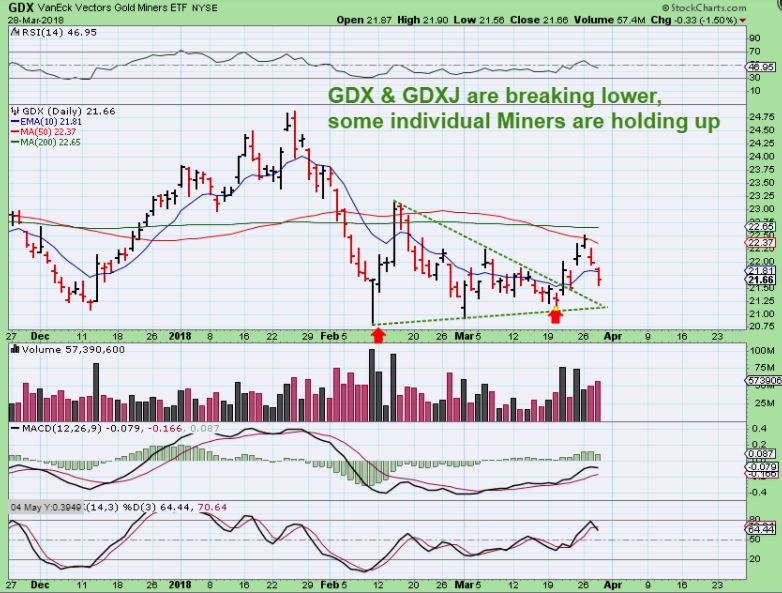
THAT SAID: Some Miners remain quite Bullish
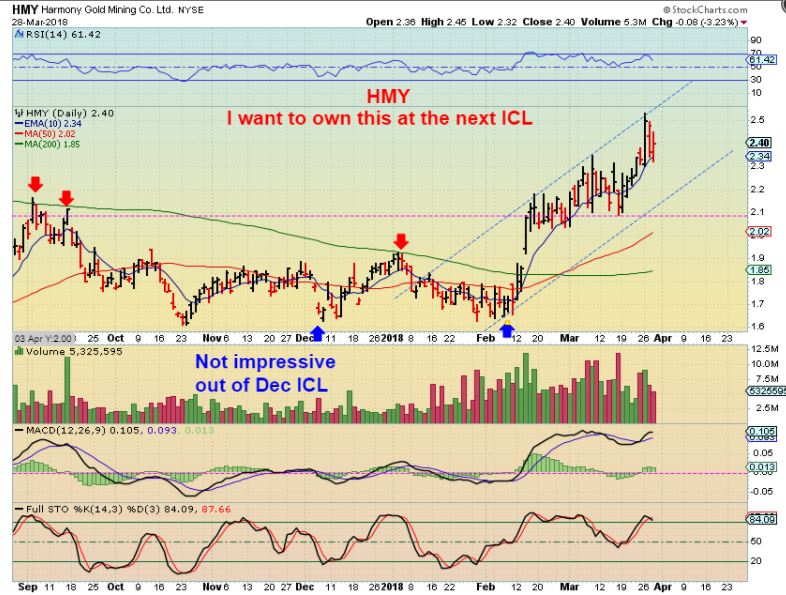
HMY – THIS Is not following GOLDS CYCLES. WHY Do I say that? See that the Dec ICL lows to Jan highs were tiny & Gold rallied fast. HMYs Feb lows to now were Big Gains. I dont know how this will hold up if Gold sells down into an ICL in April/ May, but I would think that owning this one after a pull back would be a good idea.
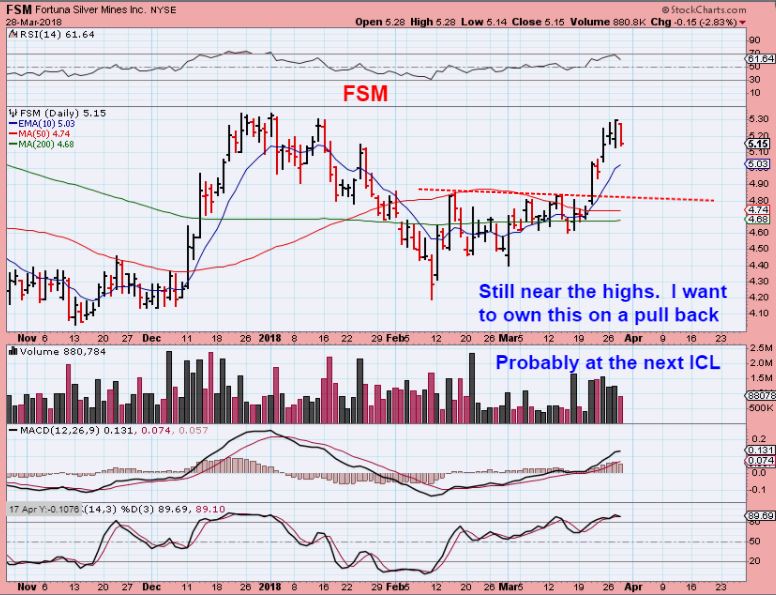
FSM – Also still near the highs after the last 2 days of the Metals selling off. FSM is not following SILVER.
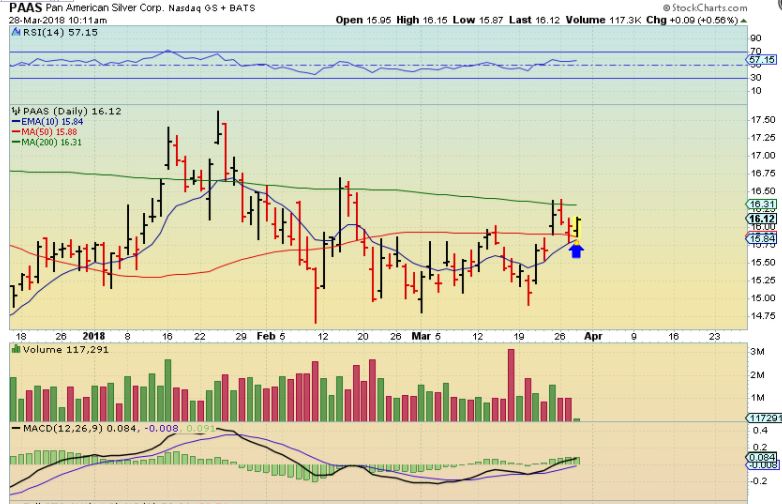
PAAS – PAAS was still holding above the 10 & 200sma today, despite the GOLD & SILVER Sell off the last 2 days. This was in the morning and it did close lower, but remains above the 10 & 200sma.
So you can see that some Miners are ignoring the Metals.
.
Conclusion: There is a time when ‘Good set ups’ and even ‘Average set ups’ play out very well, because the market direction is in their favor. In a Bull Run, many stocks just join in. There are also times like now when the most Bullish of set ups do not find follow through. When the Markets are Choppy, the set ups are less reliable, and the follow through can be put on hold. I am holding a few trades , but going forward I am not adding any new ones until this choppy directionless market gets some direction. The General Markets actually look as though they could drop even further. Yesterday I mentioned that even the big reliable Fang stocks were choppy and selling off and posted charts of GOOG, FB, NVDI, etc. It won’t hurt to wait for a buying opportunity that is safer or more reliable. I need to just go for a walk during the day, since I do this for a living and find a good set up difficult to pass by! 🙂 I still recommend waiting for a dcl. before adding anything more, and I will stop out of current trades if they go against me. WAITING IS BORING, BUT IT SAVES ONE FROM CHIPPING AWAY AT FUNDS. MOST TRADES ARE HAVING TROUBLE WITH FOLLOW THOUGH AT THIS TIME.
In FACT: This is how I ended yesterdays report. Click to enlarge if necessary.
Today I am going to try going for a walk a few times during the day 🙂
Also, like I pointed out, some Miners seem to be holding up well, others may not be. Yesterday I sold EXK, but I still own THM, TRX, AG and will hold them for now ( until they give me a reason to sell). The expectation is that if the USD put in a dcl, it should go higher and Gold should drop, but over the past several weeks, both went sideways & became choppy at the last dcl. If you hold any Miners, Stay alert and do not ride them down too far. Many are still at or around the 10sma, like the charts above of HMY, FSM, etc. That seems like a small miracle since GOLD dropped about $30 in the last 2 days, right?
** I keep referring to this chart. If we are going to get an ICL 5-6 months after the DEC ICL, it could be another higher low and may be near the FOMC MTG in early MAY? Since I drew this, GOLD went back to the highs at the end of March and is now selling down again. Having a lot of cash on hand at that time sounds like a great way to make solid gains in the future.
Enjoy your Thursday trading or afternoon walk or bike ride, whichever you prefer, until we get a good solid bottom to find some lower risk set ups. 🙂
~ALEX
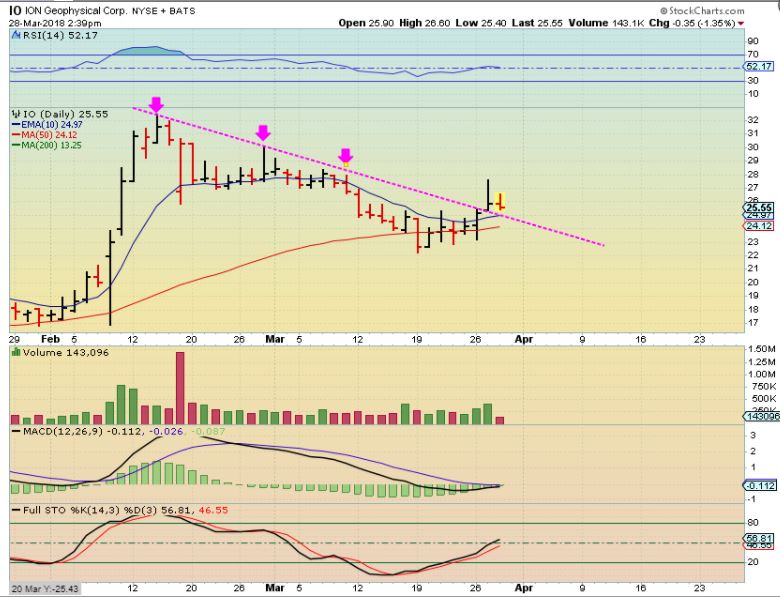
As an example: I bought IO a couple of days ago and I added too. This is like buying a 3x etf. Tuesday it rallied almost $4 above the 10sma! And then sold off into the close. Wednesday it rallied again about $1.50 and then sold off to down almost $1. It closed down 50 cents, but that isn’t as fun of a ride as it looks, I know, I own it 🙂 It still looks bullish, but I owned this semi- heavy and gaining $3 / share Tuesday and closing down $2 below that point the next day is just a choppy mess. I am still in this above the 50 & 10 sma, but it is going no where until the markets bottom.
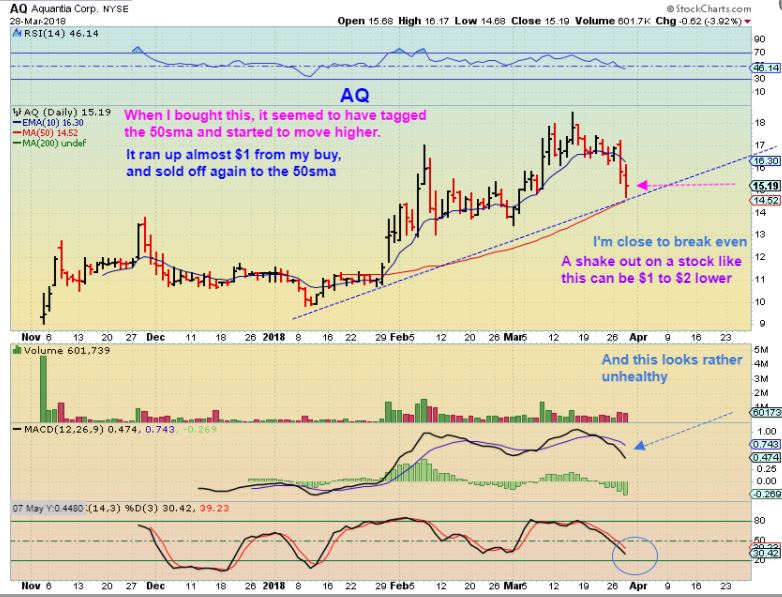
AG – This moves like the wind too! I made money on it in early March, but yesterday I bought AG on a reversal near the 50sma, just in case the markets are ready to bottom. I already rode it about $1 higher, and then it sold off again into the close. It closed down 62 cents. If the markets have not bottomed, this could do a $2 shake out. That isnt fun : ) I would have to stop out for a loss. The MACD is like a wide-mouth bass. That USUALLY indicates that more selling could be ahead too.


Oil 30 minute chart looks bearish, on this chart
https://uploads.disquscdn.com/images/e7da50358310275ba4419037f7cd5b6f11aae8933f29e7f0fa6b2fc1e75037f8.jpg
AT LEAST A RETEST OF YESTERDAYS SLAM DOWN LOWS
AAAAAAAAND…Oil just broke out higher. from that alleged bear flag…
I didn’t trade it, but I thought about DWT again.
I’m going for that walk now 🙂
I bet you don’t leave your iPhone at home lol. trouble is these important trend changes start out subtly.
I cannot take that bet 🙂
ZSAN – WOW, what a crazy 2 month chart after todays open
Most of you may remember the Chef of the Swedish Meatball that occasionally comments here – “BORT”.
He emailed me asking about TANH.
Gotta admit, bullish volume and a long base. It does look like it wants to move higher.on a 1 yr chart ( 200sma overhead).
BORT! Chef, where are you?
FWIW … of the three major stock indices the DOW looks best on my charts. I’m keeping a sharp eye on UDOW. I’m leery of my old buddy TQQQ because of increased pressure on social media companies.
AKG – wtf
I saw that in pre-market
Asanko news:
Asanko Gold to Receive US$185 Million From Gold Fields for 50% Joint Venture
Interest and US$17.6 Million for 9.9% Private Placement in Asanko Gold
big overspike.. will it stick?
I think it already ran up and broke the 50sma, and then also hit the 200sma and pulled back.
Some of these Miners are starting to out perform the Metals, so it may settle down and continue to show some strength Huge volume in the first 15 minutes
We keep seeing these situations lately, I’m wondering when it will finally spill over into the group, and we see the juniors start a sudtainable trend higher? I tell you what, I will be pissed if one of my juniors sells out cheap, doen here in the depths!
I also will stay away from majors, even eith the big indiders buys at ABX, as these will have to buy the juniors for s long time to come, and I would hope at gradually riding prices over the next few years
IO read your morning report. I got it too.
Yeah, but so far it has been up at least $1 each morning that I own it, but still manages to close down 50 cents 🙂
volume is actually better than it had been the last 2 days at this time ( So there is hope of follow through) 🙂
Alex, what do you think of CVSI chart? Earnings come out after close today…
The chart looks good , but ‘earnings’ is the bigger deal in these.
Its usually a gap up or a gap down after release
hmm natty…
TRX & THM ooking good ( On absolutely no volume unfortunately).
TRX on the 200sma
yah….
mannn i NEED an impulse wave…. these days R VERY trying….
shoulda takin a hint from discus when it would not allow me to change my name back ……. LOL
hey M.. how come ya couldnt change back?..
i might be stuck as a Russian bot forever
ENPH lifting up.
I see gold down, but I see quite a few MINERS up 2 or 3 %.
Steel and copper are waking up.
yes, I was a little worried about them. I’d like to see stocks like HBM & FCX get back up over the 10sma & especially the 50sma.
Inverse head and shoulder on 5 min. chart for HBM.
Added SQ, NTNX, MU, BZUN, got filled only 100 CASA at 27 gap fill lol!
VERY nice, KC. I added MU and CY back. Im diggin TNA here as well. Nice charts on BZUN anf NTNX – check out EC….
I may be a glutton for punishment, but I’m back in UDOW and TQQQ (it’s rallying hard so far). Will have a tight leash on the positions as Alex recommends. UDOW is already above its 5 day EMA and it is angled up, that’s a very early “buy” signal to me. TQQQ is way below it’s MA’s but it is so beat down I’m taking a shot it will follow the rest of the market back up. Don’t follow me, just posting what I see.
Steve, still in a downtrend on any time frame over 2 hours?
Bill on my 4 hour and daily charts the MA’s indicate a down trend …. BUT signals such as TSI, RSI and MACD are turning positive and the action on my 15 min chart is very bullish so I’m diving in. This is much riskier than waiting for a close above the 10 day MA as Alex has recommended. Sometimes it works, like on Feb 9. Other times it does not, like when I bot on Monday and Tuesday and bailed out for a loss midday on Tuesday. I’m buying back TQQQ way below where I sold on Tuesday.
Agreed
Sometimes you got to just jump in that race and then put your stops just overhead that way you don’t lose. I did that with EEM this morning on 3 accts. I stopped out of 1 and made 5 bucks after paying schwab, but the other 2 are running.
Also SAIL (security play) avg 20.4
There’s a wedge there I think.
nice rally… long DBX BO… target 35/36 if goes .. stop under 33
long LABU stop under 79.. targets 81/82 but needs market continue rally ..
SQ watch thru 50
SPX looking good .. measured move off lows and 3 wave corrective if goes 2655/60
TWMJF surge
Thanks for sharing some of your ideas Ron
bitcoin stocks taken to woodshed..
LABU mini bull flag near session high ……potential tgts 83/84 if goes as indexes in bull wedges… raising stops
resistance strong up here indexes ..
Sold my MU for 62$ profit lol and locked in CY half of my position from 16.5 – 16.82… at least I have some gas money for the Jeep
long ROKU 31.06 day trade .. tight stop
NDX trying break thru 6560’s.. could rip thru 6600..
NVDA AMZN nice
1. IF AMZN can get back above the 50sma, it will look to be a 2 day ‘shake out’.
2. If it tags it and drops, that will just be a back test
3. A Gap open over the 200sma is very bullish if the gap doesnt close
4. Close a bit higher, bullish engulfing
refresh
https://uploads.disquscdn.com/images/3aab96f728a340ac7027e0f7e91a557bfcc1f8028b3ef895f87507f45797190d.jpg
I guess a “Gap Open Tomorrow” would be amazing, since the markets are closed.
How about Monday
giggle
add to DBX trade.. target retest high
sold 1/2 LABU .. stop rest under 79
AMD looks ugly – like it wants to follow TSLA. Not in it, just observing
cashing in here all day trades and calling it a day as hitting resist levels indexes even though could go higher…. have great long holiday weekend!
Nice Ron!! Way to kill it today
I sold GALT a while back because it was starting to break below support.
It dropped a bit more & earnings & Trial results came out today
It POPS 22% – but that simply puts it right back to the area where I Sold it.
It remains oversold, so it could gain more upside momentum
refersh
https://uploads.disquscdn.com/images/32a90369e8460b033c0e5da6e1b344eab1d08ff45a05c0c2ebd987b14312b39a.jpg
wow… that looks like it would be a great grab on the backtest/”2″ … c’mon down now sonnnn ….
*I just felt like FogHornLegHorn .. lol
I Say, I say, not on your pointed head, there son!
Hey Bill, Was just thinking of you & a few others that may still own this ( I do long term)
EDXC needed to get back over that 200sma in my opinion. This ( refresh) is why it was important to me
https://uploads.disquscdn.com/images/1e0daa8b74443e40fabab2331d785d23abdc1c159cd43b53e275c882cd49efd7.jpg
at 200 day is a mighty bully overhead…. i mean i think of AUMN….
AUMN dead to me! #HB
Yes, Alex Im still holding from 0.07. Looks promising. Any idea why the big day?
I don’t see news, I hope that it is insiders that know something. They have been making new deals and growing in their Phyto-Bites sales. I own a ton of this one and would love to see it run again.
The last time above the 200sma on this chart (JAN) was great
Not great volume today – need some follow through buying.
I believe that SOG can relate to that with his new avatar
I re-entered it ( AFTER TAKING MY WALK—I GUESS THAT DOESN’T REALLY HELP)
= )
nice……….
My biggest holding at this point is IO.
So far it has been a bumpy ride, but this one hasnt violated the 10sma, so it seems to be a better hold after the recent consolidation / pull back.
That last run was roughly $17 to $32 in 2 weeks – almost 100%.
This one moves fast in both directions
refresh
https://uploads.disquscdn.com/images/d8b243ebe9746f88f0fb8bc005662b359b30af2fe3ced83da0c98346beb823ae.jpg
OIL Services company?
So far, it’s looking like the “bottom” may be in for the general markets … but as Alex has pointed out repeatedly, we need a close above the 10 day MA’s to have confidence that this bounce is real. This action is very similar to Feb 2-9 where there was a big one day slam down, followed by a rally that suckered the bulls back in, followed by two more down days, then another reversal that finally held and got stocks going back up. I HOPE that’s what happens this time, but we have the markets closed tomorrow for a 3-day weekend and that can be nerve-wracking holding over a long weekend. I’ll admit that I am basically “all in” on TQQQ and UDOW (60/35 split) so this will be me this weekend:
https://uploads.disquscdn.com/images/1b96c9213549528cfbfd30332ca1756952397d415b5710b5697ffb8022f26532.gif
Looks like March 26 all over again.
Or Feb 9 all over again. We won’t know which way it goes until next week. That’s why it’s safer to wait for a close above the 10 day MA, but you miss a chance to buy closer to the bottom. “Picking your bottom” is always risky! 🙂
You got that right!
SO FAR … my “sell low buy back lower” strategy is working in TQQQ, but it could slam down again next week. I’m sharing my thoughts to give others something to think about as you check your own charts and make your own trades. Alex has done an EXCELLENT job of spelling out the possible scenarios for stocks, buying today is very risky, but IMO it’s worth the risk. DO NOT follow me unless your are a very experienced trader and your charts validate what I am seeing. Good trading to all!
Alex’s has been calling for a possible double bottom, we aren’t quite there yet. I did buy some Today, but I’ll wait to invest further. Still showing a downtrend on the 4hr chart. I know that’s not an early indicator, but its not there yet. Looks like its trying to get there. If we have another up day on Monday, that would be very positive.
I agree with you Bill, caution is definitely warranted. My 4 hour chart for UDOW is now looking bullish with the 9 EMA and 10MA both angled up and the 9 EMA about to cross over. TQQQ is getting there, the 9 EMA is angled up but it has a way to go to get a bullish cross-over. This is more of a “feel” trade for me, I know I’m front-running my signals a bit but I’m giving it a shot. Waiting until next Monday or Tuesday we be a lot safer, but like Tina Turner, “I never, ever do anything easy!” LOL
LOL, Tina Turner………..Wow, blast from the past. Good luck
EOD sell off is putting a harsh on my mellow. Let’s see how it closes.
Just to be honest, I ended up selling some of my TQQQ at EOD to lighten up in case there is a pullback next Monday. I didn’t like the selling into the close. Have a good weekend everyone.
And again,,,,, Impeccable timing,
miller, you often post that. Are you being sarcastic? Just curious.
Lol
Yeah, I’m still in TQQQ thinking that we are bottoming and there isn’t too much more room below. I added back well below where I stopped out last time and was able to add at the lows some this week so feel good unless we really start to wipeout completely next week!
NASDAQ, DJIA, AND SPX do have the ‘unconfirmed swing low’ in place.
DJIA is ALMOST above the 10sma ( I usually use the SPX or NYA)
It is tricky this time because the various sectors all acted differently.
NYA could NOT regain the 50sma in Feb or March,
NASDAQ made it to completely new highs,
The SPX bounced around above the 50sma twice
DJIA broke above the 50sma once, then a lower high…. so they are all acting independently strength wise.
But we are very close & various indicators that I use have been pointing to that too
EDXC above the 200 day.
Chart below 🙂
Below where? The rock?
Found it
https://uploads.disquscdn.com/images/729c5e282e4450dbc21be0af27a872d2854bc309cc1d473800f01a195c8546fc.jpg
You’re always so kind and helpful to Bill
#UnderAppreciated lol
What? #notTHEsameMariaIC
well ….
*nevermind…..
ha ha h
ha
ha
#HB
LOL !
Lol.
hey Steve Tyler… you still all in? we’re really selling down with volume now, you still plan to be all in? qqq is below your 5EMA…
I went half in both TNA and TQQQ… TNA 67 and TQQQ 142… went outside and grabbed some lunch… was up 2pts TNA and 5 pts tqqq…. now Damn near break even… those sneaky WS f*ers
He said below that he had a tight leash & Bought it only because the 5 ema crossed up on a 15 minute chart and turned the 5ema up.
It did turn down and curl the 5 ema down on a 15 minute chart into the close.
One time he said he wasnt selling and wiggles or drops until May, and then sold on a similar wiggle as todays close, so I’d say if he said he had a tight leash before a 3 day weekend? Prob out.
I’m only answering in case you are trying to ‘ follow his ideas ‘ and you did ask during market hrs, but it is closed now — at least this gives you something to think about after hrs.
Alex, my leash is a little longer since I bought earlier in the day. I sold some of my TQQQ to lighten up, but still heavy. That may be a bad move since there is a bear case to be made by UDOW being rejected at its 10 day MA and both UDOW and TQQQ sold off into the close. I’m going to assume that was EOD profit taking and end of quarter portfolio cleaning by fund managers, but it could be a signal that stocks are headed down again next week. We’ll find out on Monday and Tuesday. I’m taking a chance staying invested, hope I don’t regret it. Smarter traders like Bill are waiting until next week to load up. So I recommend most people DO NOT follow me!!
CVSI really good report, moving up
Thanks, Tammie. looks very interesting.
hava great weekend all …
Happy Easter/Passover to those who celebrate … 😉
https://uploads.disquscdn.com/images/4834044d7599c396eab6a831ac80971654917d2d405cb13bc9c9415184dadc82.gif
Is there a way to block animation?
would u rather a story?
Ok……
….. once upon a time there was a beautiful, intelligent, charismatic, princess named Maria….
One day Maria met a little boy named Billy….
#HB
Crickets?
Markets are closed Bill
Dollar is still trading……….
LOL
Ok, we have something to purchase with and nothing to buy 🙂
Im trying to use an EMA cross of the SMA along with MACD for a BUY SELL system. What do you think?
Depending on your time frame, that can cause whip saw,
but try it and see if you can make adjustments and use it for your trading needs.
Bitcoin, other currencies.
Ck under the rock….
THAT was perfect 😉
hahaba
Really? At my expense? Don’t side with her……….#impairedjudgement
LOL…. hahaha
Ohhhh pecos..
Interesting article implying WTI Crude oil supply will decrease in the Permian Basin due to increase supply of natural gas production (unwanted byproduct of drilling) being unable to ciphon off (inadequate pipeline distribution) or flare. The other implication is a fall in natural gas prices due to the fact they may have to give it away to get to the oil.
https://www.bloomberg.com/news/articles/2018-03-28/texas-sized-gas-conundrum-emerges-in-america-s-busiest-oil-field
US Dollar headed to $91. AB=CD, chart below
https://www.tradingview.com/x/mgzULO5S/
A very big weekend report has been released 🙂