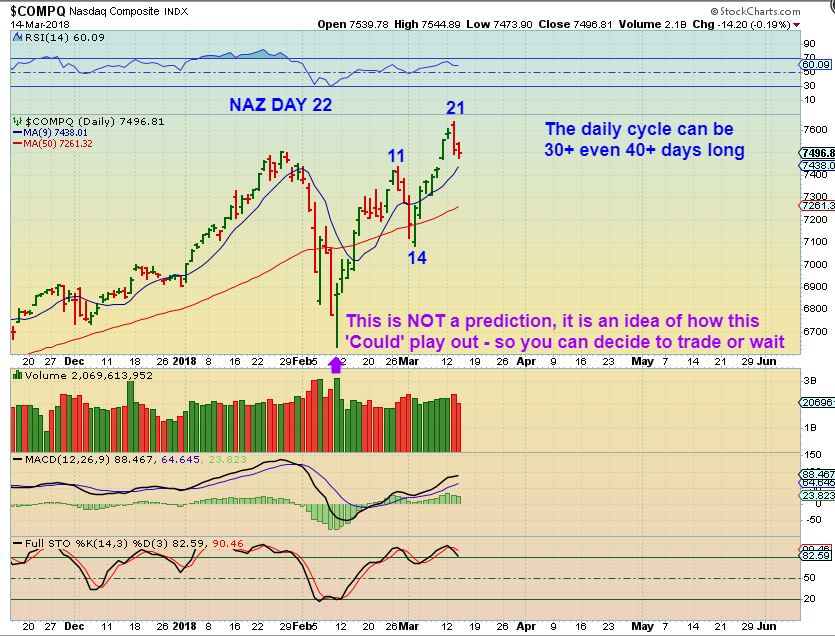
After the recent selling or pause ( 3 days in the SPX & DJIA, 2 days in the NASDAQ or SOX), it would seem unlikely that anyone has been stopped out. I want to take a look at where we are cycle wise and discuss possibilities going forward, based on a comment that I made in the report yesterday.
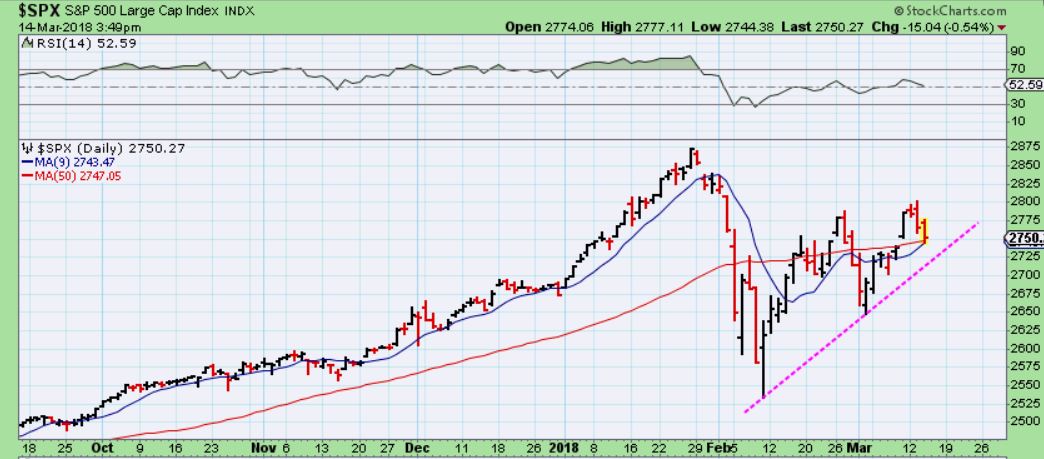
SPX – Here we see the S&P where selling has landed it back on the 50sma. This chart is basically neutral to bullish. It is a day 22 peak so far, I would still like to see a higher high again though, to really ensure that this becomes a right translated daily cycle.
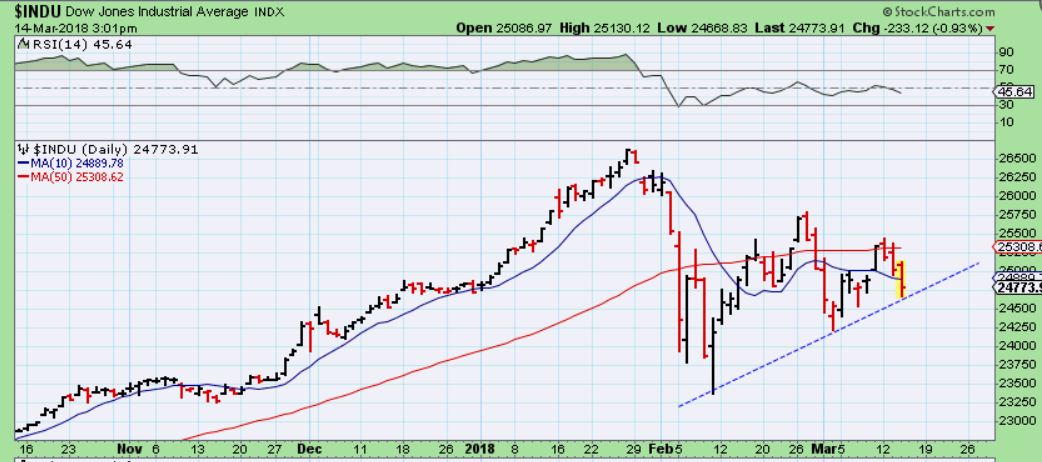
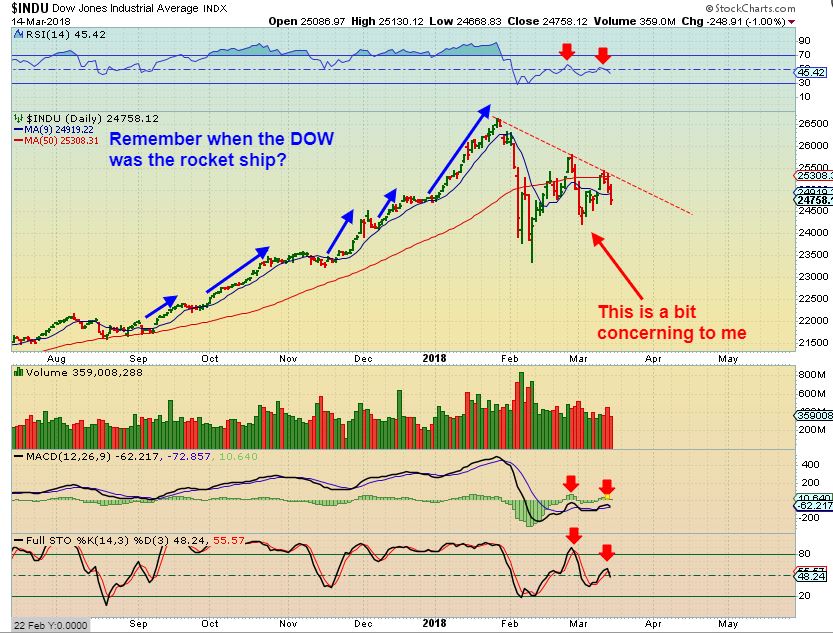
DJIA – The Dow is actually stuggling at the 50sma ( please don’t write and blame this entirely on G.E. 🙂 ), and it is a bit bearish at this point. The DOW was the rocketship of November through January, and then Crashed hard. This now only has a day 11 peak, that needs to change. This could be support however, with a push higher to follow.
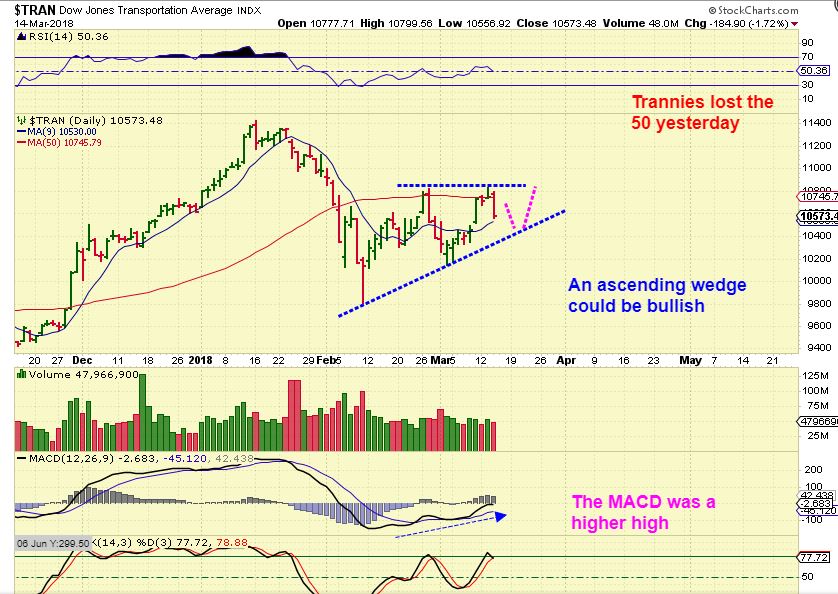
TRANNIES – We have an FOMC MTG next Wednesday and the Trannies looked a bit weak at the 50sma too, but if this becomes an ascending wedge & breaks higher, it is bullish.
THIS NEEDS TO BE MENTIONED :
DJIA – I am going to be pointing out the bullish Tech Sector/ SOX next, but just because the NASDAQ & SOX are breaking to new highs, this is not an overall healthy looking market. THIS NEEDS TO CHANGE in my humble opinion. The DOW shows weakness. Can the DOW fall apart while the NASDAQ flies higher? Or would this drag on the rest? Reminder: We have an FOMC meeting next week.
SO WE HAVE SOME MIXED SIGNALS
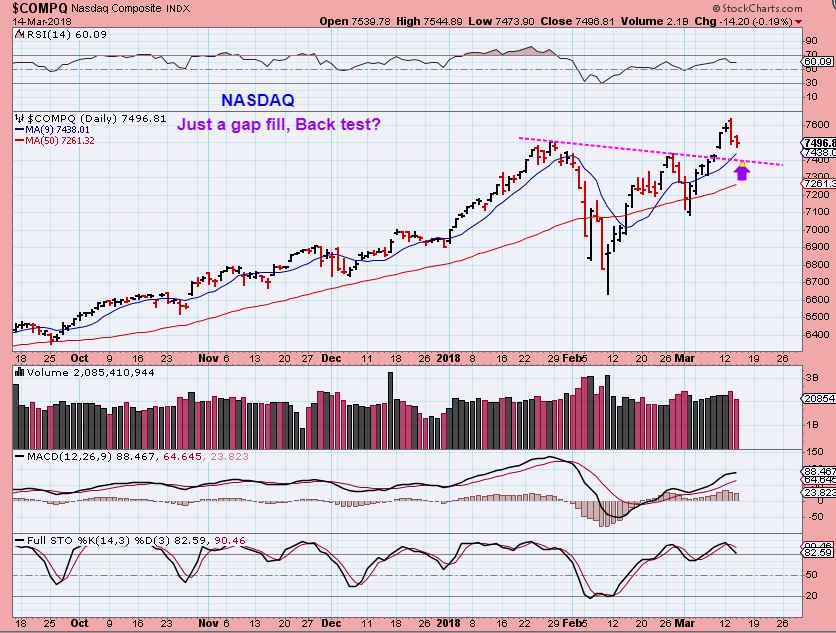
NASDAQ – Obviously the Tech sector has been more bullish. It broke to new highs and peaked on day 21 (So far). If it drops today it may just fill a gap and hit the 10sma.
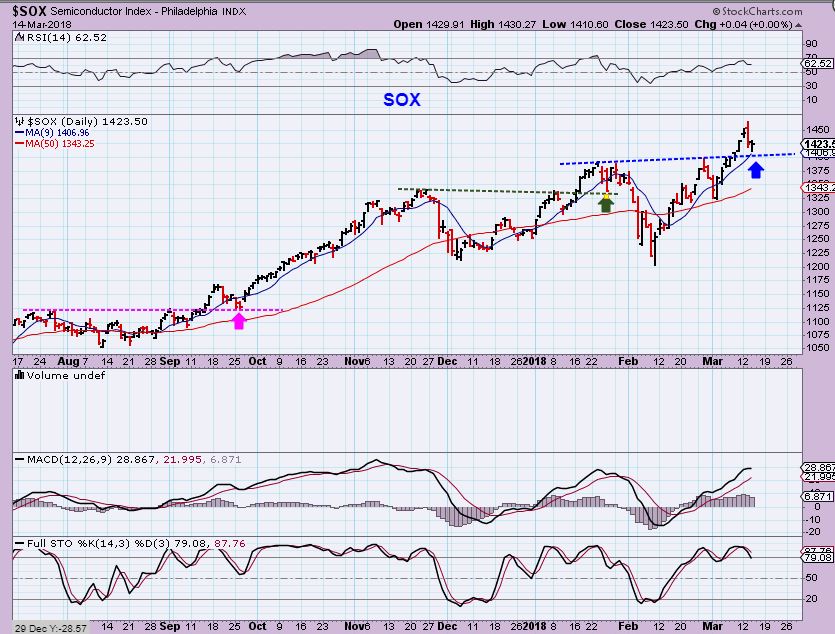
SOX – The semiconductors have been doing very well. Maybe you have traded CY, CREE, MU, etc as they break to new highs. I pointed out that the SOX already did a double bottom low (Shake out) and then ran to new highs. It could have lead the way down & is now leading the way higher, but in the back of my mind I still need to keep an eye on the weaker DJIA, NYA, TRAN, RUT, etc.
This is a comment that I made in the report yesterday, please re-read the blue words. I cut & Pasted it here, so if it seems small, you can click on it.
Those individual stocks are holding up, they are not running stops, and some even continued a bit higher. This is encouraging as Markets pull back. Let’s take a quick look…
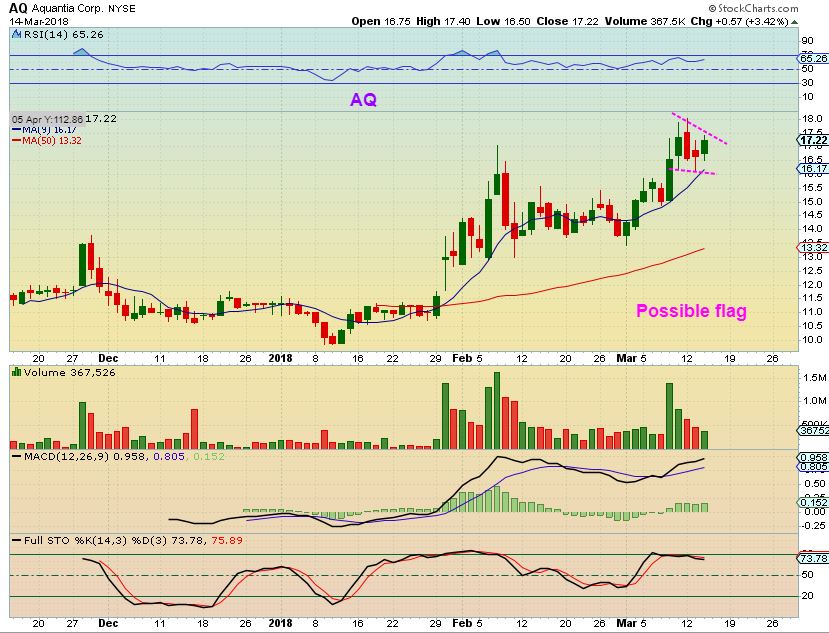
AQ – This is one that I still own from early March and it may be a bull flag
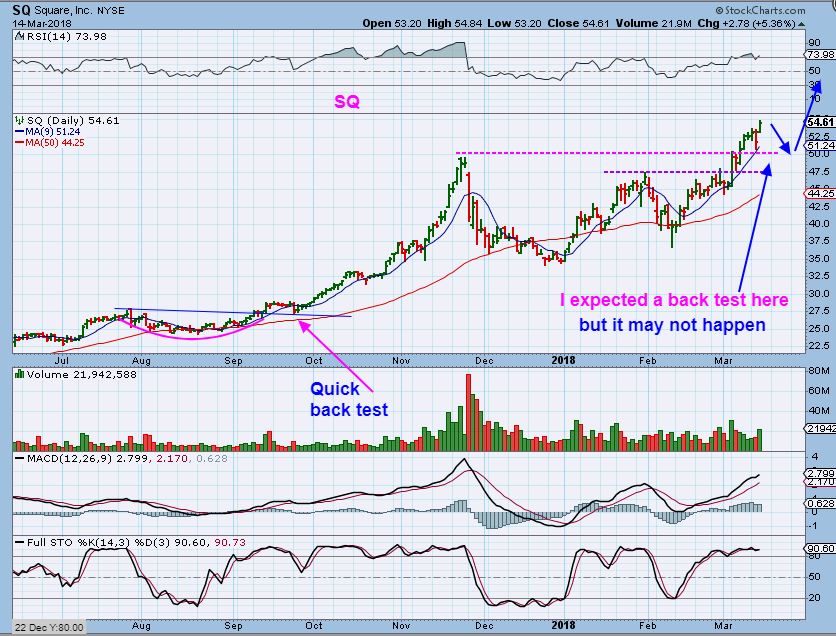
SQ – I was expecting a back test with this weeks selling, but it moved higher. This could still back test later when we get a sector DCL, but that would be a ‘buy’.
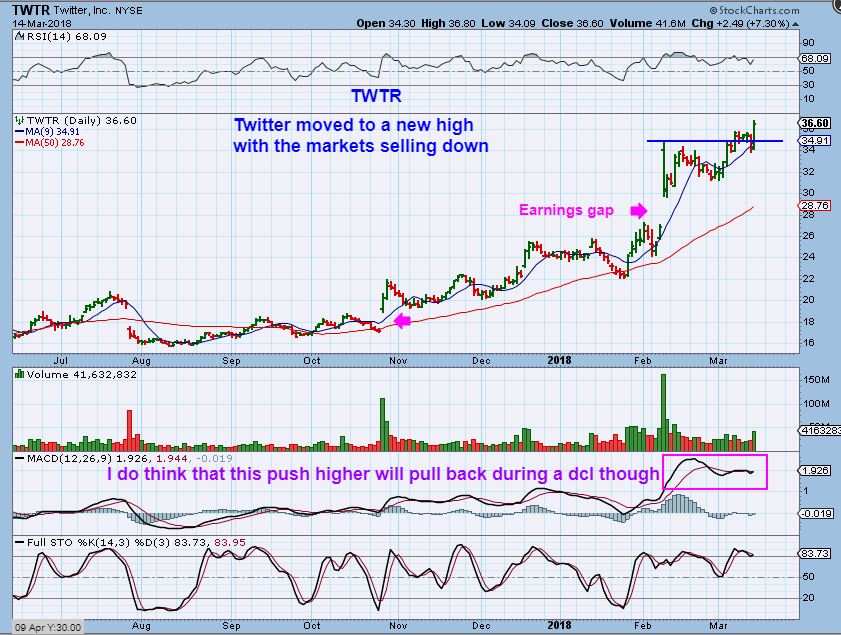
TWTR – Another stock breaking out with the General Markets selling down. The MACD is not confirming this high, so it may pull back later when the markets drop into their dcl. The 50sma is climbing, and this can run & pull back to the 50sma later like it did in January. As mentioned in a prior report, the earnings Gaps may never fill.
I CANNOT EMPHASIZE THIS ENOUGH: THE FOLLOWING CHARTS ARE NOT A PREDICTION, THIS JUST GIVES US AN IDEA OF WHAT MAY HAPPEN :
I was asked if this dip should be bought by those that didn’t buy & hold yet. The following 3 NAZDAQ charts are simply to help you to see how this could unfold, and then you can decide if you want to wait for a dcl, or take a trade and see if you get more upside. I will show you a bullish version, and I will show you a less bullish idea.
NASDAQ CHART #1 – SO we have the NASDAQ on day 22 and it can go 30 days, 35 days, 40 days, so we may have more upside potential in this sector.
NASDAQ CHART #2 – It is possible that another leg higher unfolds ( Guessing near day 30ish) and then a drop into a dcl. The DCL could back test this break out or the 50sma in April. Buying here may give you a run higher & then a drop right back down to this area for a dcl. This would give us more upside & MAYBE the SPX could even break to new highs by then.

NASDAQ #3 – This just shows that with DJIA weakness, the NASDAQ could also go sideways and keep popping and dropping. Markets can get choppy, so if you buy here, just expect a possible run higher or some sideways chop into FOMC, I cannot predict which one will happen.
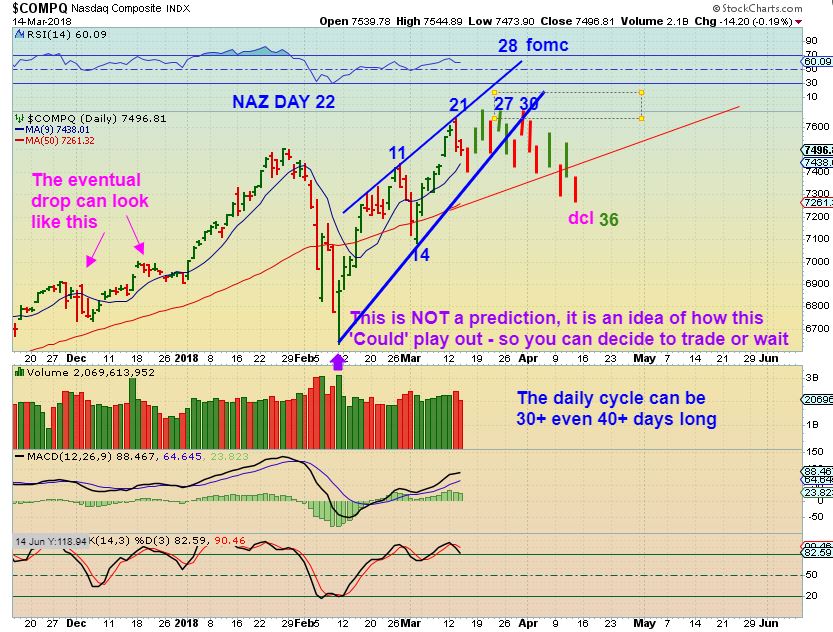
THE FOMC MEETING NEXT WEEK WILL BE DAY 27 for the general markets, so …
REMINDER : Do you see how fast a raging bull can go south? Everybody was buying in January, right? And then the Peak of January to the Low of FEB took 8 days. Use trailing stops if you buy now going into the FOMC.
Finally –
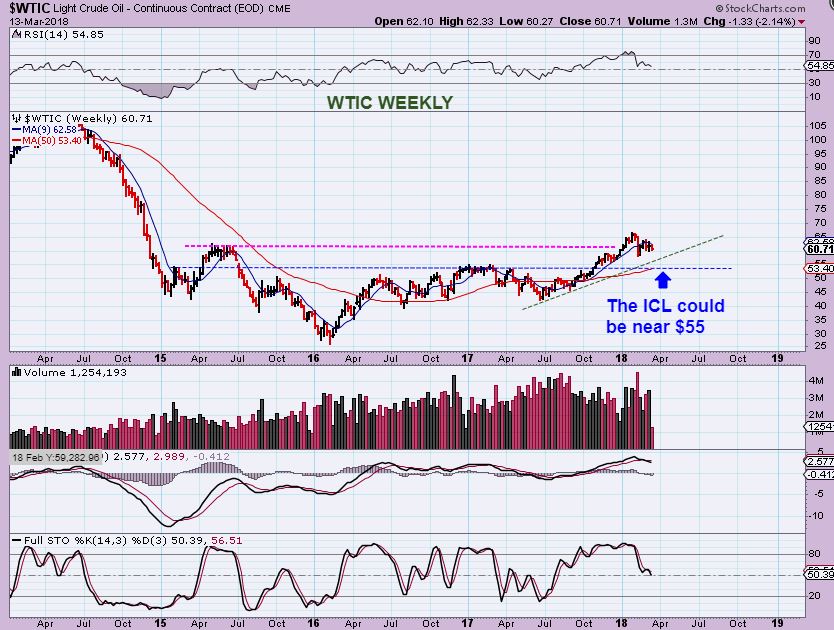
WTIC – So I am back in my short oil trade, but it is basically neutral looking at this point. It is the high Smart Money Short position in the COT that keeps me in this trade, thinking that we did not see an ICL yet. I am viewing that this should be an a-b-c down. A break higher will have me out of this trade.
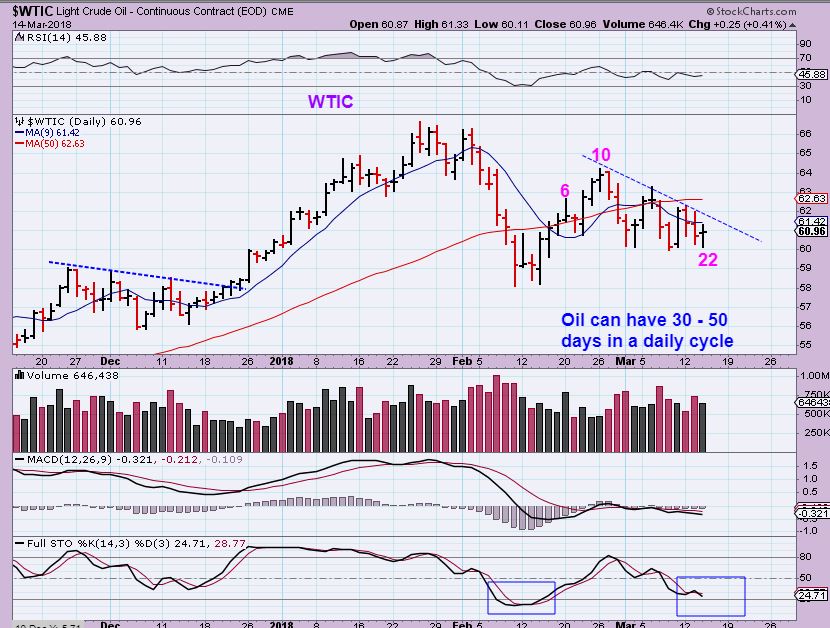
Weekly from yesterday – Time will tell
Nothing has changed in Precious metals. Enjoy your Thursday trading!
~ALEX
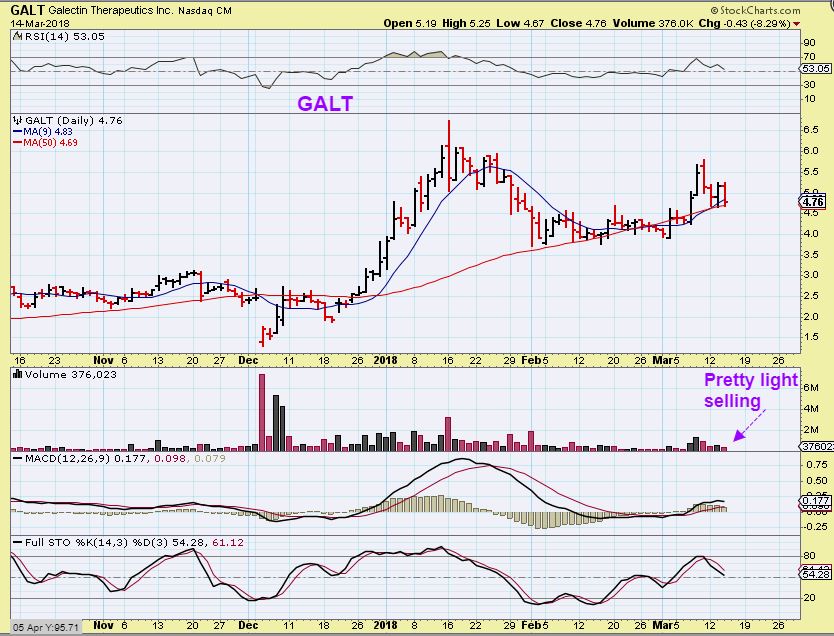
I posted GALT & CVRS. I chose to buy GALT personally, but so far CVRS looks better trade, 🙂 Oh well, so far it looks that way.
On March 12- This looked like a good area to buy- a drop back to the 50sma on March 12 near $4.60.
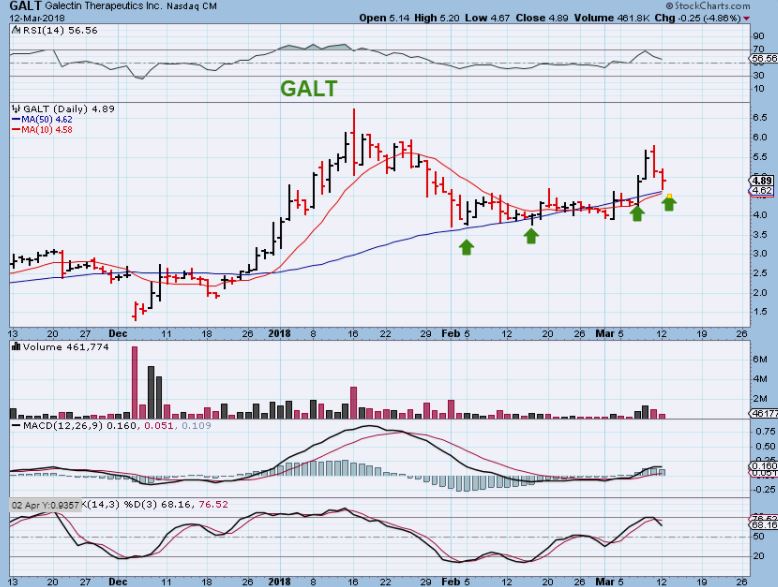
GALT – 2 days later it bounced higher & then it dropped back to the 50sma yesterday. I was asked if I am stopped out. Not yet and since it broke the 50sma in early March, I may allow it to do that again. Unfortunately this moves quite a bit daily, so my stop may have to be $4 based on this chart. That is a bit more of a loss than I want to take, but this went from $4.25 to $5.82 in 2 days last week, so I cant use a tight stop ( Unless I dont mind getting stopped out at the 50sma & buying into a reversal if that happens).
The better of the 2 trades so far…
CVRS from March 13 – a buy with the good volume pops. A couple of people wrote to me that they took this, and where would I sell?
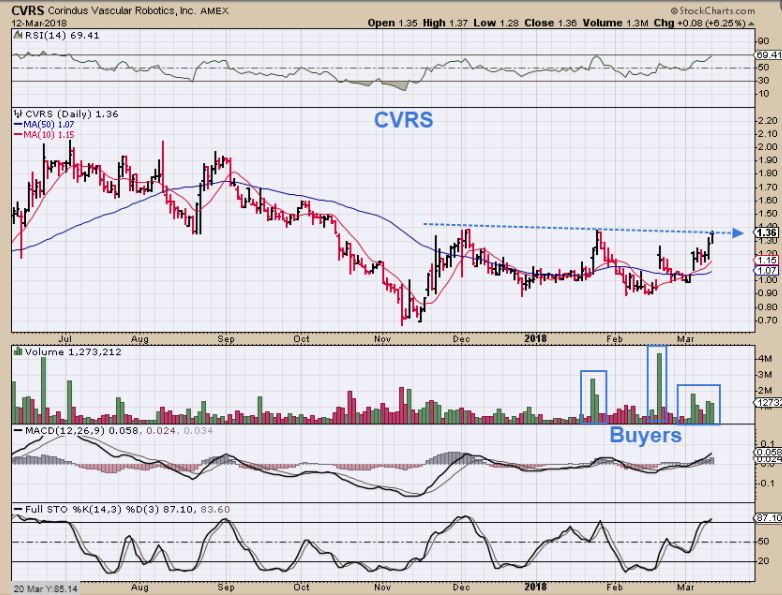
CVRS- This could become a giraffe neck, since it closed near highs, not many sellers yet. I think that this could run back to the $2 area, based on the above chart.
Sharp Reversals 
 Stuck In The Middle
Scroll to top

SBLK what do you think Alex, long term weekly chart.
https://www.tradingview.com/x/rbR2Y6yI/
Well, I mentioned SBLK and several other shippers in the comments yesterday as trending higher and looking good overall including long term weekly charts, but some of these are not at a low risk entry short term, others are.
You’re question, “SBLK what do you think Alex, long term weekly chart.”
Yes, long term weekly chart is quite bullish ( it did have a reverse split a while back). Short term daily is somewhat neutral. It is on the 10sma, could be bought for that reason, but it has been going sideways for a bit & might drop to the 50sma since it is overbought on the stochastics.
Look at the 5 year weekly chart of GNK.- looks great, but that was also the result of a reverse split.
Still looks bullish though
I usually don’t look at shippers, so I probably didn’t pay attention when you wrote about SBLK. I just saw the chart this morning and thought, that looks like a pattern that CF would say was promising.
Yes, it is a long base and a few are ( GNK too).
Hello Alex,
is that head and shoulder with NUE still in play or is there any damage? I might be asking a lot but a price and or time target would be highly appreciated.
thank you
Noiser
Hello Noiser, That isnt asking too much at all.
I really like NUE & STLD charts, but as time goes on, withouut the break out or follow through higher, it is becoming a bit less bullish with the amount of choppiness and size of the chop.
Let me draw up a chart and post it here in a couple of minutes. It looks less bullish with the recent drop under the 50sma ( That would be my stop area), but it has broken the 50sma in the past & recovered.
I will get a chart.
Look at CLF and X – Those steel stocks are beginning to break down below the 50sma too, so the sector may be weakening with the Tariff talk and other factors.
So now we see NUE doing the same, and with that- this goes from an inverse H&S pattern trying to break higher at the red verticle line, to a weakening possible double top.
Where I drew the Red Line, Price Popped higher, the MACD & RSI were rising, and steel stocks looked pretty bullish. Over time, they are weakening, breaking their 50sma, and RSI is dropping down. I hate to say it, but this now resembles a double top. My stop would be around the 50sma, and even though it has broken below it in the past & recovered, I wouldnt rely on that.
https://uploads.disquscdn.com/images/6c7c5849c804b45a2c336dc47ffa541da32e8f8ef245613f3643880fba699201.jpg
that helps a lot
thanks again
Ur welcome
No giraffe neck on CVRS and pretty much a perfect take the money & run sell by Jeff yesterday
CF.. Im mostly cash now.. Sittin on my hands is so hard to do.. Give me the green light on some stuff LOL
I still own KEM, TNA, GNMK and PYPL.. But smaller sizes now after locking some in.
I know what you mean, I am basically 70% cash.
I took a few trades ( Some mentioned here, some not) .
2 that I did not mention here are currently red anyway HAHA- They were CAMT and OTIV
I took OTIV at the 10sma 2 days ago and it popped and then dropped – Im break even
CAMT I took at the 50sma & I’m slightly up, but they are pulling back today
And I own GALT, Some MJ staocks etc.
I’m looking for a pull back fat-pitch 🙂
But I have a chiropractor appt soon
Oh, and I’m in DWT
Whats up with CREE this morning – strong volume pop
Huge volume the 1st hour. Now coming back down. RDI Initiates coverage is all I see?
Yeah, I couldn’t find any news for that pop, and the volume was vry bihg.
probably some insider and the news will come out later
Ya, us pions are always last to know. VUZI earning must have been bad, its down today.
What a day for CREE? Wild
Nova Gold (NG) – almost looks like it wants to break out . HMY still holding up
DDD – Nice break out after earnings, see if XONE or VJET sympathize, but nothing big so far
US Dollar pushing higher. Looking at the hourly chart, trend line break and higher highs. Looks like the H&S pattern is failing, and a bull flag AB=CD pattern may emerge.
https://www.tradingview.com/x/lEfL1qgG/
is it possible that this was the $ H&S (looking at UUP), with target reached back in Jan?
https://uploads.disquscdn.com/images/899cba59f3631a13403cb7d70499deb2ea8582d697bf60d8b8df8ab81677d78e.jpg
I was looking for this on the hourly chart. Seems doubtful now
https://www.tradingview.com/x/DbZWzuTx/
ok, gotcha.. much smaller scale
Hi CF, are you at all concerned that the small caps are lagging quite a bit behind the general markets?
I’m not sure I understand the question.
I see Small Caps ( $RUT) is up near yrly highs VS DJIA & SPX , right?
Sorry I should have specified the time frame. Today I observed the behavior and was wondering if it’s a signal of further weakness in the coming days.
Oh today.
Today the RUT is pulling back to the 10sma, and it ran higher than DJIA & SPX to begin with, todays intraday move doesnt mean that much to me at this point.
DXR… wow, another ripper today again halted … 3 wave correct just over 9 and then runner..
Ron, I missed DXR but I went with RXII at 5.50 still holding half size, sold one half at 6.50.. missed the top at 6.76
RXII also strong.. nice pull back opp at just over 5 but stepped out and missed that…
giving shot here for possible wave 5.. 5.93.. stop just under 5.80 in case fails it will likely roll over
raise stop under 6.04 so free trade
Nice
Liking AVP daily again. Taking another starter
avon calling… funny my mom used to sell it when I was a kid.. like 50 yrs ago
ADAP another ripper today but after 5 waves up from 9’s to 13’s rolled over
AKCA also strong.. after 9 pt run up from 20 now 3 wave corrective back to lateral support just under 26 so might not be done.. some crazy stuff out there today
Hi Alex…..
May I ask you a question? Where or how can I see the support line from OIL regards the DWT ?? What’s your break to sell?
THANKS A LOT ALEX !!!
I am having a little trouble understanding this question…
” Where or how can I see the support line from OIL regards the DWT ?? ”
I dont know of a line of support that really affects DWT, but…
DWT I probably dont want to see it go very much below the 50sma, but the good thing is that each day that goes by Oil is later in its daily cycle count.
Oil is on day 23 with a day 10 peak, so if this starts selling down, it should have several days of selling.
This is a chart of USO ( for oil) , you could get rid of DWT if the overhead down trend line is broken, but mostly I think that Oil under the 50sma is good. A break above the 50sma may be bullish.
https://uploads.disquscdn.com/images/ead957d91d858c42771e7e485917ae207c5807d207bfc3cec1d77f30aaf0bce8.jpg
You got it ALEX…. many Thanks, brother.
Oil isnt selling off as quickly as I expected, and I wonder if it has to do with the fact that Oils daily cycle can be 40 + days long, and we are only 1/2 way there. I didnt really want to ride a choppy trade like this in a 3x etf, but I thought that the inventory report might send Oil down into a dcl- so far still choppy.
DXR there she blows .. my target was 22..but would be seller up here as crazy +170%
XBI with a nice backtest.
https://www.tradingview.com/x/UbVSCclB/
I almost bought both ZNGA and SIFY yesterday, but I wanted to see how the pull back plays out.
SIFY, ZNGA, JBL, AQ, CREE, TWTR, etc etc etc all handling the pull back very well
ENPH – I liked this one a lot, and sold it maybe 2 weeks ago?
So far it just tagged the 10sma and keeps running. 🙁 Very nice Cup & Handle break & run
INO came out with earnings last night.
Gapped Open higher, sold off closed the gap & then some, and recovered.
I kind of like that
thanks for slapping my hand about adding to my TNA.. I sold msot at 75.50 for a 3 pt gain.. Looking to add more if when it retests the 50sma area.
The Pull back looks rather orderly and nice, so it may be a buy this dip .
SPY, QQQ light volume today. Some of the leaders arent really pulling back very much
TWTR, Both AQ & REE so far ran up & gave it back) MU only down $1.30, SQ even,
And CY drifting to the 10sma.
Not bad at this point.
Im debating taking another add to TNA here… thoughts?
Breaking the 10sma, may reverse into the close & Hold, may drop to the 50sma
Ill sit back and wait.
KBSF ripping out of large wedge 9.17
I think I found a new friend here LOL.. seems like u like to day trade as much as I?
🙂
Who knew, casual mens fashion in China?
Federal Energy Regulatory Commission announces it will no longer allow MLPs to recover an income tax allowance in cost of service rates.
https://seekingalpha.com/news/3339594-mlps-suffer-sharp-losses-ferc-nixes-income-tax-allowance-cost-recovery?uprof=44&utoken=b087c788f07bded95a517ce1b425d427161628bd
Look at some of those charts
EEP, TCP, ETE and use volume.
Should make REITs and other “alternative investments” that generate income to be in higher demand.
Good. I could use a little help with GOV.
It looks like UUP might have put in its fourth higher low: Jan 25, Feb1, Feb 15 and Mar 13. So the USD is in a stealth move up?
I recommended JBL a while ago and it has been up just about every day since then.
It is still near recent highs, but has gone sideways on this pull back in the markets,
so I was just contemplating buying it since it only drifted sideways to the 10sma, no real pull back.
Then I started looking into a few things and saw that EARNINGS ARE OUT AFTER HRS TODAY.
IF ANYONE BOUGHT IT , THAT IS GOOD TO KEEP IN MIND.
Man that CASA
Ever since they released earnings, just keeps climbing
https://uploads.disquscdn.com/images/12029e4d69220a260aac34ca31d8c166d08aec243428fd5415a0c63c757988f2.png
Pretty sweet bounce of QQQ off the breakout and uptrend line…at the same time.
https://www.tradingview.com/x/rrym3u46/
And 10sma
Below 12 IPO’s charts ranked on RS by IBD…. CASA still going
So I know i said i wouldnt but I added LIGHT to TNA at the close. I also went short PLAY at 44.10
my stop is SUPER tight here, 44.30 and PT of 40.
JBL up after earnings
Jabil (JBL) reported Q2 core earnings of $0.66 per share, better than the analyst consensus of $0.62 per share on Capital IQ, and up from $0.48 per share last year. Revenue was $5.3 billion, ahead of the Street view of $4.91 billion and an increase over the $4.44 billion posted in the year ago quarter.
OSTK nice plunge AH… target was 42’s …
I see $30 on a H&S break down
ugly..if 39 breaks
BTC has been taken the woodshed!
ADBE another strong ER.. what an amazing run once BO thru 50’s
AMRS looks good off ER.. already into gap fill from May with close that day was 8.07 …
CY nice little AH pop – High-Performance 802.11ac Wi-Fi® and Bluetooth® Combo Enables Advanced Coexistence, Superior Range and Low Power – no idea what this means, but its trading higher lol
78 comments today, not one mention of gold or miners (except for Alexs’ note on NG, HMY).
There has been an elusive move higher for the USD since Jan 25 and a mirror image move lower for gold.
Actually – The USD is almost the same price as it was Jan 25th. You must be looking at UUP, which is misleading
refresh = sideways chop https://uploads.disquscdn.com/images/2c3cf201c894f65def810c441309b7d9a0ebdf08397d8c6103fcb4f41affd961.jpg
Gold=boring right now! 😛
I just finished the Friday report and I am just quickly proof reading it. It should be out by 8 am Eastern
The report is released