If you have clocks that are not automatically calibrated ( Cell Phones and Computer clocks are, microwave oven clocks and wrist watches may not for example), You want to turn your clocks ahead 1 hour this morning 🙂
SPX – The expectation on a possible a-b + c-d extension is shown in green. The pull back into a dcl and further upward gains is a possible cup & handle, but this is just one idea going forward.

This would follow what we have already seen with SOX & NASDAQ
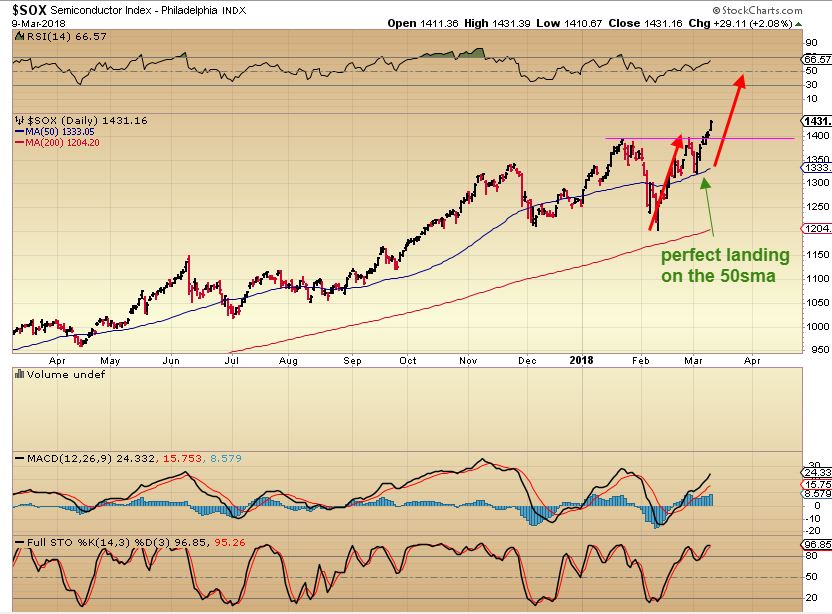
SOX – The SOX ran to January highs, dipped to the 50sma, and has now broken out to new all time highs. I am hearing many saying how bullish this break to new highs is, and yes, it usually is. This CAN be a very bullish situation, but it depends on the economy going forward too. Notice also …
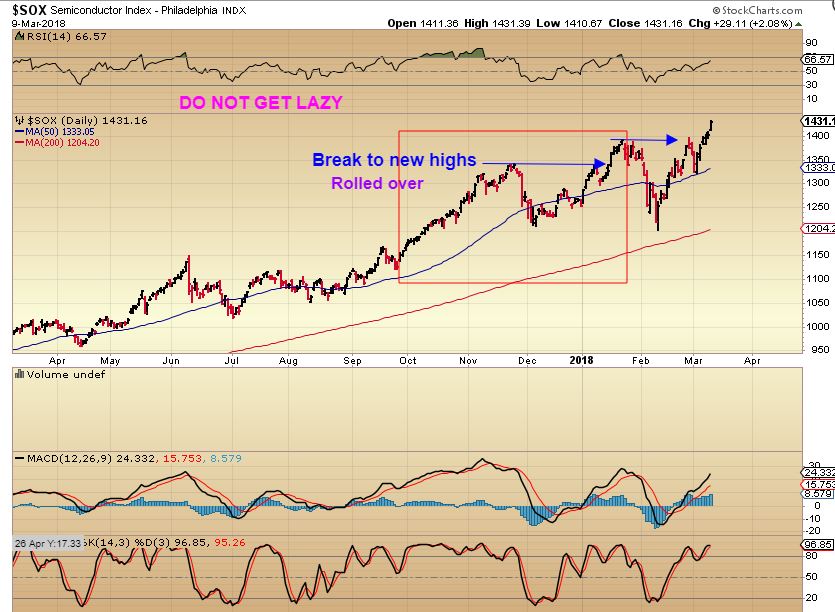
SOX – Please take note that Januarys break to new highs were also a ‘break out to new all time highs’ , and yet they did roll over. People forget very quickly what can happen, don’t they? So lets enjoy the ride, but do not get complacent. Always rely on stops.
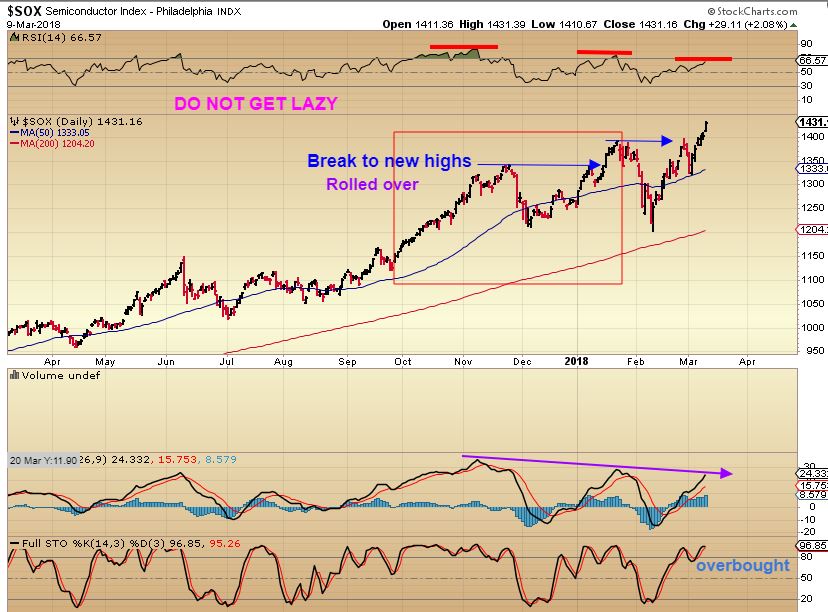
SOX – I need to point out again, using the same chart what many seem to be missing. Each new burst to ‘new highs’ was accompanied by internal weaknesses, like lower highs on the RSI. This OFTEN leads to choppy sideways consolidations, back tests, or roll overs, so we shall see in time…
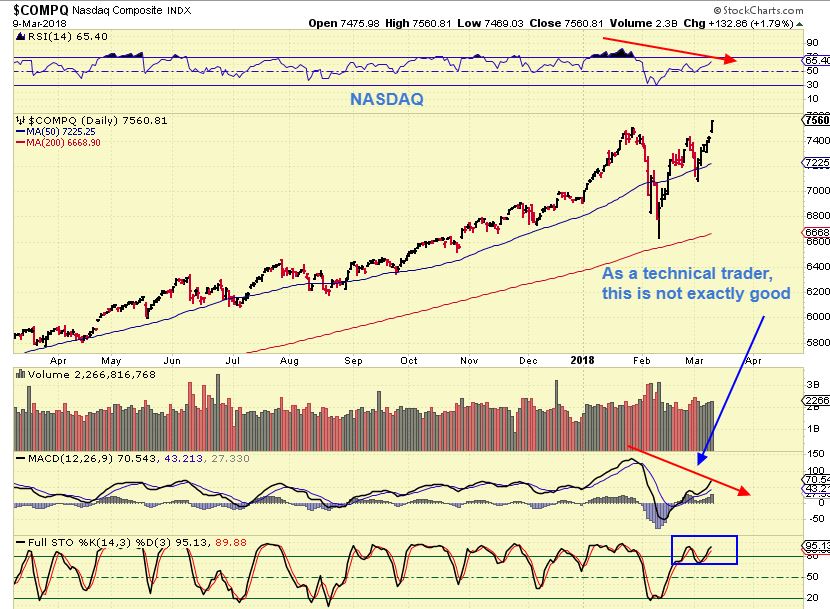
NAZDAQ – And the NASDAQ is no exception when it comes to a non-confirming new high. New highs, RSI WEEK, MACD not confirming .
So the idea is this: I am long, I own SOXL and a few Tech STocks, and they are doing great. I can ride these and see if some sideways consolidation allows the RSI to catch up. I can sell a portion at highs and let some ride ( I do this most often). I can use cycle timing and try to sell near a daily cycle high, but this is tricky. Just know that you are going to hear ALL Bullish talk breaking out to new highs, and even though trades have been very good, we still need to be aware that dips, choppiness, etc can happen, and signs here are that we may get that ( March 21 is the FOMC meeting, that may get a reaction?). That said, I am Long & Strong unless it goes wrong 🙂 The first chart in this report is still a very valid expectation.
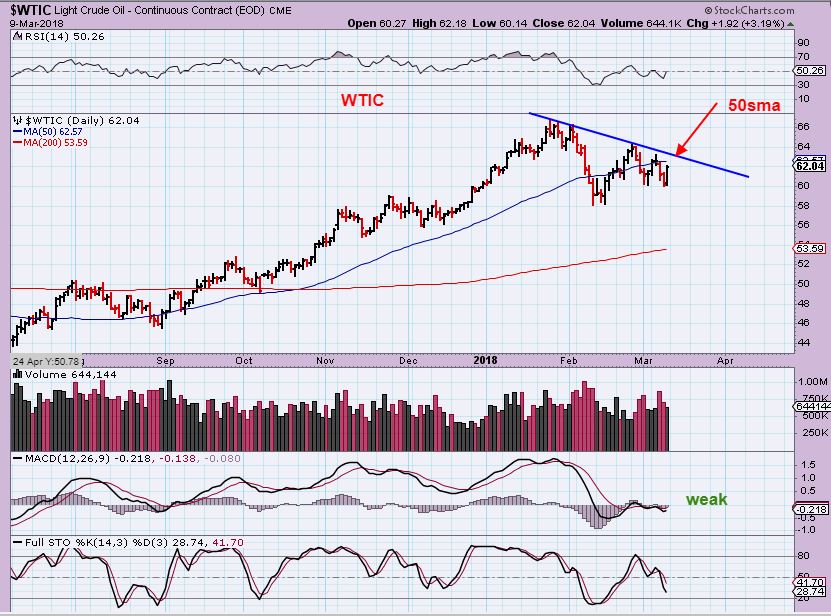
WTIC DAILY – I am also still short Oil, and the COT remains quite bearish. This is the point that I would have to stop out.
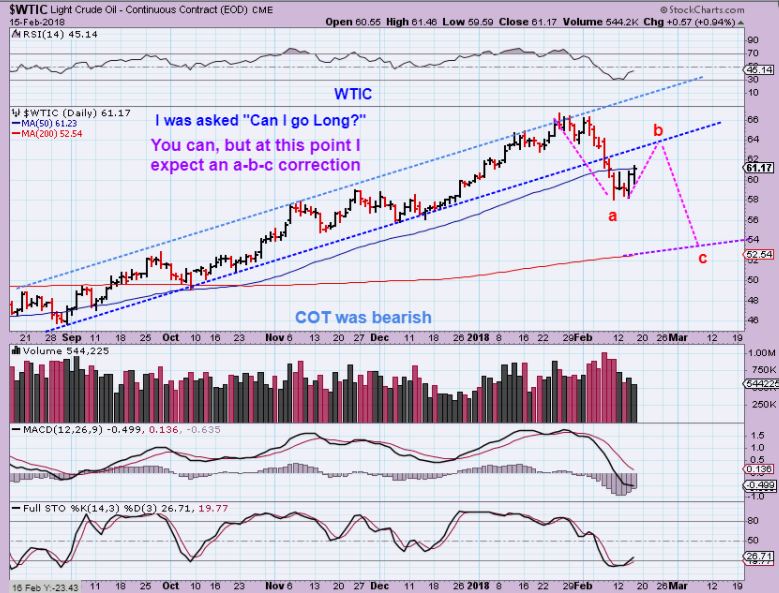
WTIC daily – I drew this way back in mid February as an expectation.
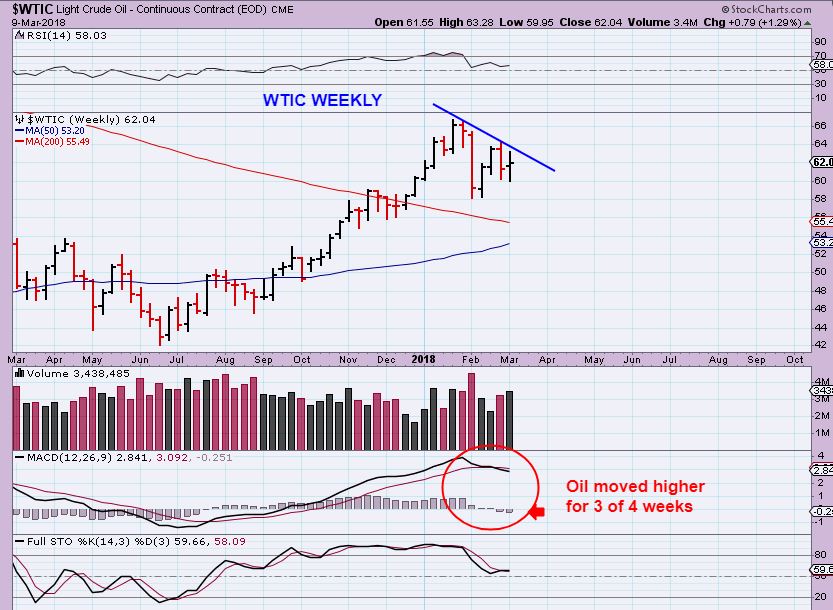
WTIC WEEKLY – This actually looks neutral with a high volume push higher last week, but I am still short. The COT shows smart money is Very Short, and this MACD still looks week.
Someone asked me , ‘Have you considered that Oil could break out higher as the markets break out higher?’ This report also could ask, ” Could the markets drop back down and Oil drops down too?’
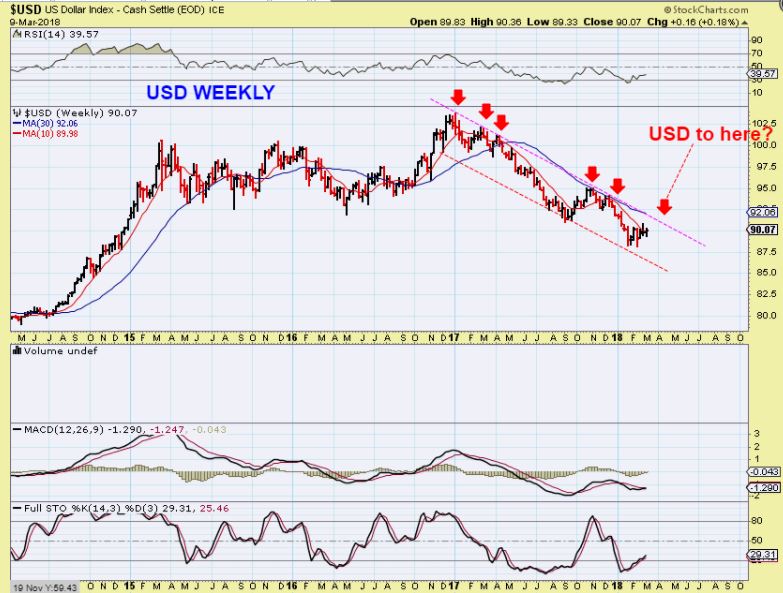
USD WEEKLY – So if the USD can continue higher, Precious metals can drop. This looks like the USD can move higher. In the BIG PICTURE, it looks like a weak bear flag.
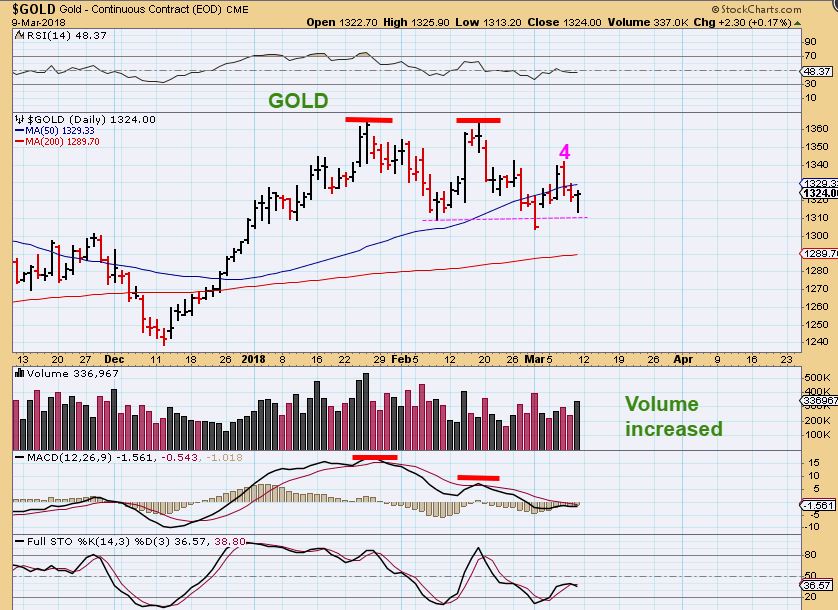
GOLD – Gold has been choppy. The sudden surge higher of $16 on Tuesday was just another fake break higher, as expectated.
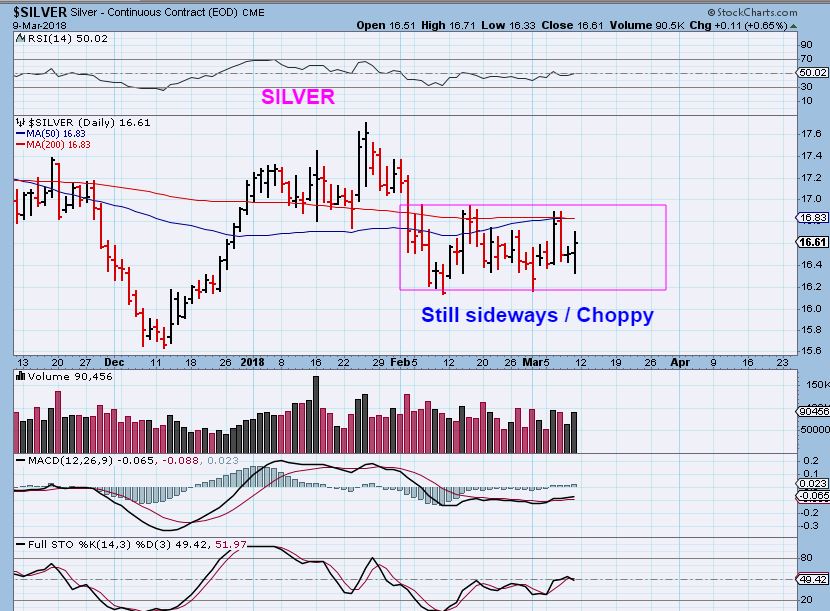
SILVER DAILY– Choppy sideways consolidation continues, unfortunately as expected.
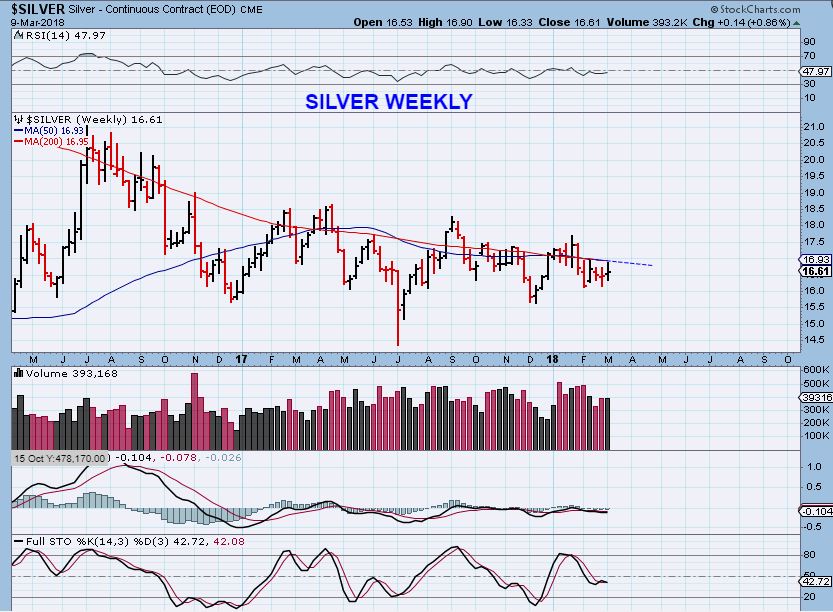
SILVER WEEKLY –
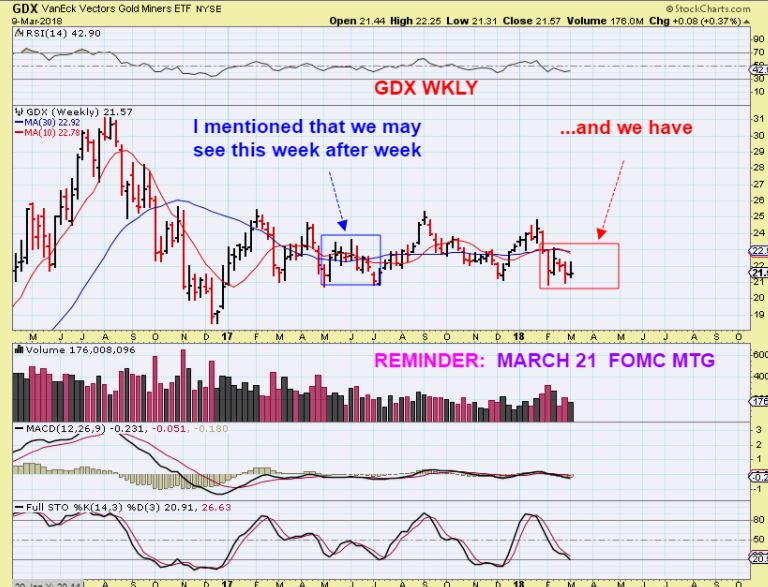
GDX – Weeks ago in February I used this chart pointed out this sideways chop ( in the orange box) and mentioned that (Unfortunately) we could see that until a solid direction comes into play.
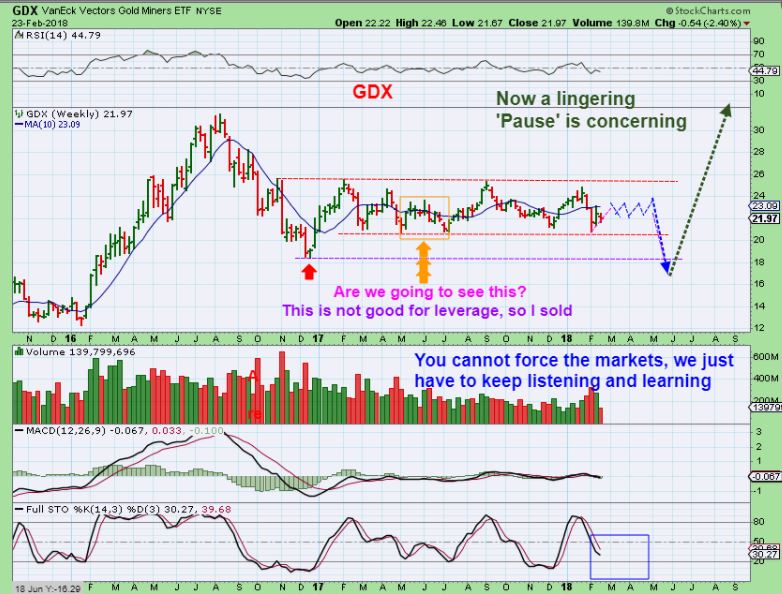
GDX – And here we are weeks later sideways, choppy, and difficult to trade. THIS IS NOT EASY TO TRADE, so we’ve focused on other trades.
Let me say this about the General Markets: If that was an ICL, we should not roll over & drop very soon, but the MACD & RSI seem to indicate a pull back and consolidation could occur. The First chart in this report is how I am leaning right now, I am bullish and taking things day by day with my trades. The dip shown can fix the RSI. BUY & HOLD out of an ICL is your choice, but it isn’t always as easy as it looks in hindsight. I use trailing stops on ETFs.
I still think that 2018 may give us a break from the sideways precious metals consolidation, and a rally that will beat current trades by a lot will follow. The markets make you wait at times, and they bore people to death until they actually just give up. I am seeing that now. Almost everyone wants to go long the General Markets and never trade Miners again. That could mean several things 🙂 This is your weekend market wrap up, my daily reports cover the action as it unfolds. Enjoy your weekend!
~ALEX
LESSON: You will hear that the run above the 50sma and move to new highs always leads to bull runs. We need to at least take another look at that.
IF WE BREAK TO NEW HIGHS – THAT’S IT– IT IS BULLISH AND JUST RUNS FOREVER HIGHER, JUST LIKE AUGUST NASDAQ 2015 ICL …
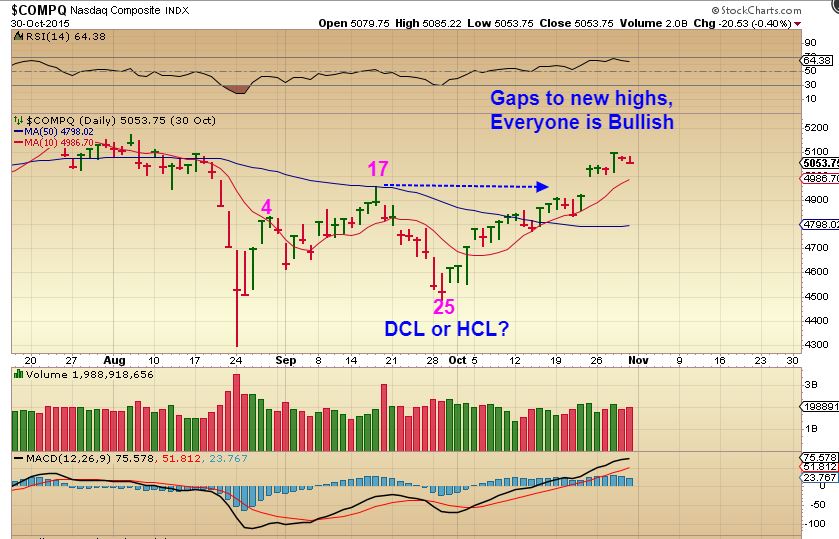
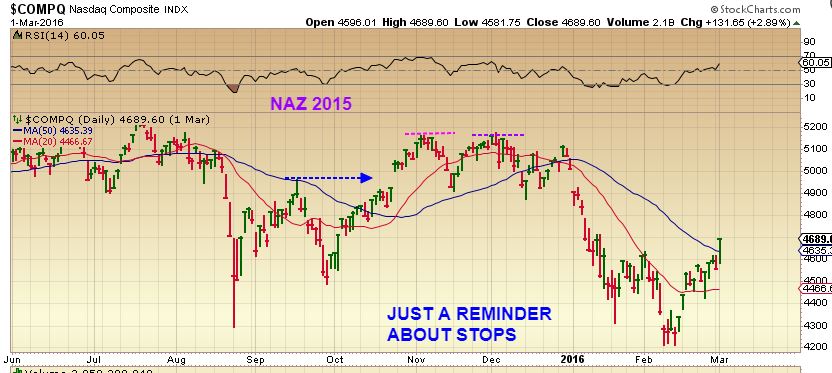
OR IS IT? YES, IT BROKE ABOVE THE 50 SMA, Yes, it had a higher low, yes the 10 & 20 sma crossed the 50sma, etc etc etc . AT THE HIGHS, THE RSI AT THE HIGHS WAS WEAKENING, and I take that as something to keep in the back of my mind. This triple top gave plenty of time to notice the RSI was lower on each peak. I am watching how things play out now too. A year of interest rate hikes might be something that changes things. We’ll see.
FRIDAY March 9th 
 Tuesday March 13th
Scroll to top

Hi Alex, we are on day 20 of equity cycle, yes? Based on that, when should we be anticipating a DCH in this IC to lighten up on leverage? Or do you recommend old turkey based on your first graph of SPX? Or some other strategy? Basically, what is your plan for the soxl you own?
I should add that this is the area I am personally trying to improve as a trader. You often tell us after the fact when you exit trades, so with that in mind, it would be great to know more details on exit strategies other than use a trailing stop, so I can make wise decisions like you do.
Hi Peter, great question. I think most of us here, and most traders in general, struggle with this as well. I know that I certainly do. Will be excited to continue to improve here with CFs tutelage.
” This is the area I am personally trying to improve as a trader” – That is good.
Do you understand A-B = C-D? Do you sell price targets? Have you read any books on technical analysis for traders that I recommended? William Oneil Books have taught me some of what I have pointed out here-
some of what I use when I show an A-B = C-D target, or a cup & handle price targets. H&S price targets, etc. It is in his books, and I dont recommend one over the other- all of his books have charts and examples of price targets on cup & handle patterns etc. The problem is, many wont sell when the target is reached and sometime s Price targets do extend a lot more than the estimate.
I find that when a trade is going well, many wont just let go and move on, they wont sell on the way up. That is fine for BUY & HOLD, but they can get volatile/ bumpy in consolidation periods. Trader vs investor mentality is situational too.
I use cycles as a guide for a buy & hold for weeks, but not a specific sell signal. ‘Peaks’ are not an exact science at times using cycles,
Price targets for trade set ups are easier to find using price target methods. Grab a book on technical analysis.
Experience will probably teach you the most if you take note of past mistakes and past times that you were able to lock in gains, but many trades differ from others and I am constantly monitoring my trades without getting emotional.
Hope that helps
Hi Peter,
I have many different ways of locking in gains, and it is based on experience, not just cycle count. I have shared these methods here, but many will not trade the way I do. If I see a set up running out of a consolidation, I may sell 1/2 on the way higher as it gets extended, have you tried that? Many just fear missing the greater move so they want to stay invested.
My best advice to you, to trade more like me is be willing to sell on the way higher when your gains are strong, but even that is situational with me.
I have always mentioned that I go heavy at ICL lows for Miners and try to sell on the way up 2- 4 weeks later, as the daily cycle peaks. I mention what I am thinking on day 23, day 17, day 23, etc.
BUT If I buy a stock – I may actually add on the way up if I expect a longer run out of a consolidation. I may buy a position heavy at support ( back test of the 50sma, maybe when I see a consolidation breaking above a trend line, etc) and depending on the set up, I add on the way up or I sell on the way up.
I think that I do post when I sell 1/2 and will ride the rest, but many fear missing the move, and will not sell on the way higher.
Also using stops is another area where you may need to be resolved. Use & Honor stops based on your risk reward and do not just keep riding positions down based on where I might have my stop (below what your stop would be).
One can always get back in, even if it is just a shake out, but I do see some riding leverage way below their entry. That will be costly more often than not.
Also to answer your question, No, I do not just use FOMC as a target, that is unreliable & kind of a guess.
Last year dips were not always very deep into dcl for the General markets, so you have to always consult a chart , day after day, and look at how things are unfolding. Is it breaking below the 10sma, that is a warning sign, breaking below the 50sma is a deeper warning, etc . Extending well above the 10sma is a warning so I might sell on the way higher with an extended move too, and just wait for a dip to get back in.
As a sidenote: I usually have tried to post when I sell real time, if it is when I am in front of the screen. (unless I am stopped out). Like when I bought MU – I mentioned that I sold it recently.
I know at times that you have asked me in the past “Are you still holding JNUG?”, but you often ask when it is well below my entry. That should be understood, that I am stopped out. I DO NOT ride leverage like JNUG or NUGT down below my entry unless I am catching an ICL on day 30+ or some other special instance, so if I am in JNUG , I am either riding it with profit, selling it with profit, or stopped out for a small loss or above break even. JNUG is not one to enter higher and ride down below your entrance.
General Market cycle count ‘Peaks’ vary, you get long daily cycles and short, you get Left translated & right, so “catching the top” is the hardest thing to expect. I often sell when I am satisfied with a trade. It has done what I expected. I personally use cycles as a ‘guide’, I dont plan on selling SOXL based on a daily cycle high expectation, I watch it & individual stocks as they play out. Experience is how you learn too. You should be learning from the gains you locked in, and the ones that got away, right?
Also I dont honestly consider TQQQ and SOXL, and UPRO as genuine “Leverage” that I have to worry about too much, as long as I have a stop. Leverage for Energy or Precious Metals leverage like JNUG, DWT, ERY, NUGT, etc move sharply. one can ride that down and lose massive amounts of gains. At times UPRO, TQQQ, etc gain1-3 % a day and stocks like MU , AQ, CREE, etc can gain 2-5% or so, so I treat them more like stocks, not levveraged positions, and as I have mentioned, I use trailing stops often or just cash them in as they run higher.
So back to your question. A daily cycle in the General Markets ROUGHLY runs for 35-45 days. If I expect it to become R.T. out of an ICL, it may not ‘peak’ until the count is in the 30’s, but it could peak sooner. in a 2nd or 3rd daily cycle, it may peak sooner too, but lately with the kind of markets we had last year, they peaked late, barely dipped , and kept running higher (Last year) .
Thanks for sharing!!
Have to have the plan from the beginning. Sometimes I plan to sell half and then realize I have a small enough position that it doesn’t make sense. Then when I analyze the trade realize it wasn’t my exit but my entry was probably off. All in all great advice to consider, thanks again!
REFRESH- this is a chart that I used in a report last week.
You measure the first move, add it to the second move, and that is a rough target to lighten up.
When I draw these, my second arrow is always the same length as the first- that
is a probable target under favorable conditions
IF IT DOESNT MAKE IT THERE, and volume looks heavy on a dip, I might sell 1/2 in case something changed.
https://uploads.disquscdn.com/images/e009534572629ecf2bdd534639ec3b0eb59e9736ca30c690d23367939a9cddfa.jpg
Thanks, I appreciate the detailed response. It was very helpful. I’m going to cut the text and re-read it for the future if you don’t mind. I read O’Neil’s latest book (4th addition), and it was helpful. As you said, even reading his chapter on selling won’t get you there. It takes experience real time. I haven’t used A-B=C-D but that is a good strategy to consider in the future.
Target trading is also something I do consider. What usually ends up happening is I either get shook out before the target and then it reverses, or I stay with the trade in a pullback and it doesn’t reverse. The markets seem to play the opposite of your gut instinct very well. That’s why I need to better decipher pullbacks to respect vs. pullbacks to ignore based on MAs, trend lines, volume, etc. And then honoring those stops is key. Something I don’t always do.
And the lesson on commodity 3x ETFs is very well warranted. I don’t plan to take a loss on JNUG in the future; my next buy is at the next ICL.
Thanks again.
Many years ago I too read chapters on selling in a few books , and though they can cover the basics, real time can be very different for many reasons, so while it is helpful, you will absolutely learn the most from trial and error. Real time adds 2 things… 1. YOUR MONEY 2. YOUR EMOTIONS, and those factors added in can make selling very hard.
I used to even keep a note book and if I had a big loss, I would write the date of the chart, entry, exit, why I held on, etc – and almost every time back then , I held on “Hoping’, because it was a good company. in the 2008 sell off, I had trouble letting go of some at that time. I kept lowering my stops because ( Usually) it was a good Miner, low cost production, prior quarter earnings showed increase in production, etc, so I was just hoping that buyers would step in ‘tomorrow’. ‘The next day’. ‘etc The next day.
As for what you said about ‘target trading’ – I know exactly what you mean. Take a look at AQ today. My target is higher, but it dropped over 50 cents. If I had 5000 shares and it drops 50 cents, I may begin to look at my account and think, ” I am down $2500 on that one today, maybe I should just cut it loose”- but really – so far – the chart is perfectly fine. It is my account & emotions that want me to stop giving up gains. However, the sector remains fine, and this drop on a chart is not bad, we had one Friday that recovered, so I have to ignore my account & focus on the chart. If the chart is not breaking below the 10sma, etc, it may just be wiggles. I need to allow it to play out.
And yes, ICL is the best place to buy a 3x etf, and I also buy the 2nd daily cycle low too, but in this sideways chop, that has been a gain some & give it back battle….it usually works well . In this recent chop, I have bought the ICL, added at $12, $!3 , $14, and watched it drop to $13, so then I would be down on 1 position ( the $14 add) , break even on the other ($13) , and maybe I just sell before it gets too messy- it didn’t act correctly over the amount of time that it was allowed to. Things like that affect my 3x ETF holdings too.
It is a LOT of experience & trying to remember if this worked out last time or not & why.
I could probably write a book and not be able to finish it in these ever changing market environments 🙂
#Priceless
However, the sector remains fine, and this drop on a chart is not bad, we had one Friday that recovered, so I have to ignore my account & focus on the chart. If the chart is not breaking below the 10sma, etc, it may just be wiggles. I need to allow it to play out.
#Priceless, or # jinxed it – lol
Refresh
https://uploads.disquscdn.com/images/d742d095d2b4ec183310f4e87a0dd717c295c6e046c5bb7c1684f8875d7a5d45.jpg
How far below the 50 for the stop?
Draw a trend line along the lows from Feb – march – but can you take that much heat?
Its a personal choice really
VUZI reports Wednesday
Thanks!
Yes, I keep forgetting that 🙂
I think you mentioned it last Friday too- thx
That’s sort of what I thought. Really gun shy after my big loss in January. sort of waiting for the perfect trade right now. Probably the ICL in gold.
MU… the monster
Price target was $60 – it doesn’t seem to disappoint.
target raised to $100 from $55 at Nomura Instinet
Well, my target for $60 was a measured trade.
I’m not sure what they are expecting- a year?
Lol upgraded PTs always me lol – like where are u getting this from hahaha
Usually its after they downgrade it, drop the price, and buy it.
Then they upgrade it for a rise higher 🙂
It was up 3%, now up over 7%. Nice.
Sittin on my hands today, almost all my normal tickers are extended or at new ATHs…. Trying this new thing called patience.
I’ll give that a thumbs up, if they back test break outs or something, you can buy the pull back.
I added to VUZI for 1 final time on this pull back, Watching my DWT ,
and either going to add to ACBFF ( It is above the 10sma, dropped back to it and reversed higher) or I am going to wait & add if it can get back above the 34 sma
My only positions right now are WMT 87.5 entry, VUZI 8.65 entry and KEM 18.60 entry
NICE On KEM. It has been pretty steady
Oh and my TNA!!! lol but its not on the moon yet
Yeah, Some of the General Market 3x s just move like stocks 2-3% a day, but that makes them a bit easier to manage too, rather than a 15% moving JNUG or NUGT 🙂
not sure how this relates to price movement but have been hearing from a number of people familiar with the Cdn cannabis legislation that approval for legalization (Bill C-45) may be pushed to fall 2018.
It could affect price action, and maybe these prices could drop further.
I own a couple now .
Just a guess here, but the markets do often figure in price 6 months ahead of news, and indecision often causes selling. We ‘MIGHT’ have had recent pull backs with the indecision, and price firming up with a set date down the road ( even though it was a change in the wrong direction).
I say this because I am still seeing some act correctly
Refresh: This is MYMMF & I own it from near $1.75. It broke out from the 10sma, and above the down trend, and back tested . SO far so good. We;ll see, but this is acting correctly.
https://uploads.disquscdn.com/images/c3f4242bf8fea2d9cb5da932c08afe6a3b6bd3b799a65f891ae72bd7e88cf6b0.jpg
TRXC finally moving back above the 50sma, after breaking below and holding the 20sma.
I am using ONLY the 20 & 50 sma for TRXC ( The 34 sma is good too though )
DWT is working out as OIl ( See USO) was rejected again under the 10 & 50sma).
So far, so good
ha! … was just going to say that…. nice little pop there… shhhh…
That’s an ETN correct? Anything other than an ETN you can recommend?
SCO
I’m with you, Bill. My accountant shivers when I bring him the ETN end of year statements, and I mistakenly purchased this in my personal account and not in an IRA, which avoids the paper work.
Does he shiver when he sees you buying JNUG 🙂
As i understand it he says there is a big difference accounting wise between an ETF and an ETN.
Here is what I found in a search on the subject—-note emphasis on Tax-deferred account. This was by Paul Baiocchi-“Diffinitve Guide to MLP ETFs and ETNs.”
To summarize, you should own the ETN if:
The investor expects the majority of total return to come from price appreciation.
The investor is using a tax-deferred account and cannot benefit from the tax deferral of the ETF structure.
The investor has a shorter time horizon.
The investor places a high value on transparency and predictable returns.
The investor is unconcerned about the credit risk of the note.
The investor is more concerned with total return than after-tax yield.
An ETF/corporation makes most sense for MLP exposure if:
The distribution yield of the MLP is greater than or equal to the MLP index total return. In this case, the tax deferral overwhelms the performance hit of the internal tax issues; however, paying out a higher distribution than total return is likely unsustainable in the long run.
The investor has a very long time horizon, including potentially passing her position to an estate.
The investor uses a high discount rate to value future cash flows.
The investor has a low tolerance for credit risk.
The investor is comfortable with complex tax accounting and its associated risks.
The investor values tax efficiency over absolute returns or index tracking.
CASA me casa! F5
https://www.tradingview.com/x/fVBtamtm/
UPLD might be a nice buy here, AB=CD breaking higher after the bull flag. Earnings today, not sure if it was pre or post market.
https://www.tradingview.com/x/SrAKWqaK/
TWOU usually has a pullback around earnings. Which should be now. Id like to buy after a touch of the 50sma.
https://www.tradingview.com/x/SrAKWqaK/
KEM hits my first PT of 20, Filling out 1/4
Welp… MU is a monster, SOXL is a monster… guess i gotta wait for any pullback to get into these things now…
CF – GNMK?
SFIX
my lil shipper basket is doing ok so far today… i bot me DRYS, EGLE and DCIX.
thought they looked fairly ripe for a blast off.
DCIX is the riskiest one, but has a nice looking wave1-2 / double bottom pattern.. hoping for a ab = cd scenario
Is there a new 3x ETF out there? Ticker SOG!
think it should be a 10x ETF.. so long as it doesnt suddenly decide to become inverse
Ha, right? Buy the new SOG ETF, you don’t know whether it’s a bull or bear fund until you buy it! 😛
Good morning! Hope everyone enjoyed the Spring Forward! Hawaii doesn’t change times so the market now opens at 0330 and closes at 1000 for me. Yikes. 1 hr less trading possible each day. Gonna have to get in and get it done!!
Interesting with NAZ continuing to just run away, S&P flat, but Volatility up almost 10%. Increased volt. holding options prices steady.
….what up miners…
i get EXK now showing as a daily b/o on me indis
doin battle w/ the big bad bully
200sma?… 8th time lucky, since jan 1st!
yes..
PVG interesting…
#frisky
https://www.tradingview.com/x/75Jy0m9i/
Im diggin AG and HL… not so much with others…
yeah.. well dont say that too loud .. laFreak will come on & day he ‘added’ and they will both tank…
;o)
teeHee
well.. they kinda look like could be a ‘4’ before a rollover into a 5 down….
Took a postion in GNMK today. I really like this case and chart – PT 6.00 and then maybe 7s
CASA – I’m all out now. It was a wonderful trade:)
AQ – Added a bit more.
BZUN – started some under 48 here.
go girl …. :o)
BZUN must be an MJ stock
China stock lol! Needed to put something in my dad’s acct and this one looked like a great candidate due to that huge earnings gap
ba-dumm.. tsshhh
#uWouldNo
THCBF dropping back and tagging the 50 after Fridays gains.
SRAX DPW MARK
interesting at the 50sma
MARK maybe
omg MARA?? what the….
just checkn my blockchain etc list…dang..
double digits: nete, Lfin, nxtd, ftft, kcpc etc…
hmm.. did not look at charts yet…. no time…back to the grind .. as they say… ;o)
#Mewow
After you mentioned SRAX & MARK below, I did too. They do look to be setting up, and MARA?
Boom.
I have been watching both Blockchain & MJ stocks because they ran strongly a few months ago & needed to consolidate. They may be ready again, and THAT was a party that was EXCELLENT to my account.
yes please … :o)
I will skip RIOT this time around, but that was in the top 4 of my better gainers for Blockchain
MARA
https://www.marketwatch.com/story/marathon-announces-facility-in-quebec-has-commenced-bitcoin-mining-operations-2018-03-12?siteid=bigcharts&dist=bigcharts
ohh Snap ….
dang… lookin at MGTI.. yowzer if these turn…
Gidddd Eeee Up
mommas VacaFund has been suckedDry 😉
oh and PS. discus wont allow me to change my name back .. sooooo … i guess that means I have to go back??? LMAO
ha ha
haha
a girls gotta do … what a girls gotta do ……………..
#TakeOneForTheTeam
You have abused the system too many times? That’s odd
could be ..
BADMARIA …………….
https://uploads.disquscdn.com/images/1842172d043b0ca212b991d91fe8717f4dcce74d6e4b409cc99a5897832db9f3.jpg
Anyone in AEYE? It had a trend line break with significant volume.
$PTI – FDA news, AH spiker
$Copper sure looks like it wants to move up here
FSLR looks tasty here as well
Tuesdays report has been released