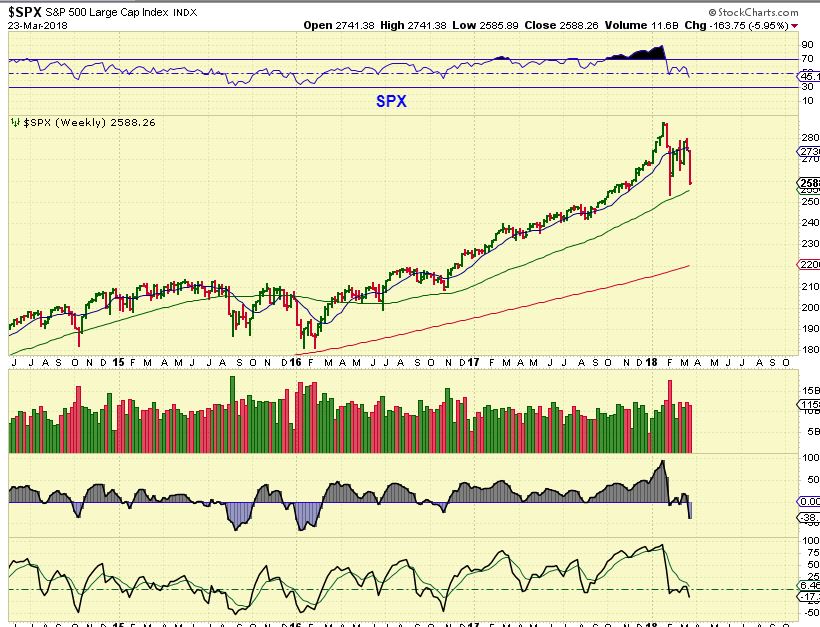
SPX – The SPX is near the 200sma, and this was where I said that I would begin to look for clues of a bottoming process ( long term or short term will be determined later). Will this do a quick shake out? Maybe, we are on day 29 of this daily cycle, but lets take a look at a few of my indicators.
So this is what I also found…
CPCE & SPX – When we get to extremes, I use various indicators to help me to identify where we might be in the move. The SPIKE in the CPCE tells me where to start looking for a bottom, based on past spikes. This does say that we are in the right area for a low, but it could go another day or two also.
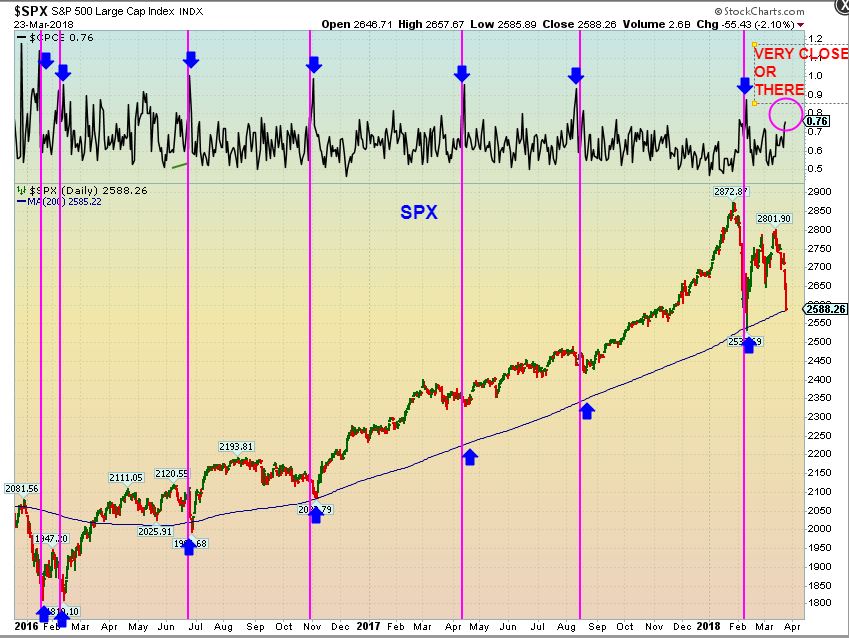
Conclusion for ‘Where are we?” : Day 30 Monday o fpossible 30-40 day daily cycle. Other indicators that I use however, also point to a low being very close ( Now or within days), such as a Bollinger Band Crash on a daily is happening. Signs point to lows beling close, I wait for a swing low. Is it a Short term low & just a bounce, or a Long Term Low? That will have to be determined with time, but a GOOD bounce should follow a swing low. Using cycles we look for a swing low. Friday again had a good intraday rally, the markets were Green on most of Friday, but I warned in my Friday morning report not to be fooled into buying an intraday rally – my indicators & Charts still called for more downside. So Markets were in the green Friday, but the last hour had the Dow sell off over 400 points avery quickly, and the NASDAQ lost over 170 points in an hour.
I do think that we are close, but it is stomach turning to ride something like that. Most will want to wait for a swing low, and it is assumed that the next rally will give us more clues.
Other Charts of interest.
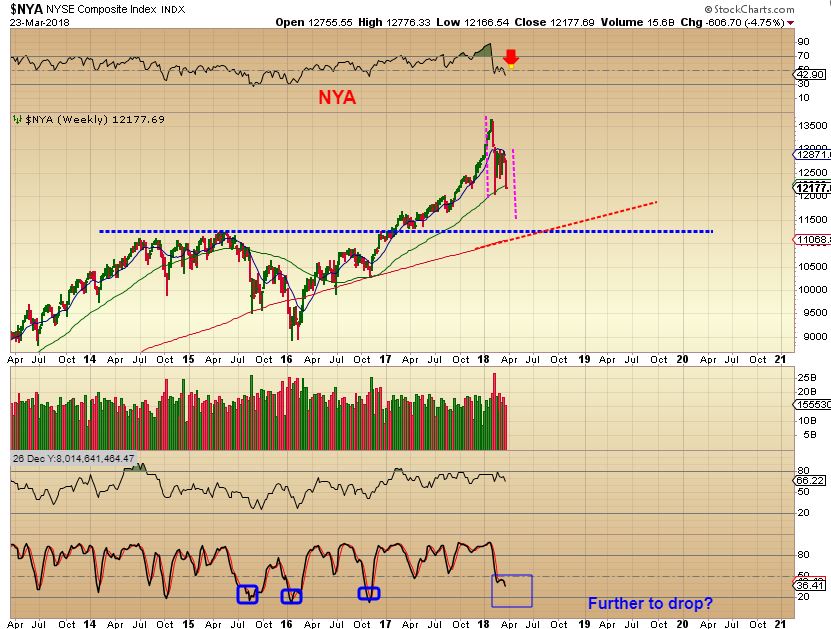
NYA – So the CPCE seems to have us close to a low, but the NYA Weekly kind of looks like it could have even more downside. This is why I wonder if we will have a permanent low or short term bounce? A bounce off of the Green Line as a permanent low is possible, so we need time. I will Obviously cover this more as time goes forward.
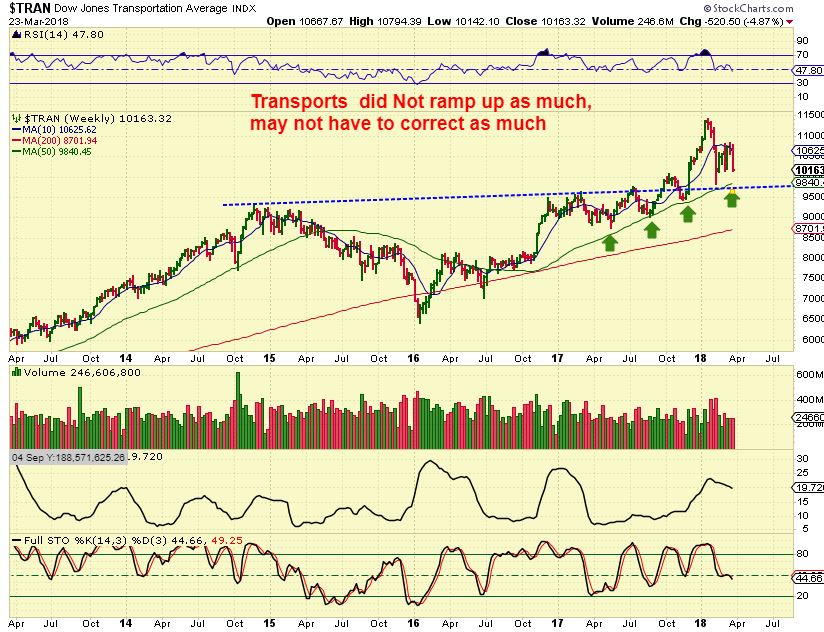
TRANSPORTS – Read the chart.
A SIDE LESSON:
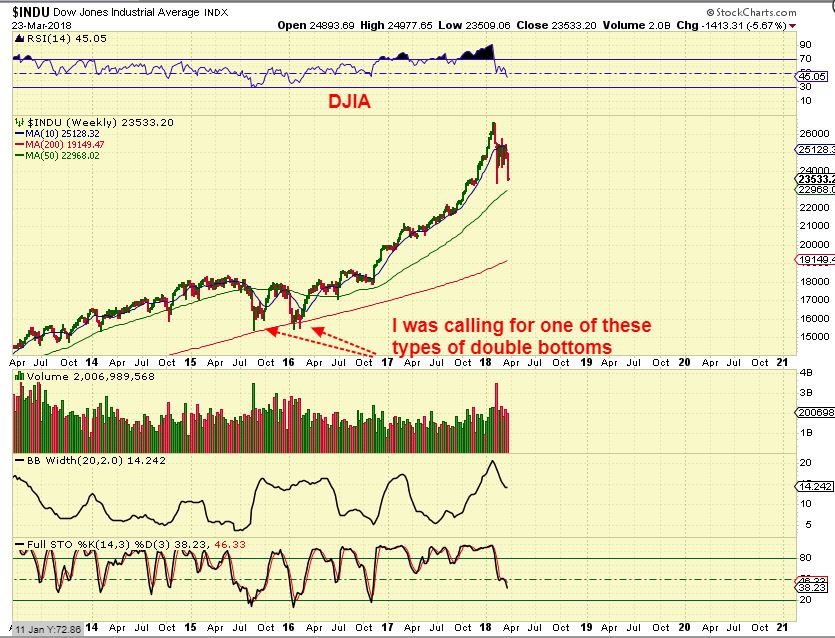
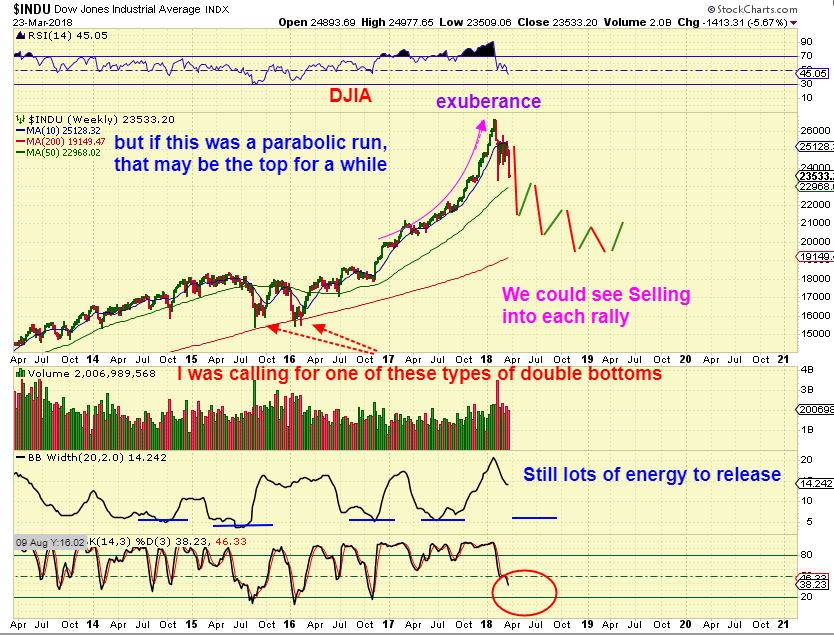
DJIA – So far this has played out in one of the ways that I pointed out when we hit the first Feb low, I mentioned a double bottom type formation. I warned those using leverage to just be aware of this possibility & keep a stop for protection. Bulls were just way too Bullish.
NOW, PLEASE LOOK AT THE DJIA RAMP HIGHER IN 2017 ALONE. Steep, right? That can be unsustainable, so was that a parabolic top? Maybe, maybe not. It is steep, but not as steep as other blow off tops that I have seen, but let’s look at something anyway as a lesson for the back of your minds as we track these markets …
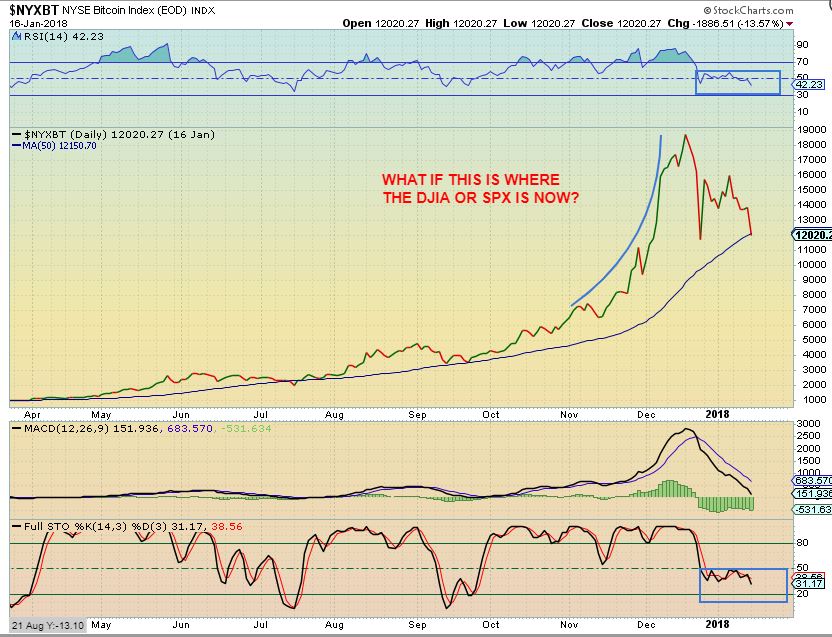
DOES BITCOIN LOOK LIKE THE ABOVE DJIA 2017 RAMP UP? Yes it does in a few ways. This chart also shows the time when BITCOIN did a double bottom low to support like the DOW & SPX Now. Look at the Stochastics and RSI vs the DJIS chart above too- they do look the same.
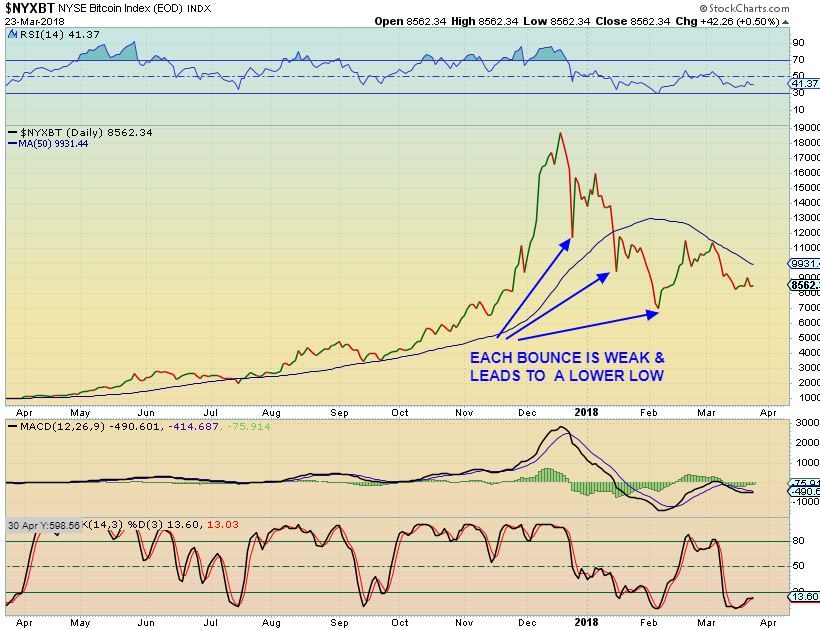
So BITCOIN had topped and next it broke to a new low. Each subsequent ‘bounce’ made lower lows until the extreme overbought condition is cleared up. Bitcoin Broke below support & back tested it so far.
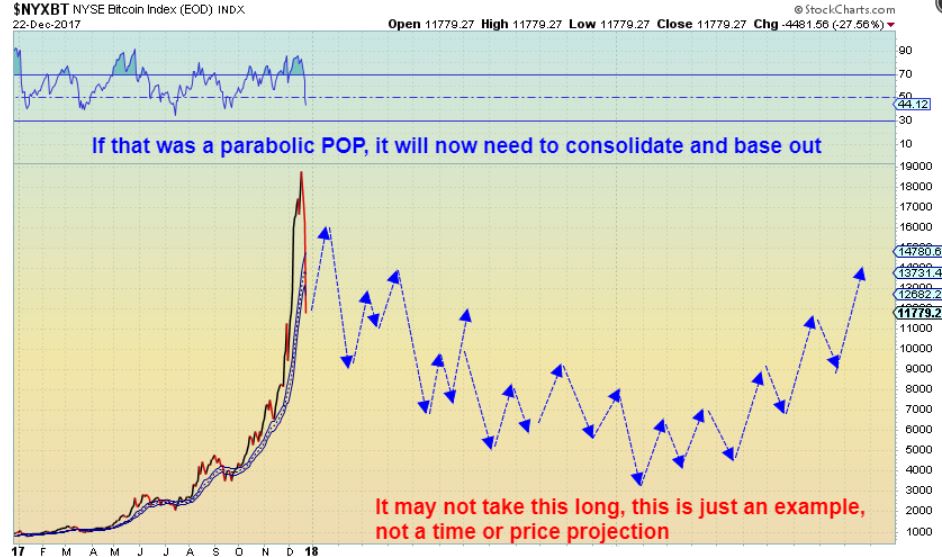
BITCOIN – I actually called for this possibility in Bitcoin in December, after an ICL was to be expected in Dec or Jan. EVERYONE started non-stop talking bullish about Bitcoin. “It just Can not drop”, they would say. The local barber, school kids , and your grandmother wanted Bitcoin. EVERYONE WANTED IN, and then the SELLERS took profits. Did the General Markets reach that kind of hype, where they will never sell down? EVERYONE wanted in and it could only keep going higher? Maybe, maybe not (yet). The recent double bottom could be enough to cool things off, but we need time to show us how the next bounce will play out.
SO AGAIN THIS CHART AS A REMINDER: THIS WAS BITCOIN ABOVE THE 50SMA on a double bottom pull back after a strong ramp up.
And this is now, when the DOW struggled under the 50sma– We will continue to monitor these markets, Next support could be the 200sma. BITCOIN was much more extended above the 50sma than DJIA, so we will see how this plays out. It CAN recover & run, but if it cant recover the 50sma for more than a day or two, you will be hearing reminders from me again. 🙂
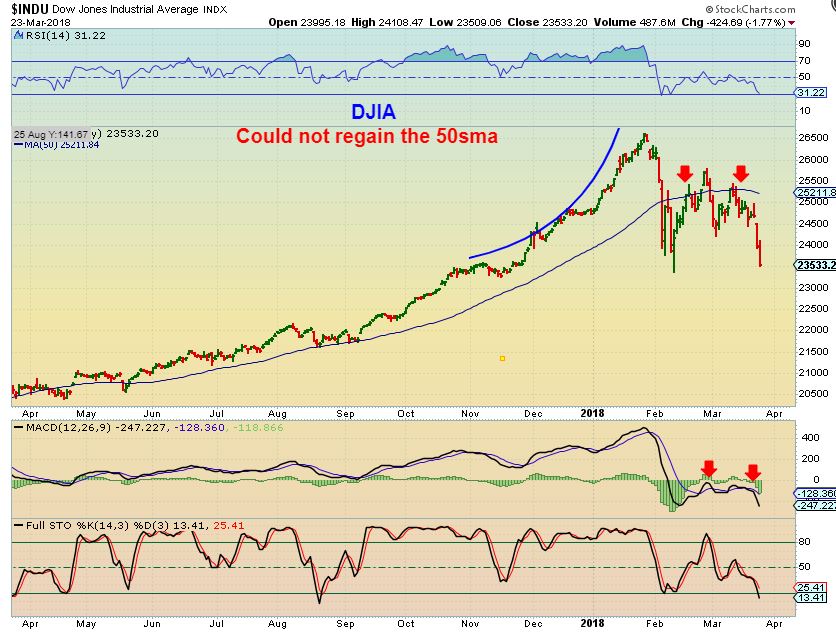
DJIA – THIS MIGHT BE THE DOW PULLBACK if we ramped to a ‘top’ and are now due for a change.
WHAT IF WE ARE NOW SEEING THE TIME WHEN THE MARKETS NEED TO COOL DOWN, AND MONEY FLOWS TO PRECIOUS METALS? Time will tell, but what do Precious Metals look like with the FOMC sell off this week? Yes, They ran higher. We’ll look at that soon..
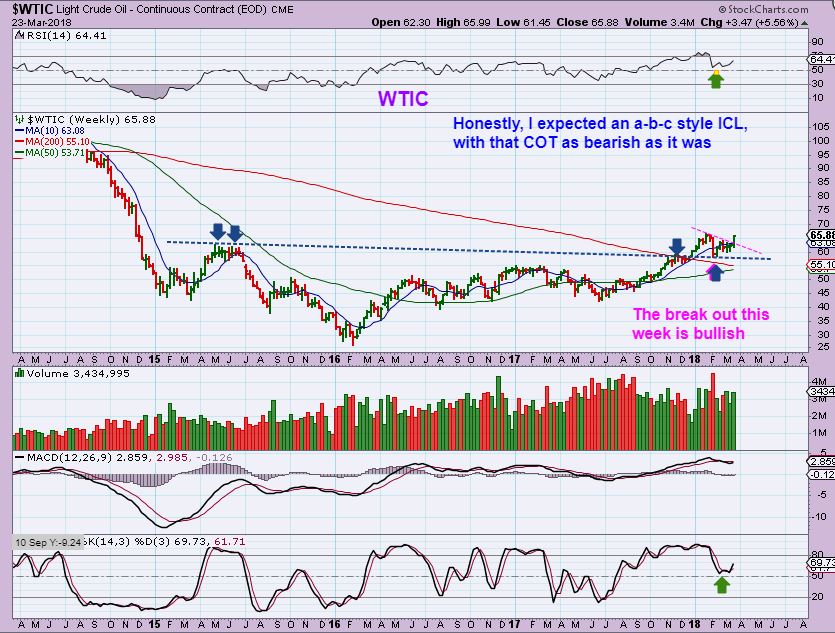
OIL COT – This COT has been so ‘Smart Money bearish’ that I was expecting an a-b-c type drop in Oil. Oil only sold down a little bit & broke out higher. This has been a bit of an anomaly ( deviates from what is the standard expectation) , so Lets look at Oil.
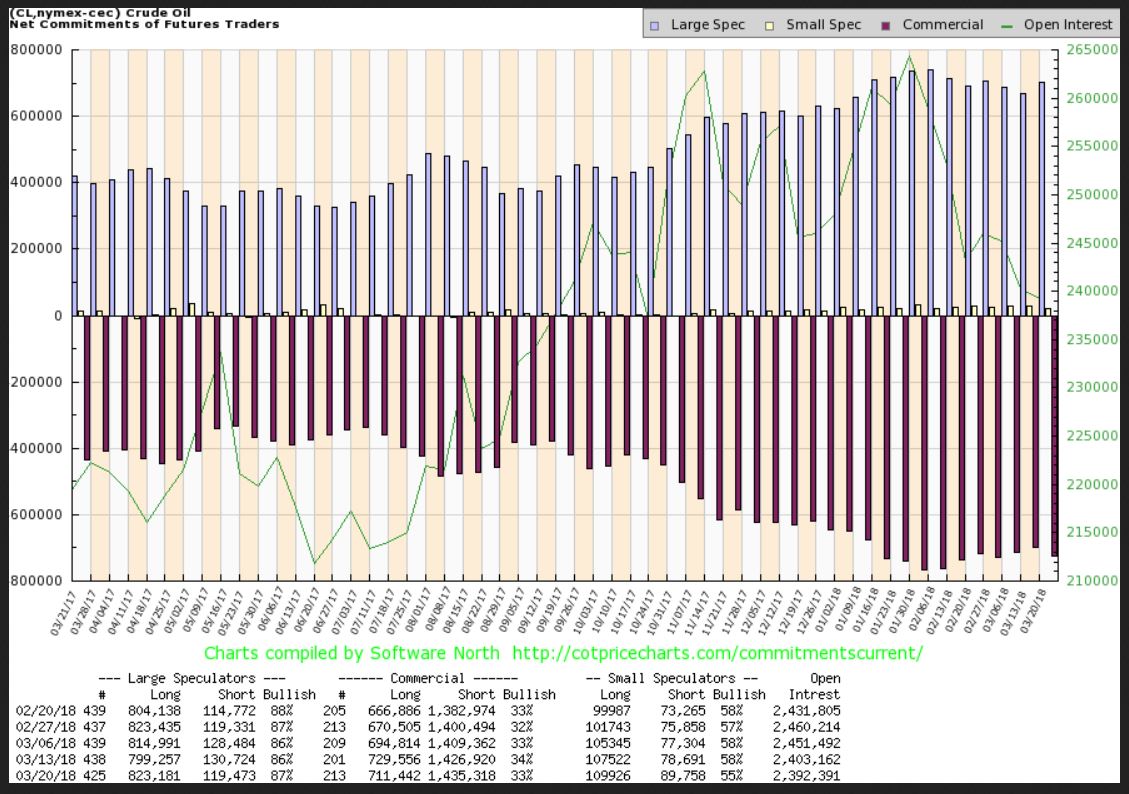
WTIC FEB 15 CHART – Expectations in Mid February were for an a-b-c type drop, since the COT was so bearish. I think these were almost record short positions by Smart Money.
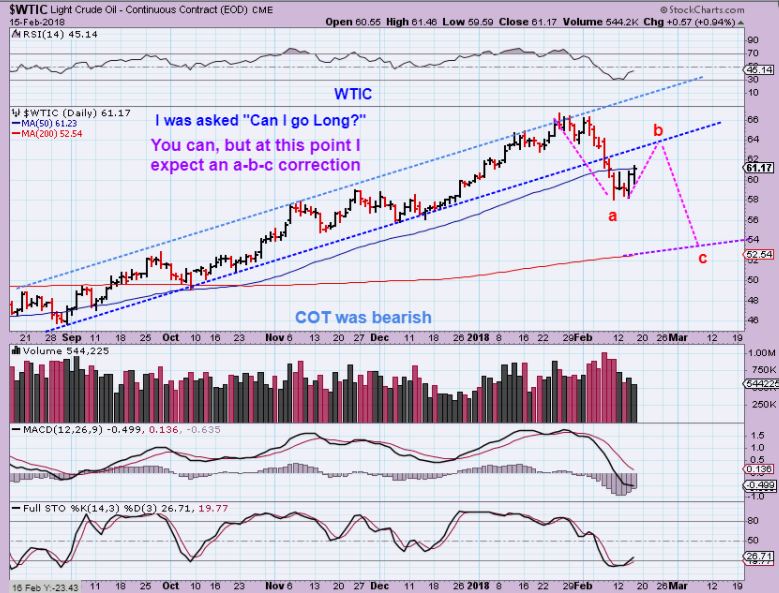
WTIC – That Mid Feb low ended up holding as the low, and that COT remained record bearish for Oil. Oil then consolidated and went sideways for weeks. This week Oil broke out above the down trend line on Wednesdays inventory report & signaled strength. We now have a DAY 29 high – a Right Translated Daily Cycle. I flipped long immediately as this broke out Wednesday and I encouraged buying some energy stocks last week.
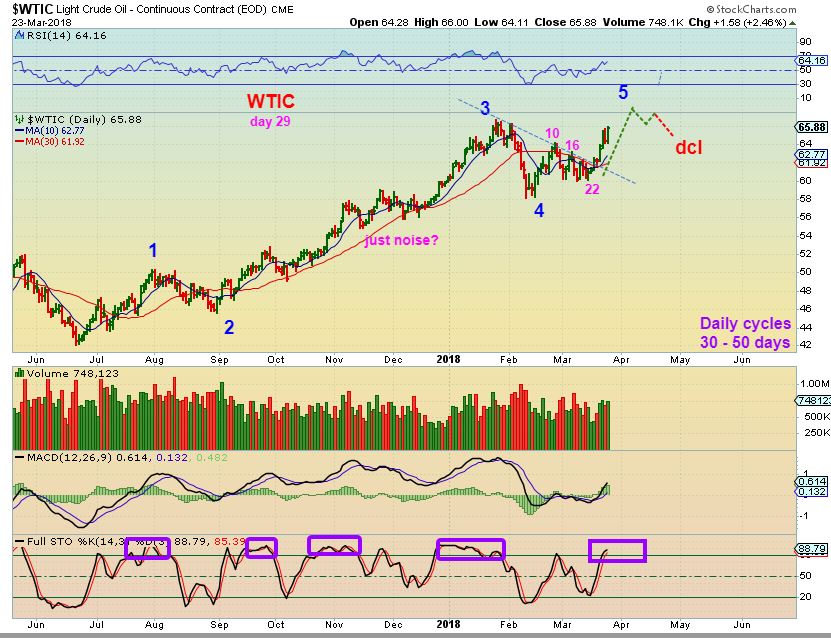
I still expect a daily cycle top soon, based on Monday as day 30 – Above I drew a possible cup & handle pullback. Was Feb the ICL? BIG QUESTION and it seems so, but that COT is still glaringly bearish and there are characteristics that I look for to indicate an ICL that also did not show up yet in Oils recent drop to ‘4’. Strange. Let’s continue…
WTIC – In the Big Picture we see a break out & back test of a base, a Massive base really. Is Oil headed back to $100 over time? It does look that way.
SO if OIL is nearing a daily cycle top and then a drop into a dcl, I want to point something else out that concerned me after Friday trading.
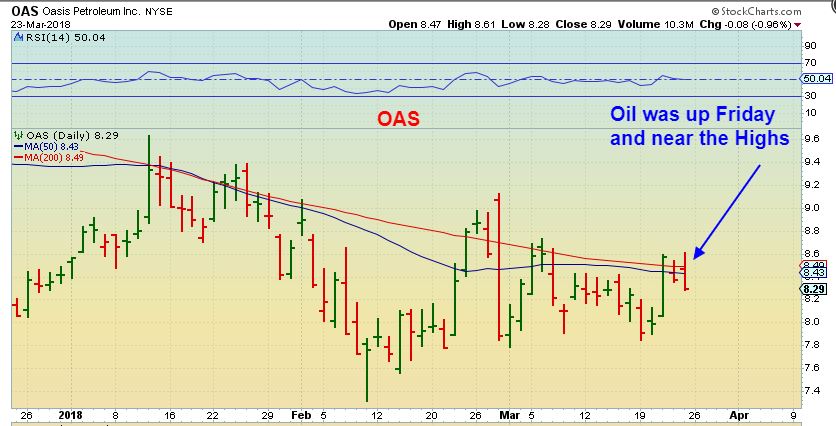
A word of caution after checking the charts. I expected a break & Run from OAS, and I almost bought this one. OAS actually lost the 50 & 200sma with Oil higher Friday? 1 day is not a big deal, however…
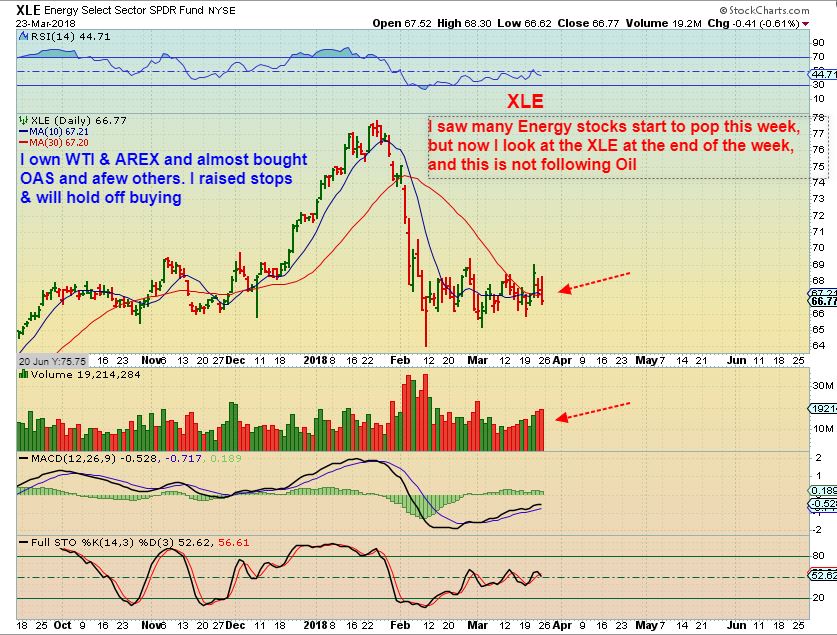
XLE – It Broke above the 50sma with Oil on that inventory report. XLE is not exactly acting as though Oil is at the highs, is it? This is a bit of a warning to me. FRIDAY Oil moved to highs and now the XLE is breaking down below the 50sma on heavy volume? “CAUTION”. SO…
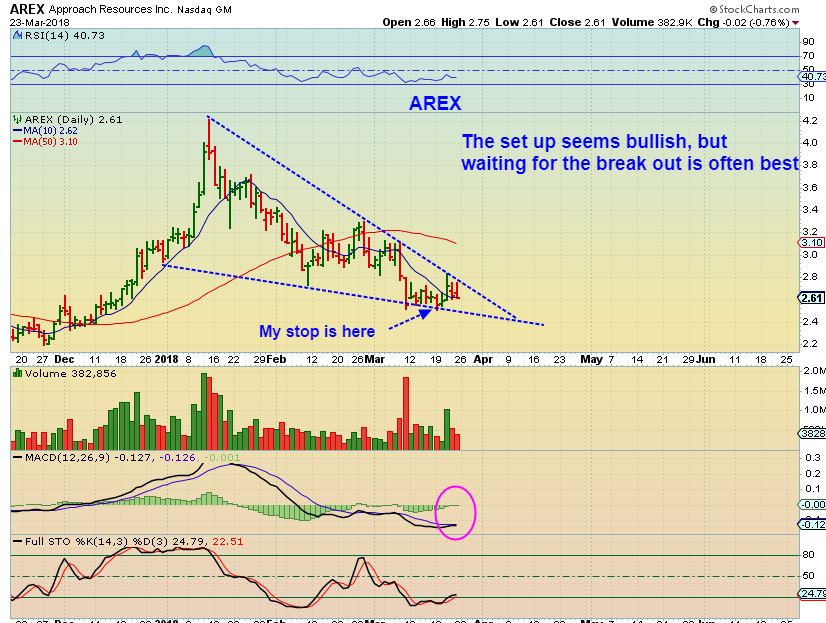
WTI – I Bought this and it is acting correctly, but my AREX is not and I decided not to buy OAS.
I want to be very selective, and now maybe only buy only Bullish charts at the next DCL. So I may not buy anymore until after the DCL in Oil or unless I see Improvement in the XLE, OIH, XOP. 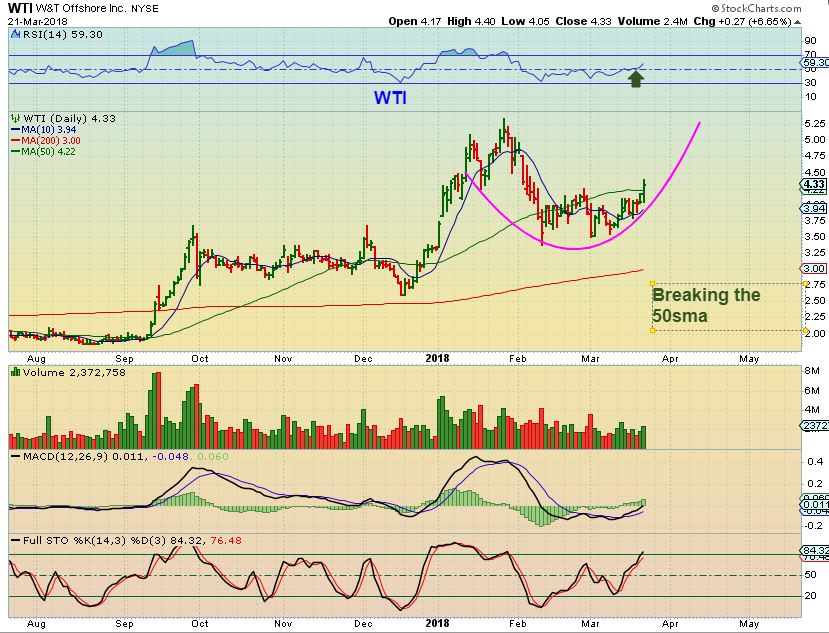
AREX – Not Bearish, it did hold the 10sma, but the energy sector etfs dropped heavily Friday as Oil continued toward the highs. I am a bit more cautious, read the chart.
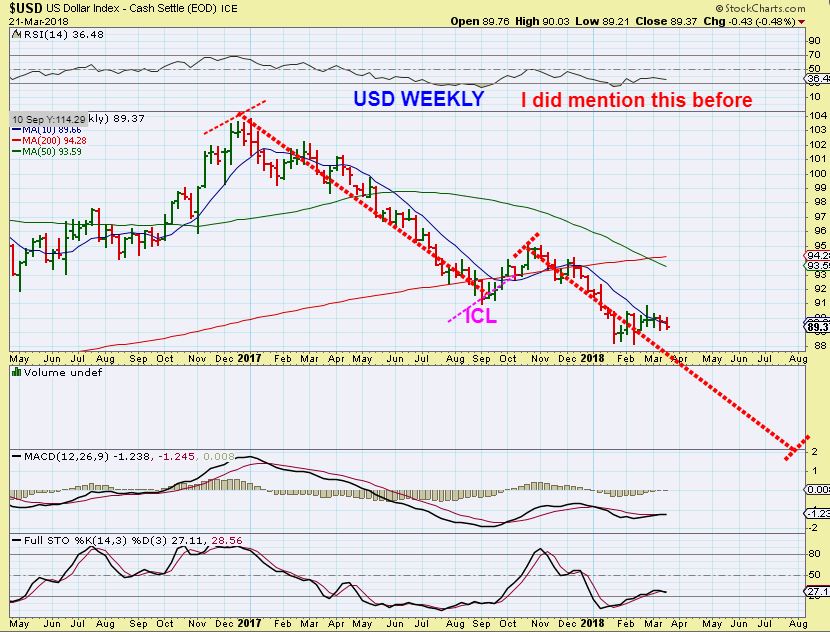
USD WEEKLY – Sideways for about 7 or 8 weeks. It has tagged the purple line in past rallies, maybe it just keeps going sideways to the purple line?
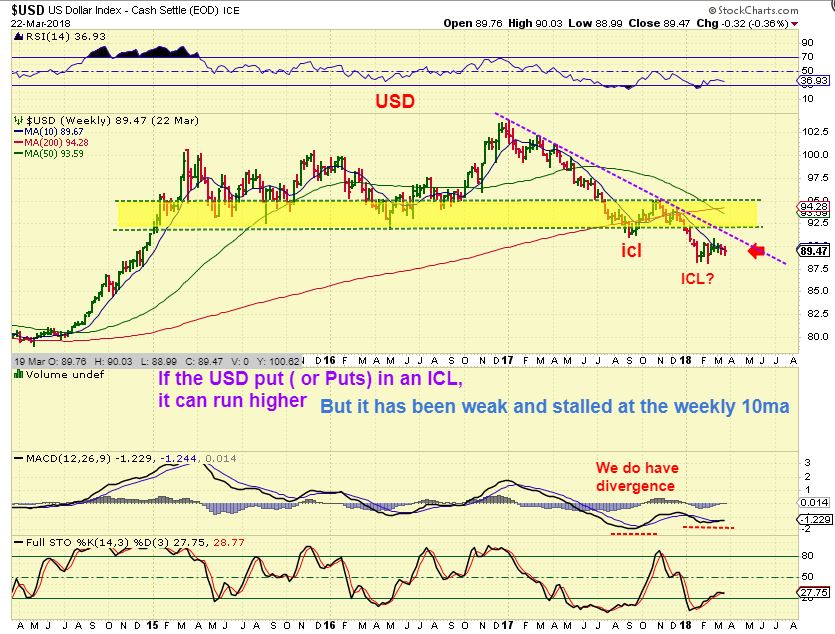
USD – Or a sharp fake out higher and rolls over.
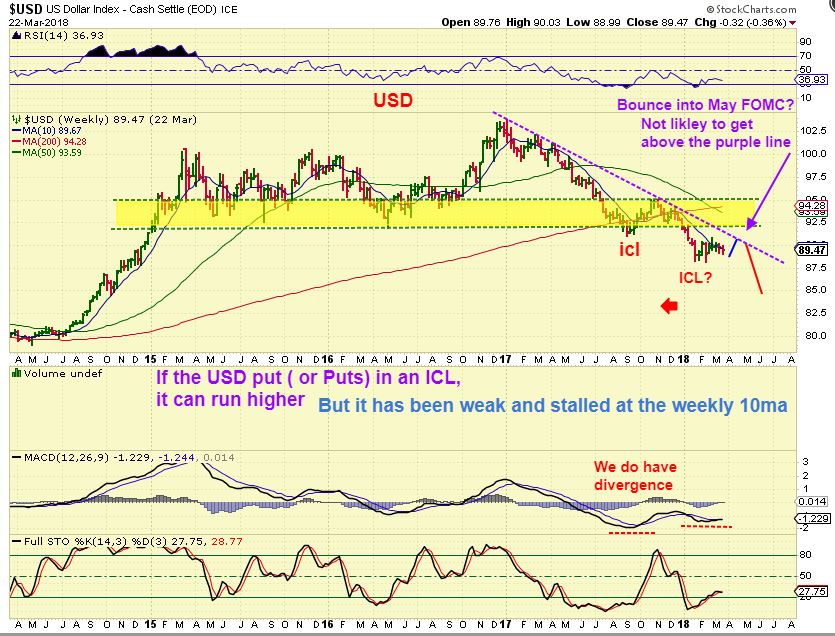
Reminder Chart: I mentioned this in Jan & Feb when discussing the USD break down & weakness. No really visible ICL for 9 months in 2017, that could repeat.
PRECIOUS METALS- The Theme Picture might very well represent this sector in 2018.
I’ve discussed the various differences in Gold, Silver, and Miners in past reports. I’ve discussed the mixed signals & that strange Break down in Miners in Feb below Dec lows as a possible late ICL? So let’s just try to look at WHAT WE SEE HERE & NOW, BIG PICTURE.
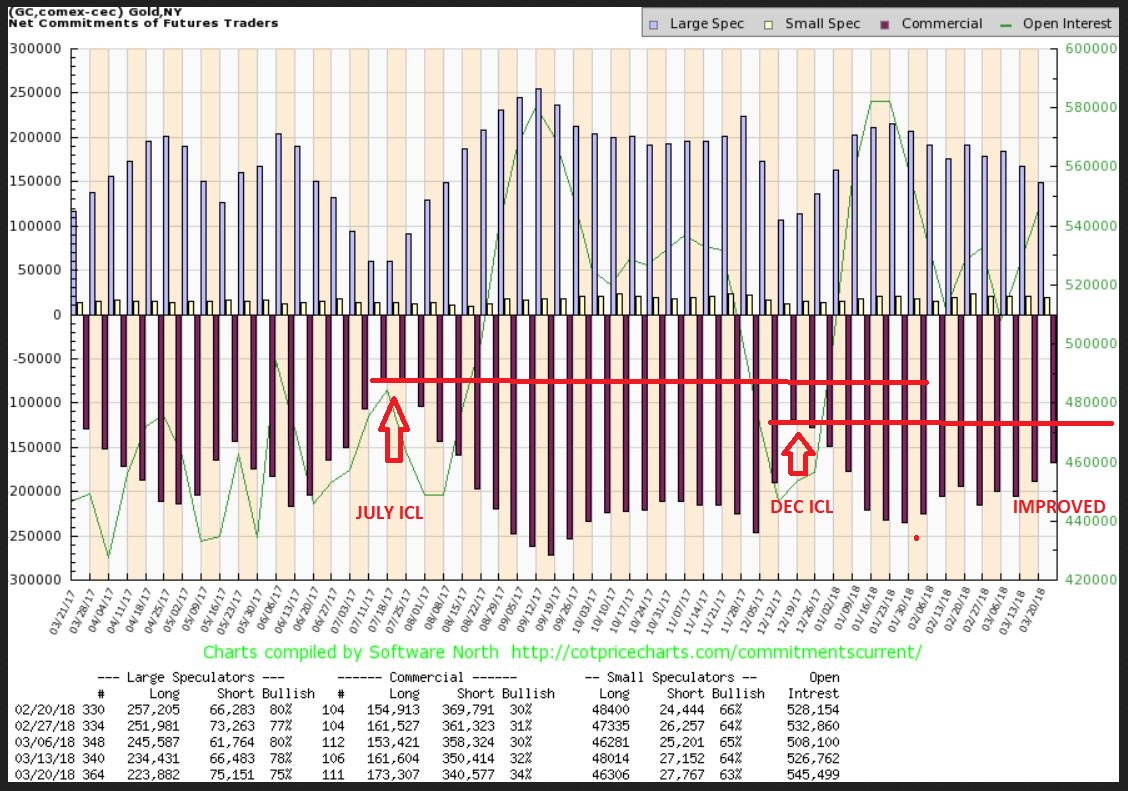
GOLD COT – Improving. Somewhat close to the Dec ICL. Basically, Gold dropped a little, the shorts covered a little.
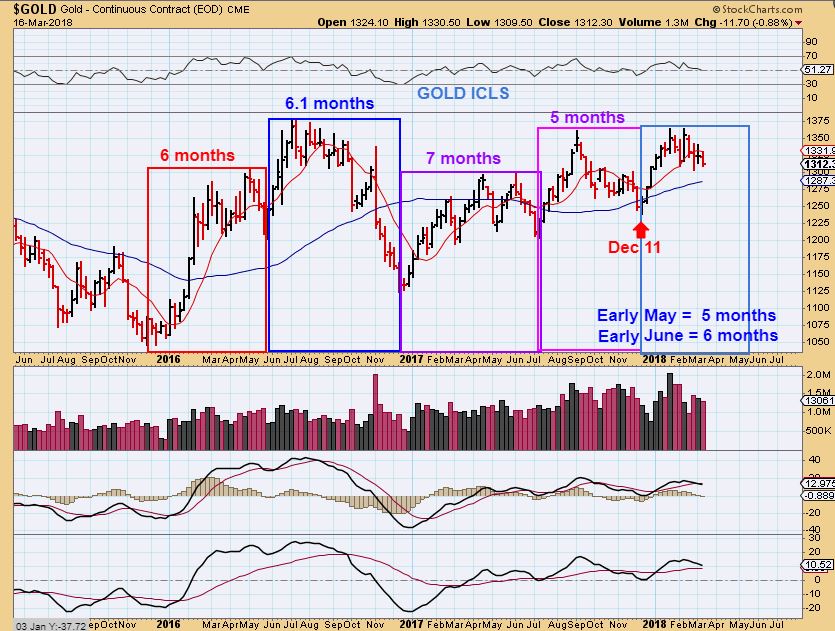
GOLD TIMING – I used this a week ago to show how ‘timing’ usually works in Gold. ICLs are usually 5-6 months apart, but I have seen them 4 months apart. We would ‘anticipate’ an ICL in May or June.
THINGS ARE ACTING ODD HERE TOO. NOT AS EXPECTED UNDER NORMAL CONDITIONS
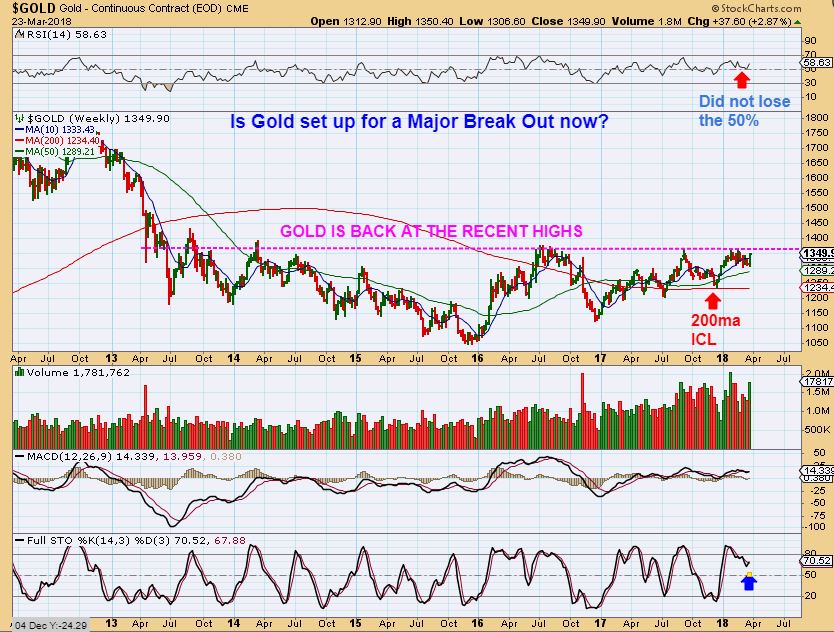
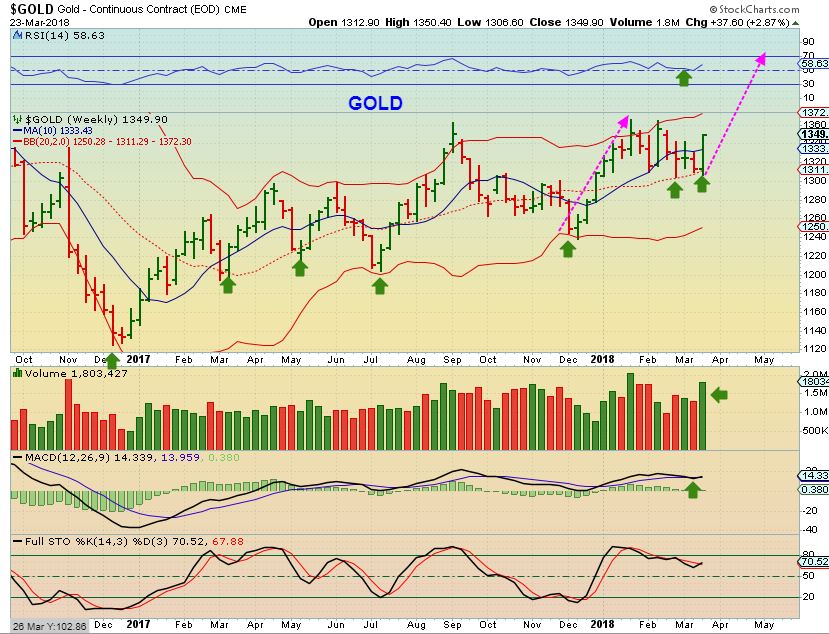
GOLD WKLY – I was asked if this is an ICL because the Weekly broke back above the 10 Weekly MA? Answer: In technical analysis, this chart DOES look very very bullish for now. This chart honestly looks ready to break out, and both the Daily & Weekly look Bullish. ICL? Please read the chart for my thoughts. (But it looks more like a weekly 1/2 Cycle low & still very bullish no matter how you want to label it ).
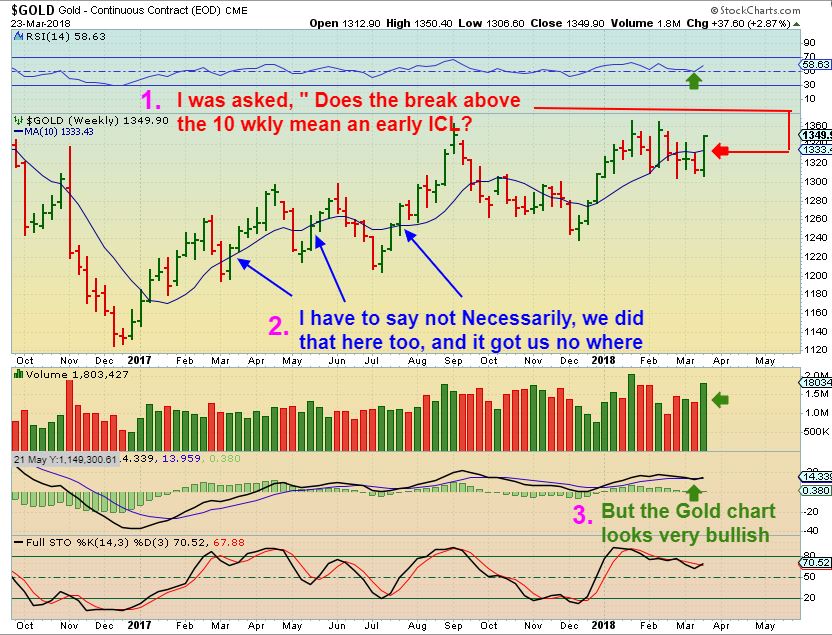
GOLD WEEKLY – The volume surged last week and this actually looks like it wants to break out. THAT would have to be considered Extremely Bullish and we simply see a higher low after a Dec ICL.
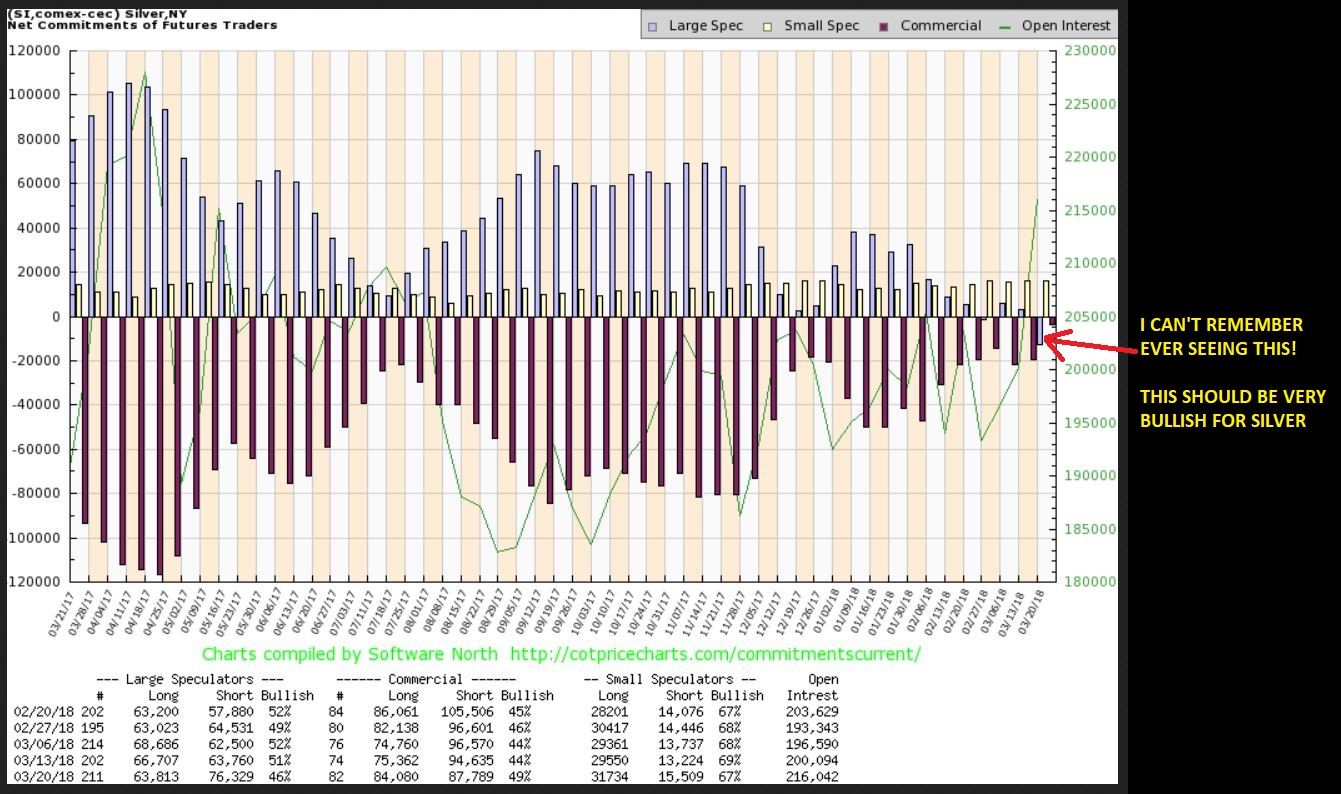
SILVER COT – THIS IS SO SILVER BULLISH! I don’t think that I have ever seen this as Bullish as it is now. ‘Large specs’ ( Called Dumb Money) are shorting Silver. Smart money is not really short now. At ICLs readings haven’t been THIS BULLISH. It is a WOW moment, but the OIL COT has ruined my excitement for COT readings 🙂 Not completely though, THIS says a lot! I think that a BIG SILVER MOVE HIGHER is coming soon to a theater near you!
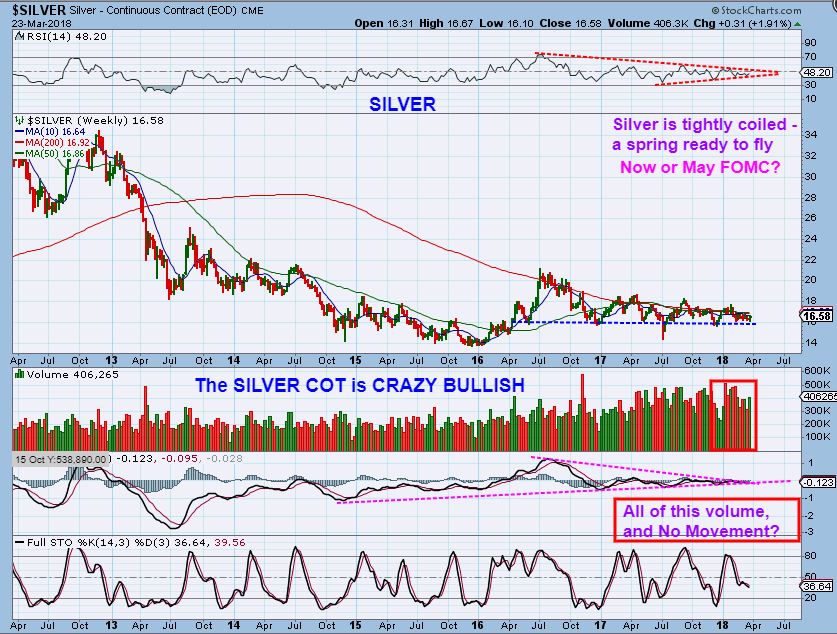
SILVER – And Silver is coiled up so tightly that when it breaks , it should really run strongly. This is a tight weekly spring-like wedge, similar to the year 2015.
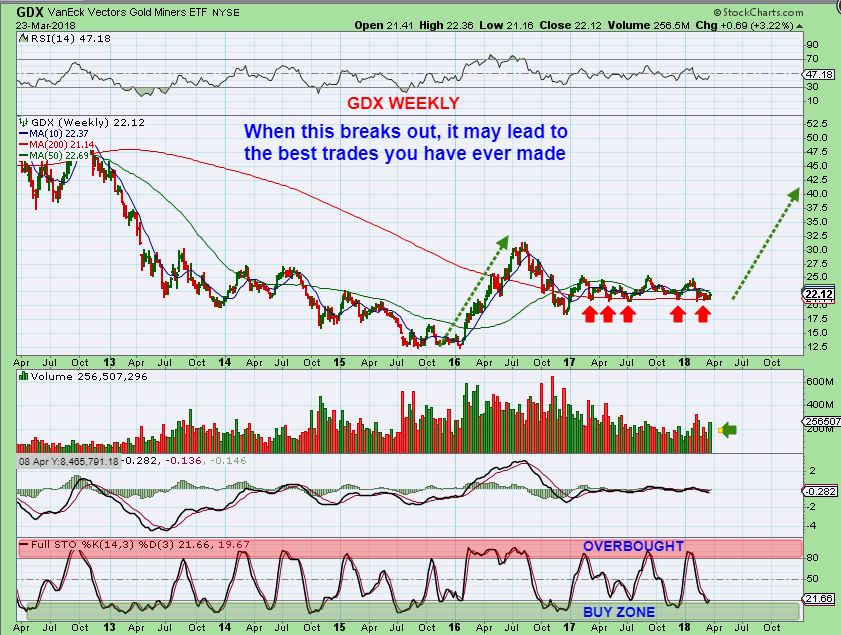
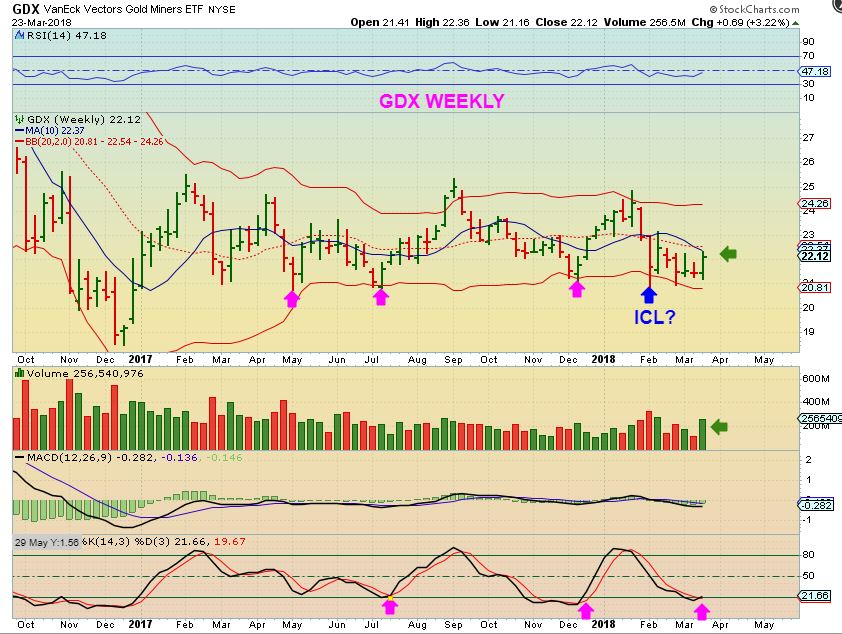
GDX WEEKLY – We have discussed this ‘stop run’ possibility every week as an expectation, but lately I just feel that EVERYONE is watching & drooling to ‘buy this dip / Stop run’. I see people shorting Miners and Silver now. Twitter people have this ‘stop Run / Bear Trap’ chart posted everywhere. ‘BUY THIS DIP’ – so as I have mentioned, I kind of feel that something else will happen.
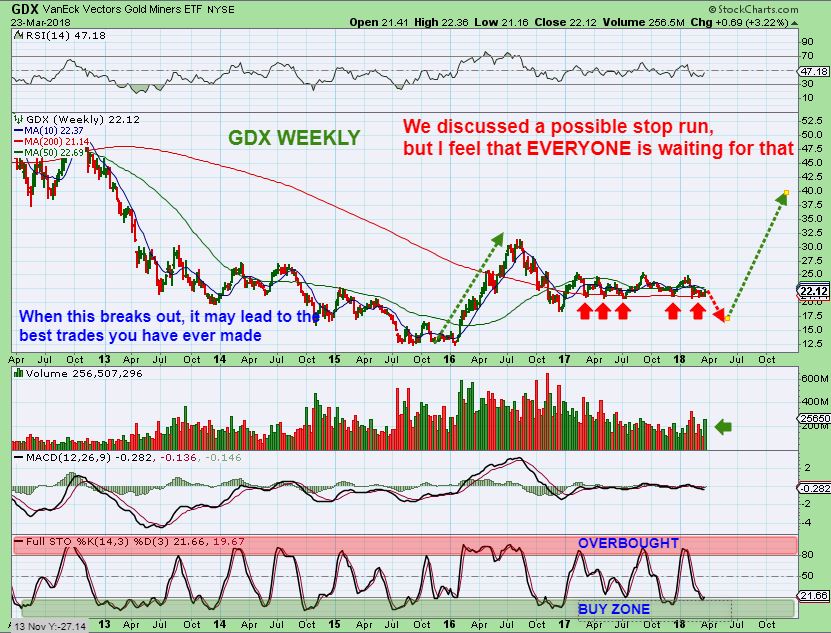
GDX WEEKLY – I have ignored Miners for weeks, but Last week Miners suddenly looked bullish. What if most are ‘shorting here’, and it rises up with short covering? Read the chart.
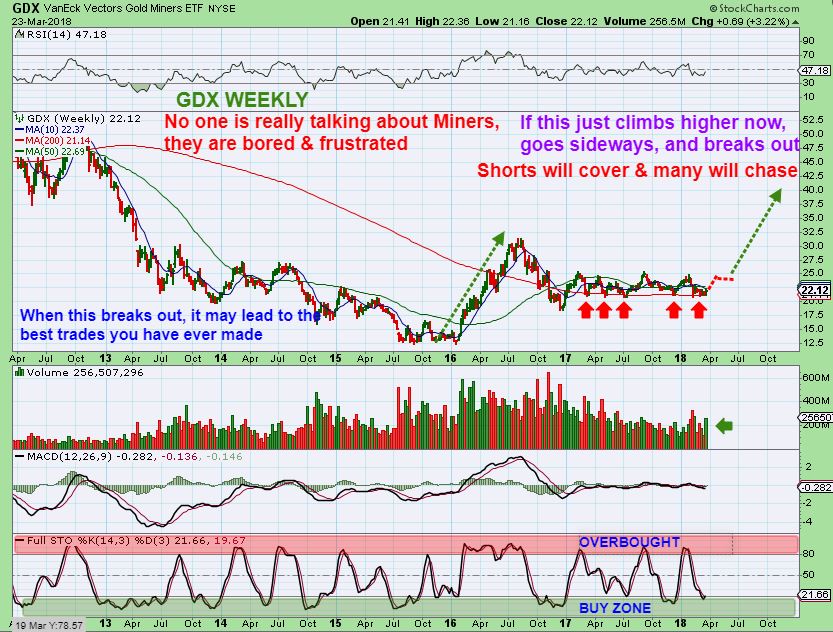
GDX WEEKLY – Look at the stochastics , this is a Weekly chart. This is weekly oversold, and I am seeing bullish Miner set ups. Yes, I am a bit CAUTIOUS, but also optimistic. And also…
GDX & BPGDM (Bullish %) – a certain number of Miners are improving though GDX was at the same prior ICL lows again. This means that Some Miners are out performing as the GDX drops down. Some Miners are not selling down.
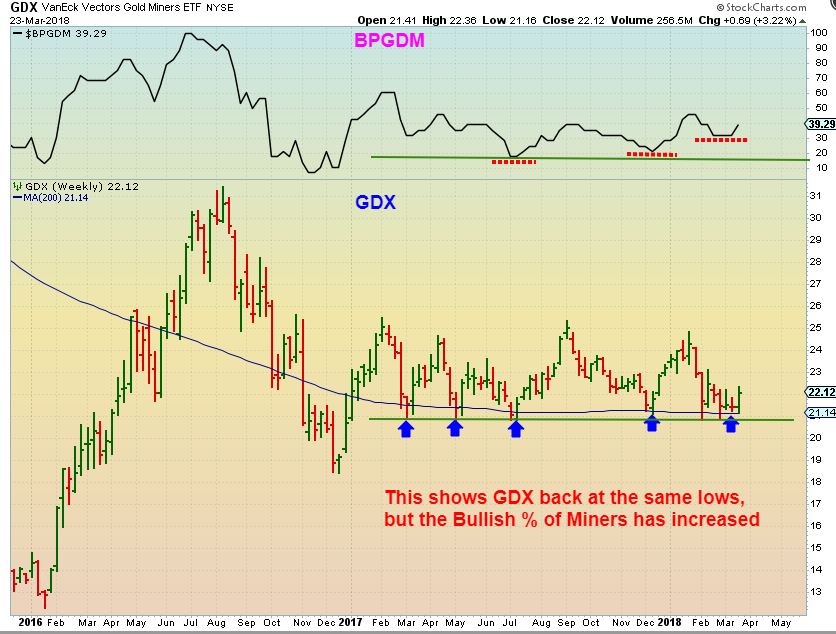
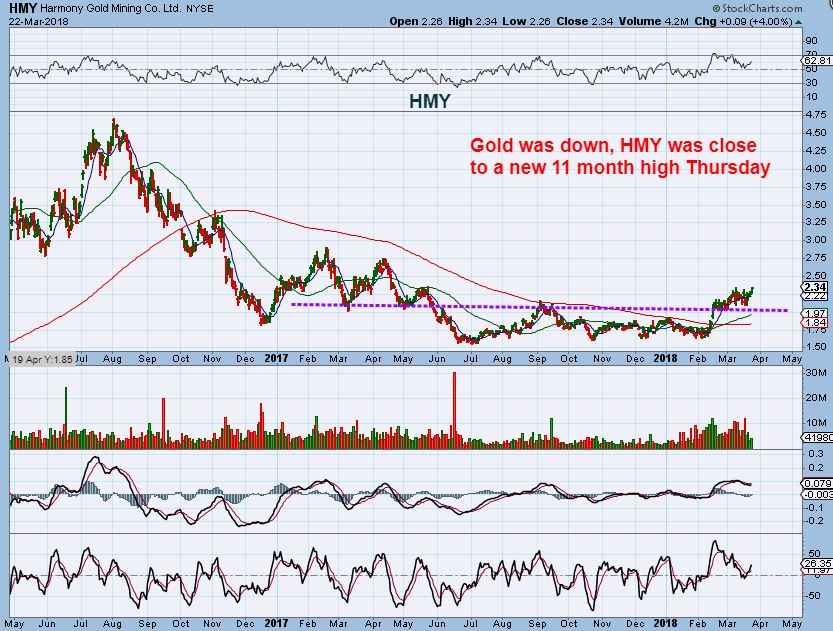
We have seen this improvement with HMY for example. With GDX & GDXJ at Dec lows, HMY and a few others just keeps moving higher, well off of the Dec lows ( 50% higher). That seems like Bullish accumulation.
I am seeing that traders are sick of Miners, they are frustrated, even many GOLD BULLS are shopping in other areas. The ‘Comments section hardly discusses a Miner or two. That said, I visited this sector again to see what I can see from my perspective . Lets look at charts and see if they are UGLY or Healthy?
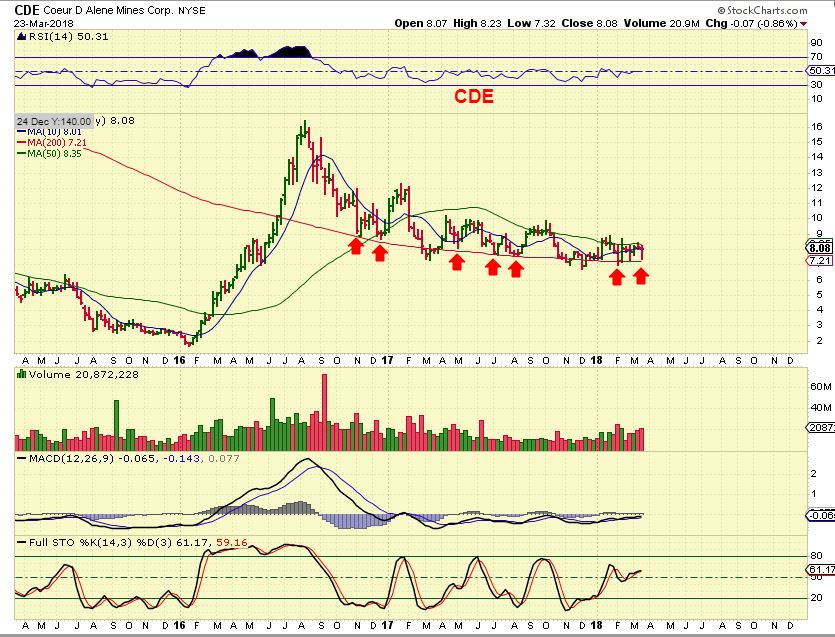
CDE WEEKLY BIG PICTURE – Not ugly, Healthy. NOT easy to ride daily with choppy sideways movement, but this is a longer term bullish consolidation of a massive run higher in 2016.
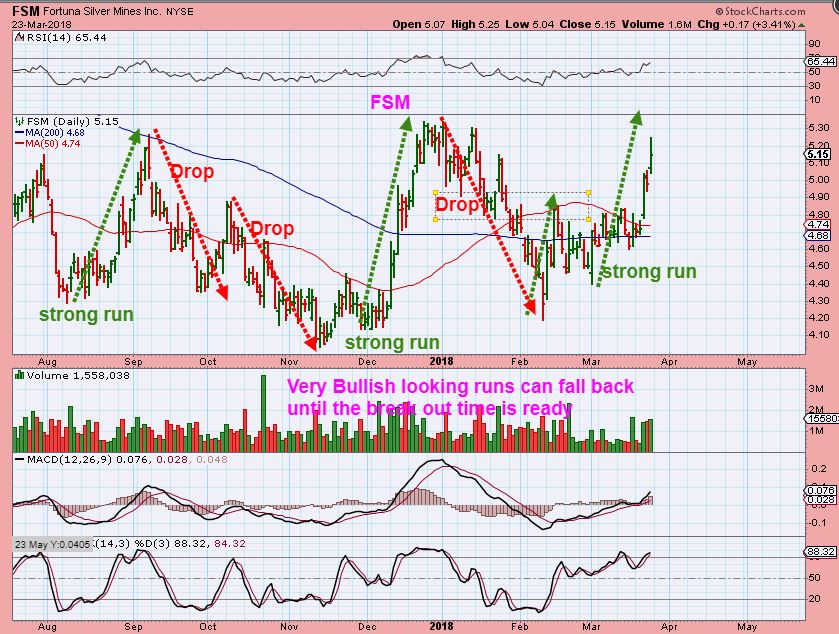
FSM – Easy to ride? NO! No wonder even Gold Bulls hate the Miners. It is hard to make sense of the lack of lasting traction, right? Rapid moves higher have sold off just as quickly, and people feel burned again. I have hated buying ICLs & giving most of the gains back early too, but…
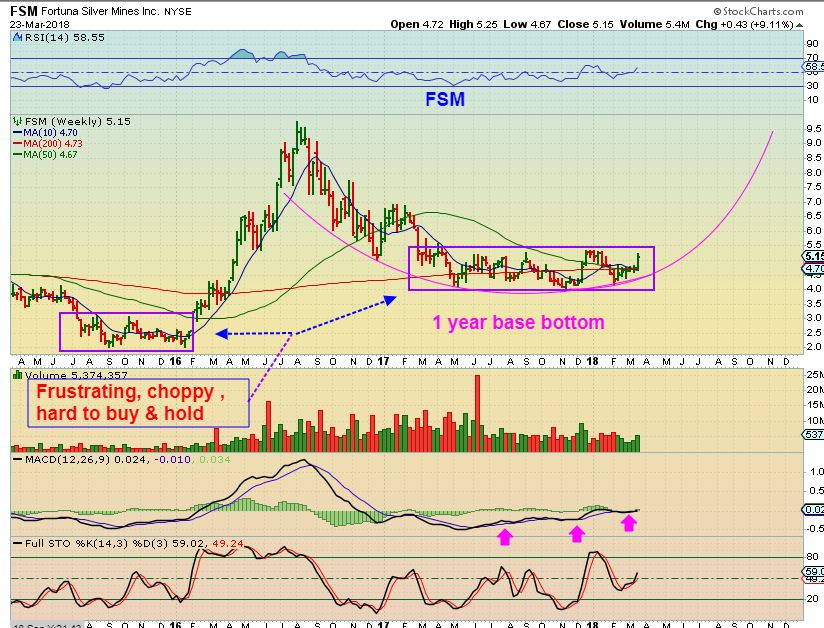
FSM WEEKLY – This is a beautiful chart when you step back and look at the bigger picture. Possibly better than the base of 2015. WE ARE ALMOST THERE FRIENDS!
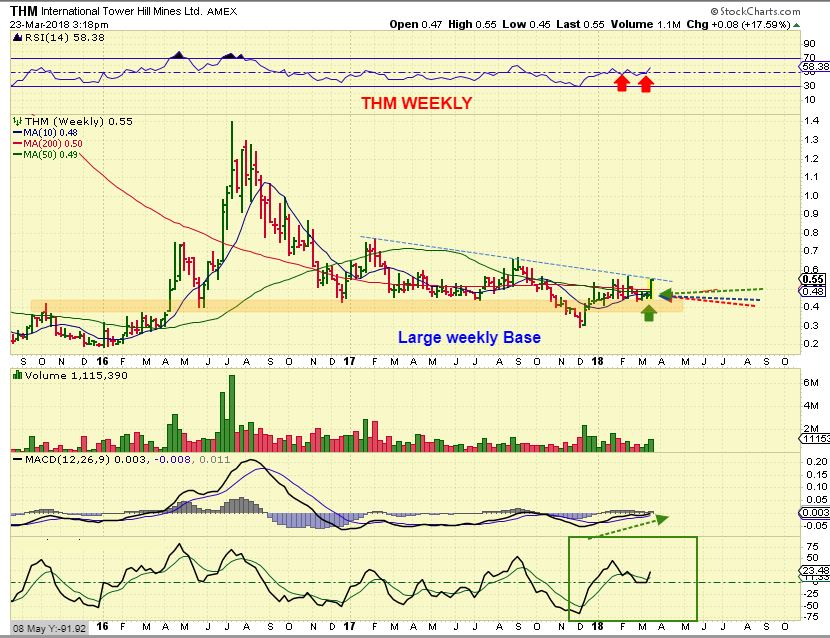
THM – In 2016 this ran up 600%. Last week THM moved up 17.59% and I like the way this is setting up. It is at resistance, but a break higher could do very well.
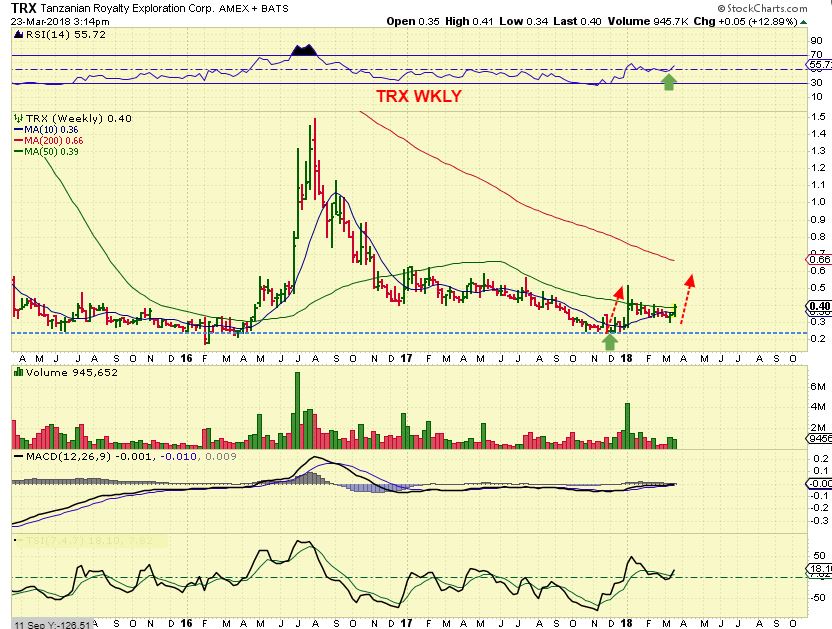
TRX WEEKLY– Last week TRX moved up 12%, and another great Base is forming.
General Markets – What a sell off, but we were not blindsided by it. We expected what we have so far – that Possible double bottom on the 200sma for the SPX). Many of my own indicators indicate that a good bounce should come soon. It may be best to wait for a swing low since it is only day 30 on Monday. That is within the timing, but more downside is also very possible. It would be GREAT to get a slightly lower low Monday and a reversal. Then if price went any higher Tuesday, that would be a swing & that I would say could be bought with a tight stop.
OIL – Oil broke out and the XLE broke the 50sma Wednesday with the inventory report. Some energy stocks looked good, while others seem weak. The XLE does not seem to be holding gains and is near the lows. MY GUT sees that as a warning. Oil is on day 29 ( R.T.), so it will be due for a dcl soon. The XLE does concern me a bit, so I am watching my trades for signs of weakness or strength. I will sell weakness, raise stops on strength. I will also discuss it as this unfolds in the daily charts.
USD – The weekly price action has been sideways and weak.
Gold, Silver and Miners – At this point, what do YOU see, especially as Miners were setting up bullishly leading up to and after the FOMC Meeting? It looks very bullish, and this may not be the Normal expectation 3 months into a Gold Intermediate Cycle, but i HAVE to report what I am seeing.
We had a wedge or triangle in Miners since Feb lows, and POSSIBLY an ICL in Feb that arrived 1 month after Golds ICL, and that happened in 2016. This sector started shaping up bullishly, so I am long and will look for continued follow through. I just cannot ignore this Bullish set up, the Silver COT, Weekly strong reversals with volume, and many Miners gaining strength and not report it here. This is what I see right now.
I discuss all of these Sectors day after day in my daily reports, so you wont be left wondering what is taking place as time goes by. We will examine the day to day activity and adjust trades if necessary. I am thinking of exiting weaker Energy trades after the XLE lost the 10sma Friday with Oil higher, but I haven’t yet. Let’s see what Monday brings our way.
For now- Thanks for being here and enjoy your weekend!
~ALEX
I wanted to show you the B.B. activity in Gold and GDX too. Just another indication that things are leaning bullishly.
GOLD WEEKLY – Using technical analysis, after putting in a DEC ICL, GOLD held the middle band and strongly reversed higher with heavy volume. This looks like a 1/2 cycle dip (1/2 intermediate Cycle ) and really looks Bullish so far. Weekly MACD & RSI agree.
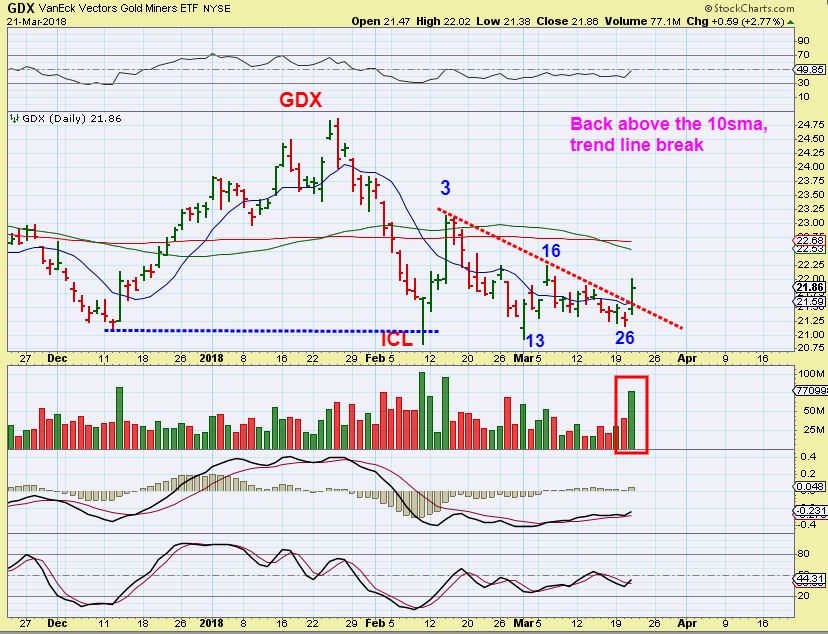
GDX DAILY – I still wonder if GDX put in an ICL 1 month after Gold did, like we saw in 2016. If so, the first daily cycle went sideways above that low, and now a new DCL is in place coming out of that triangle / wedge on a daily chart. In my own experience, a move out of a triangle signals to me a new DCL.
GDX WKLY B.Bands – THE GDX WEEKLY is oversold, has a strong high volume reversal off of the lows, and if it moves higher, it should leave a LOT of people behind. There may be plenty of shorts also, waiting for that “Stop run drop”. That is how I view things until it plays out.
You can see on the chart above that price from LAST MAY TO JULY ( Magenta arrow to Magenta arrow) saw GDX POP & THEN PRETTY MUCH GO NOWHERE to the July ICL. Sure, that could happen again, so for now I am looking for signs of strength or weakness as we go forward, and that is basically all that you can do when buying at the lows. 🙂
March 23 – Fridays Trading 
 One Day Reversal
Scroll to top

Hi Alex, thanks for the great report. If you were to recommend your top 4-5 miners to buy on Monday, who would they be? Time frame is this intermediate cycle.
Bill..
Stairway to Haven … thought of u
Pretty cool..
Giggle
https://www.facebook.com/permalink.php?story_fbid=2134587433490587&id=100008180525043
Haven? Thats where I need to put my money, a safe haven!
giggle
oh long ago i misspelled lynyrd skynyrd .. and u busted on me
w/ stairway to haven
*i laughed for days… ha ha
Tx CF … some wicked cool charts ….
I’ll take cautiously optimistic …4now 😉
I am cautiously optimistic for sure 🙂
Thinking about taking a position in SILJ. Nothing huge though
Maybe ( Hopefully) the Gap closes first?
Yeah. Just thinking out loud for now. Good report this weekend. I cant go all in with things so ‘grey’. I’d love to see something more concrete.
Yeah, I hear you – I’m not ‘All in” either, because Cycle timing for Gold looks mid point and even bullish set ups in the past can roll over when the timing gets late.
Glad to read your report this weekend, I have been observing several of the same things, but you have pointed out others I wasn´t aware of that bolster my belief this might turn out to be a good example of how a bull market shakes off most traders. Personally, I am well invested but not aggressively as I would like or have been like at the December bottom. We all look back and see the obvious entries and exits, yet none of us are billionaire investors bc it´s so hard in real time to act forcefully when you don´t have confirmation, but that is when one has to act if they are going to make the huge gains. Being in early, and being able to hold makes all the difference.
For example, if a stock makes a 20% move before we buy it and on its way to a 200% gain, the guy who bought it before the 20% move nets out a 200% gain, while the guy who buys after a modest 20% move (like some miners often do in a week), only nets out 150% at the same exit price. So the 2nd guy waits for confirmation and pays 20% more, but makes 50% less. That dosen´t sound too bad when still making 150%, but it illustrates the importance of being in early. Not to mention it also makes it easier to hold positions when sitting on big gains, while the second guy might be more inclined to get shaken out as he has less room for error.
The sideways consolidation for weeks and months has made this a pretty frustrating consolidation.
That will end and the good times will be able to erase all of that, but it sure is a long ride ‘real time”.
I’m not nearly as heavy as I am at an ICL like Dec either.
Nice to see miners opening higher than gold itself this morning, maybe a strong stock market isn´t going to steal the thunder from miners as much going forward?
Let us know when you add to your positions, we still have some buying to do!
Hi – sorry I didn’t intend to give you extra work. No worries if you have to do the research. So, regarding my time frame comment. When people have asked you buy/sell recommendations in the past, you typically follow-up and ask them, what is your time frame (or something to that effect). I was letting you know that I don’t plan to hold through the next ICL with whatever I buy this week. I’ll do some digging and run some tickers by you. I’m also thinking of just doing a JNUG/USLV combo and keeping it simple.
AUY, SVBL, KL, EXK, PZG, WPM, PVG
So I ran through these tickers and it is a tough call, because a couple look good, but they are at the top of their Bollinger Bands and at times that leads to a sideways move or pull back. Others look ready to go higher , but have had a bit of selling lately ( maybe at their last earnings) like AUY.
AUY looks good & is only Mid B.B., and is not overbought, but does have resistance a short distance overhead. I’ll post a chart. I like this, but upside MIGHT be shprt-term liimited.
https://uploads.disquscdn.com/images/64aafae51c94a57ae8695f272991f37c510087592916be5b095c05b004ad62bd.jpg
PZG looks good, but low volume at times is concerning WPM Looks very good too, but it above the outside of the B.B. & usually those pull back, so I’d put that on a watch list..
I own EXK and it is near overbought, but they can stay that way – see chart #2
https://uploads.disquscdn.com/images/fdc8ce853aabb9b2ba988b219bbb4d73eb56065f78b3cb06b7698e71c7c80436.jpg
For the reasons in the above charts, KL looks good. Not overbought, room to run, and sits right at the 50sma ( This is probably the better set up).
PVG is VERY interesting to me, there is good upside potential in this on a 3 month chart. Nice base, but that Drop in January is a bit ugly. when they announced a decrease in production, but say that it should increase. I actually think that this stock could do well IF it breaks up from the base.- the problem? look at it with B.B. & 50sma and it is at resistance. None of these seem like a STRONG MUST BUY, because they may be off lows and at or near resistance, but EXK & KL seem good. AUY has a bit more room to the upside as seen on the chart.
With Miners, I was pointing out their bullish set ups the Friday and days before the FOMC MTG, so unfortunately some came off of the lows a week ago and it gets a bit tricky now. It is VERY hard to know exactly where we are cycle wise in Miners. I haven’t had time to go through all of my charts . Maybe this will help?
Awesome. Thank you. I haven’t been using BB as another filtering tool. That helps a lot. Thanks!
Ok, I see what you were saying now on the time frame.- and that IS something at this point that is stuck right in my mind too. My only problem is trying to see hwere w eare in this intermediate cycle, because for Gold I would normally expect a low ( ICL) in May or June, but if ( Crazy though) it broke out of this base, it could Pop, run and an ICL could simply be a higher low at the ‘back test’. That seems a bit too bullish at this point.
Anyway, thanks for clearing that up. I want to look at charts of your tickers.
Anyone else use Ameritrade…? Can’t get their system to work this morning….what a problem here when market is about to open…
I do, and they show that their “Position’ page isnt working, but I can still get quotes, watchlists seem to be up to daye, etc.
It is a nuisance though
It is working now
Mine came back up, then down again….on phone with them, needed to sell something pre market….even their system is down when I am talking with them…..very inconvenient…..guess I won’t be doing much today….have to leave in a little bit….guess folks just lose when they have things they needed to sell….
I feel like I have heard this a lot with TD Ameritrade. I am new with them, and if it continued to happen, I would leave. When I was with Scottrdae and Etrade, the systems never went down.
Up until the past couple of months Ameritrade has been great and I was very pleased with them….but lately…..that has changed….hope they get their act together or I’ll have to do something…
SVBl is really having a good day, big volume as well, couldn´t find any news other than Bob Moriarty had some positive things to say, suggesting it goes to it´s old valuations. Here is that article http://www.streetwisereports.com/article/2018/03/23/bullish-on-silver-bullish-on-silver-bull.html
you nicked my thoughts outta my head (not always a good idea)…
just saw that chart & wondered the same
Thats a very nice saucer formation, right after it shook me out 🙂
Is now the right time to buy OLED? Here is an article on the fundamentals.
https://finance.yahoo.com/news/3-stocks-look-just-ebay-160000041.html?.tsrc=rss
https://www.tradingview.com/x/BRBfySRh/
watching as LG screens strong competition
Due for a bounce, and may be a descending wedge forming that would help a bounce too, but $210 to $103 in 2018 alone seems a bit….. concerning?
Hey Alex
What do you think of this massive gap up in stocks this morning? No swing yet but I am thinking maybe it doesn’t have legs as IWM is fading now…
it is really too early to analyze yet, it would just be a guess at this point
It’s tempting to buy the bounce in stocks this morning. I have bullish signals on my daily charts for TQQQ, etc. However, I saw similar bullish signals on Feb 6 which had apparent follow through on Feb 7 but then rolled over into the big drop on Feb 9. “Picking your bottom is messy business” (pun intended). While I’m watching closely and may take a shot after 8:30 AM to 9:30 AM PT (11:30 – 12:30 ET) Alex’s advice to wait for a swing low on the close is a much safer entry.
EDXC doing well so far.
Short lived……..:-(
I’m gonna finally sell that goat next chance I get!
SBGL upgrade buy by GS.. traded during previous big run .. KL looks better.. NEM also looks good
Just thinking out loud and these are a few things that I am watching –
GDXJ was able to get above the 50sma, but it also did that in Feb and lost it shortly after
GDX is at the 50sma – I’d like to see it push through
Gold is nearing the important $1360 area – or GLD in the 129 area ( which we do not want to see become a Triple top)
Thanks for this, Alex
After reading it, I noticed that Silver & GDXJ are also pressing against their 200day. Push harder…
I decided to sell AREX, it just seems a tad weak at this point.
I want to see OIL break out, and it will be coming due for a dcl.
Still holding WTI for now
GDXJ trying to get through the 200 MA to the upside again, wonder if it stalls for a few days or marches right through it? Or if it turns around a beelines straight to $25, lol.
UVXY nice pop thru 19… see if SPX can hold 2612 for higher bounce
That looks like 5 down from the high this morning, a clearly corrective bounce next is another short setup potentially
“That” looks like = is “That” a stock? UVXY? SPX, DJIA? GDX?
and what time frame is helpful too. Thx
GOOGL.. breaking 200d
FB 144 next potential unless back thru 153
Unpleasant morning gap fill in Twitter.
Enough pessimism in FB for a bounce trade.
I think these names will be very tradeable with increasing swings.
I think a healthy bounce and resume downtrend next week.
Is GOLD breaking out? Just over the trend line……..
https://www.tradingview.com/x/vm0TgFPW/
ABX testing highs for BO
Looks likely from your chart, but not getting excited here. I think it gives it all back within the next few weeks.
Perspective: 20+ year, long term monthly chart from Surfcity. In my view, it portends good things ahead for gold bulls if/when the overhead resistance gives way.
https://uploads.disquscdn.com/images/b651220540398bda3064b047ce633bdad45f7febf5d61d2db8ac7590bd458b05.png
I forget who called the Novo top on Friday, but thank you. I sold right before close and I’m thankful I did.
SGH – THAT is a strong stock with recent selling
Sold WTI for profits until Oil puts in a dcl
Alex, what is your definition of a “swing low?” Does price have to close above the previous day’s intraday high (top of the wick) or just above the previous day’s close?
I actually wanted to ask this as welll..
You want it to better the high of the day of the low., not just the close, and thats an unconfirmed swing low.
Unfortunately when you get a steep deep sell off, a confirmed one takes a bit longer, That is Cycles
In Technical Analysis, some buy the reversal as long as it takes back 50% of the candle of the lows, and place a ‘stop’ below the low ( riskier, but a stop is in place)
Thanks for the explanation. I’m trying to be patient and not jump the gun getting back into stocks. For example, even though I loaded up on TQQQ on Feb 9 at around $135, I could have done almost as well by waiting until the next day and buying TQQQ between $136-137 after it opened above the Feb 9 high and briefly dipped down for the typical morning dip. TQQQ remains a “sell” (down trend) on my longer term indicators so I’m not rushing to buy it back. Currently the P&F chart of TQQQ has a bearish target price of $113!
http://bit.ly/2I7e9G5
I don’t think it will really get that low, but it’s a possibility to keep in mind.
What about now? Man I feel like I constantly miss the lows lol
FOMO!!
I bought my shares back today. 1/2 position, will buy more on any dips, stop below Friday’s lows.
So would you assume that we have that now? Sorta kicking myself now thinking I waited to long to go long again Some plays like TQQQ and CY, lol
Well, DJIA and QQQ might have passed Fridays highs, so that would be an unconfirmed swing.
So yes, on he 1/2 candle trade, you wait for the close ( remember when the markets were Green all Friday and sold off into the close FAST? It helps to avoid that.
Welcome to Wave 3!
CY does look good off of the 50sma). INTC loos fgreat too
and many of those other strong ones that I have pointed out over the weeks ( SGH is too extended, but what a great example )
Great report Alex as usual.. a couple of things I think gold/silver will run break above recent highs . Bull trap(could see gold as high as $1400 ) then a vicious decline into ICL in MAY/ JUNE …… next ICL is the one to load up….. just my two cents.
I like silver here own EXR and AG ……
As a side note: Personally I’d really like to see GDX pushing this 50sma with more volume.
It can increase later, but for now GLD looks like good volume, GDXJ is pretty light
Hmm FIOGF… inching off of rock bottom support.
SPWR, CSIQ, FSLR are good looking charts at this point
dang.. GFI …. lookn good…
Yes, and HMY
KGC breaking the 50sma , SBGL looking good also
mmmHmmmmmm ….. own that one..
not KGC tho.. will look tx
Did you buy HMY way back when I did and hold?
welll .. id LOVE to say i held … alll the way… more like..
in
out
in
out
INNNNN ………………..
Yeah, I got in early, but sold mine around $2.00 and here it is up near $2.50 .
It has held up very well
**was so TIRED of watchn profit get sucked into the vortex… i just took what i could get…
been pretty exhausting… for sure…
will be SUUUCCCCH a relief when the tsunami hits…. ;o)
4-sure
GIVE … lol CLNE a lil push for me.. 😉
was it u who mentioned TXMD?
I’m not sure, but it is on my watch list. Quite the reversal today
Alex, could you explain how you adjust a stop you place near the 10 day MA, once the stock starts to move your way? For example, several days ago I bought MUX around $2.02 when the 10 MA was at $2.96, so this allowed me to buy a good amount and keep low risk to accounts overall as the stop was so close. In your style of trading, do you now move the stop up to $2.06 where the 10 MA is, or do you keep it at the original 10 MA level, giving the stock more wiggle room? I know where we are in a move would affect stop placement, like near the end we might just use a close trailing stop, but in this case of MUX, what do you do just after the trade starts working out, say you are up 10% and only a week or two into the trade?
I have a tendency to give trades a lot of room, but this also necessitates that I have smaller position sizes to keep overall risk manageable. Maybe I am better off long term picking an entry spot with much tighter stops as defined by something like the 10 MA and thus being able to back up the truck?
Hey Nice, Ralph, MuX looks rather good. : – )
What I do varies, and you’ve probably even heard me say that If I go in heavy, I might sell some on the way up, but I know that you ‘d prefer to hold & let it run just in case it does what HMY is doing , for example.
ALSO MUX is now above the 50sma, and I might switch to that as a stop, simply to lock in gains if it went below that area.
So much of my trading is flexible and situational. I am constantly analyzing & adjusting . I cannot wait for the BUY & HOLD for weeks!! SO MUCH EASIER !
So here is the problem with me 🙂
I usually am in front of the screen, so I use Mental Stops more often than not, unless I am going to be gone for the day.
So mentally, I am always checking the chart, the 10sma is usually rising, and I am watching to make sure that EVERYTHING looks ok. I check Gold, GDX, DGXJ, My stocks, the USD< etc etc . THATS why I cant wait for the real break out & run! Just let them go with Loose stops.
If volume starts drying up on the way up as it stretches above the 50sma, , I usually sell 1/2 expecting a dip ( THIS is actually what hurt me on HMY. Volume dried up and it started dipping below the 10sma in a sideways move , so I sold, and then it just consolidated and kept going higher).
Sorry for the story, but I dont just have 1 set rule of thumb – Your question : I Look at how THAT stock has moved around the 10sma in the recent past. If it has dipped under it a little & recovered, I go looser stop, allowing for that movement (Unless a strong sell off in the sector starts(). If it bounces off of the 10sma very nicely & cleanly, I may go slightly tighter stop. And now you are above the 50sma, you could use that as a stop for 1/2 or 1/4 , or whatever you see fit.
Again, sorry for the long story, but It is all situational with my trading, my instructions for the readers are simply "Place a stop here to protect capital' as a safe way to protect funds. 🙂
Thanks, much appreciated and I figured it was a flexible approach with many inputs. I like the idea of just moving the 50 MA for a stop, to lock in profits in a reversal. Or maybe as long as the 10 MA is still under the 50 MA, since the move just started, I could stay with the 10 MA, this gives a little more room but also already would lock in a small gain if the stock reverses.
I like to give them room and push for the big score, that approach is the the single biggest thing that changed my trading results (and financial situation), but I must admit it gets frustrating after a string of trades where I buy them well, ride them up to decent gains, only to ride them back down or even stop out. LOL, we must be getting close or have already seen the bottom, it usually occurs when I start thinking of changing my trading style!
WELL, GLD does look like it wants to run up and break out, and that would be SO bullish, but is it a triple top?
GFX has ‘O.K.’ volume as it pushes the 50sma, but it is not Surging through it with a flood of buying. Maybe tomorrow?
GDXJ is very light volume (At least it is above the 50sma), JNUG only up 2-3%
I’m holding my Miners, but I bought JNUG the day after the FED on the dip, and I am selling that for a bit over $1 / share gain, still holding my other Miners to have skin in the game. This MAY leave me behind if things POP & RUN tomorrow , but I want to lock in some gains.
I just see a GAP under GLD, GDX & GDXJ gapped up too last week, and that gap is at the 10sma. If we get a pull back I will watch JNUG and maybe re-enter but for now I want to lock in some gains.
I do still own EXK, AG, THM, TRX, NAK in this sector. ( And NAK is below the 10sma, but I drew a trend line along the top, and it is a break out, POSSIBLY just a back test now).
Refresh for NAK
https://uploads.disquscdn.com/images/8ea3623aa15e3a2d408e1540f2d448b675beb3739e323f2189f5cd584019759e.jpg
Thanks for posting your thinking and trades, Alex
LAtey they add 15- 20 million volume to GDX at the end of the day, so it may end up pushing on the 50 with strong volume
mannn.. o man… cannot WAIT for TRX and THM to launch….
Stocks look like a good buying opp today, but as Alex says BE CAREFUL and go small if you buy. Have an exit strategy and honor your stops.
Just my https://uploads.disquscdn.com/images/97b39c0f52bb54d7a81d91ddc8df4b2623e238b4283730b39131f94defe18198.gif
AREX back to green, OAS back to Green
( I sold AREX earlier because AREX & OAS were dropping below their 10sma, now recovered with reversals. ).
Holding – NTNX, SQ, MU very strong. AQ nice flag still in place.
JNUG – hmmm, maybe time to toss that one overboard. Slight ouch there.
Are you still holding everything that you mentioned before, TWTR, and others, or just these ones.
CASA is another stronger one
Unfortunately I lightened up on Friday when it looked like even the stuff I’d been holding (which had been so strong) was starting to get hit. Of course Sunday night futs caught me off-guard lol! So, was still wary this morning, but read your report and saw how the leading stks reversed off the 20ema, so added back MU, NTNX, SQ, ICHR to full positions.
Still holding full position AQ as I’d left that alone on Friday.
Not holding any TWTR as I wasn’t sure where all this FB stuff was going; not sure whether I should re-start this one again.
JNUG – only holding 3/4 position now as tossed out 1/4 before the close.
BZUN – interesting one, great earnings, stopped out completely on Friday, looking for re-entry.
What are your thoughts on TWTR and BZUN charts?
Hmmm, this comment looks like a novel, but really it was difficult to access the situation today in the choppiness lol!
Thats actually sounding like it could work out.
You added back and we got reversals today and we could get some follow through. Thre are several that held up rather well in the selling, and the ones you have do seem to be strong.
Its tricky after just one day, but reversals in TNA, BZUN look good ( TWTR may be holding up at the 50sma too).
I would say that you have some good positions
This market is driving me nuts lol.. I love volatility for scalps and such, but man I want to add something and just sleep well, havent been able to in a while
Tuesdays report is out & it is a long one. I just want to add a few reminders to help people manage possible volatility. 🙂